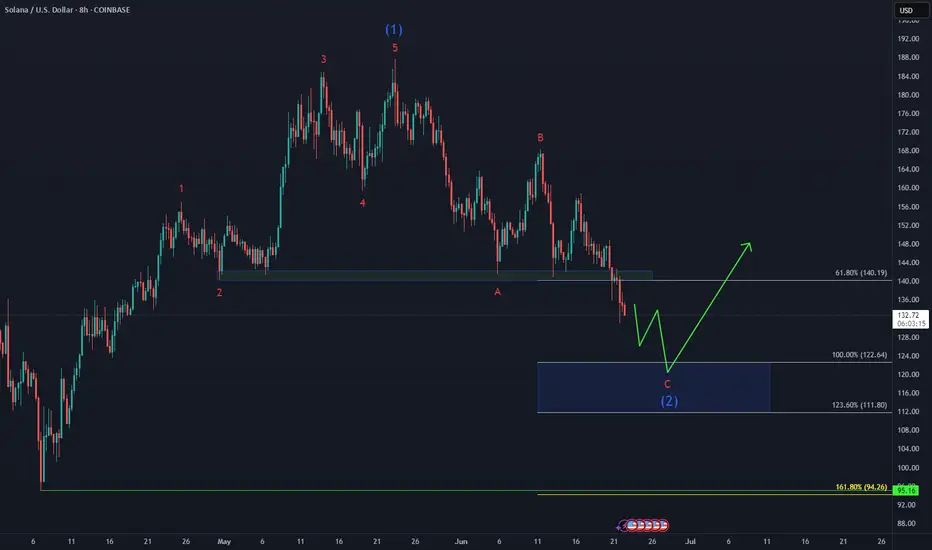
Solana Next Buying Zone on WatchCRYPTO:SOLUSD is correcting the 5 waves advance from April low within a 3 waves ZigZag structure and as price slipped to a new marginal low beneath last week’s support, signaling potential weakness toward equal legs area$122 - $111 before buyers look to step in again.
Keeping an eye on reactions in this zone—could set up for a bullish reversal once demand kicks in!
Altseason
FARTCOIN Loading The BeansCRYPTO:FARTCOINUSD after the initial bounce failed, the correction against the March low is still unfolding within a 3-swing Zigzag, targeting the equal legs zone at $0.75–$0.57 — where bulls are expected to step in for the next blast higher.
Load the beans!! Time to fart!! 💨

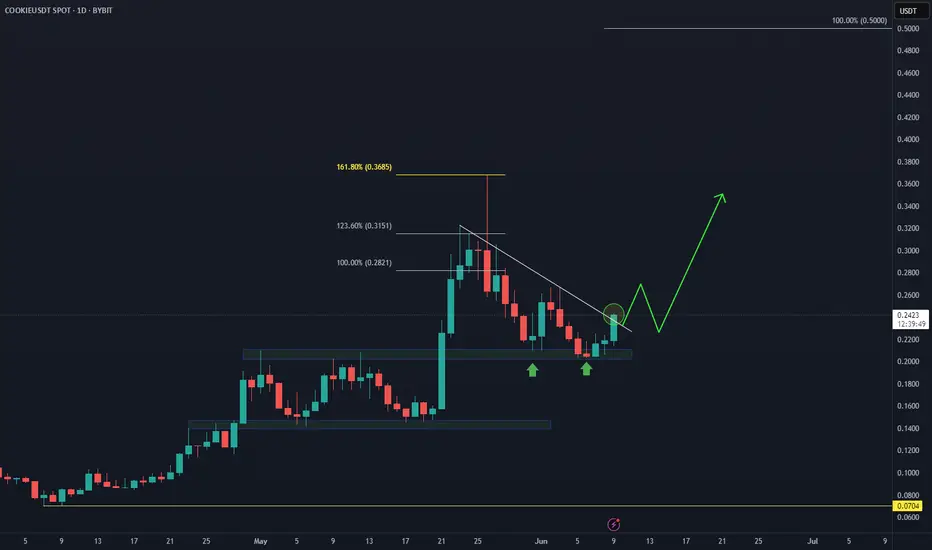
COOKIE Holds Above $0.2—What’s Next?📊 BINANCE:COOKIEUSDT has bounced off the support area at $0.2, signaling the start of a potential upside move that could take it toward $0.5.
🚀 Will momentum carry it higher, or is another test of support coming first?
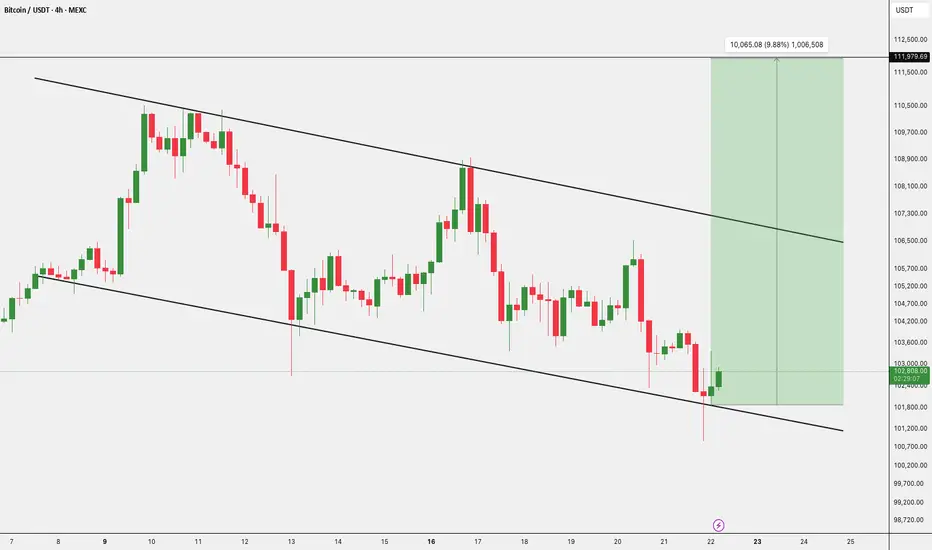
$BTC Bounce Targeting $112K?CRYPTOCAP:BTC is trading within a descending channel and has just bounced off the lower support level near $101,400.
If this rebound holds, we could see a push toward $107,000–$ 112,000.
However, it remains in a downtrend, so any upside may face resistance unless the channel breaks with strong volume.
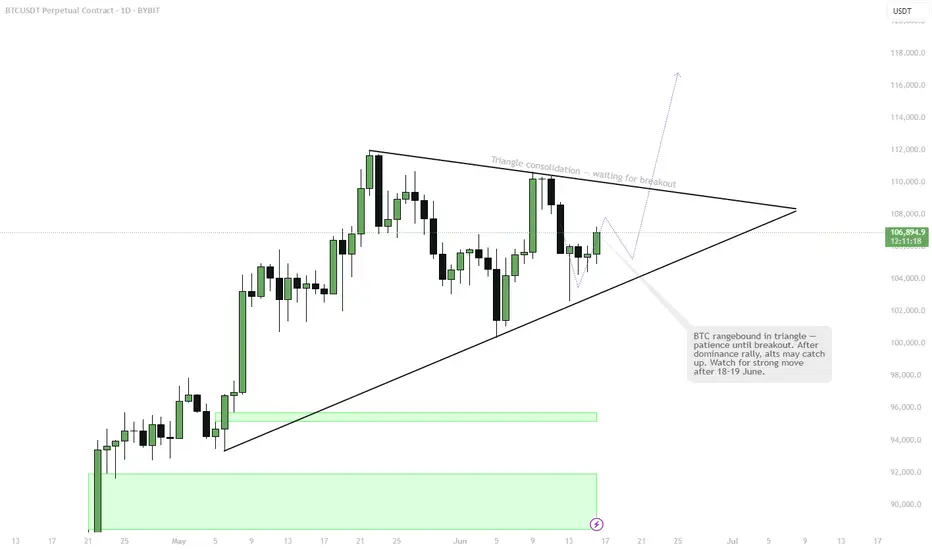
BTC is stuck in a tightening triangle — compression phaseVolatility building up into June 18–19.
Expect a big breakout.
Main scenario: breakout to the upside with a “God Candle” and new momentum for altcoins after prolonged BTC dominance.
Alts have been suppressed, but that’s part of the setup — don’t get tricked by the fake moves.
Stay patient, don’t lose focus, and be ready for a sharp move!
Ethereum’s Last Chance: Let Jesus Take The WheelEthereum’s price action over the course of this crypto bull run, and especially since the beginning of this year, 2025, has been nothing short of horrendous. It’s failed to hold almost every single important level that it needed to, to be able to keep pushing higher. This has caused almost all crypto investors and altcoin traders to pull their investments out, and drive the price even lower. At its current point, altcoin traders have lost all but 100% of the confidence they once had in it, and to retail investors, this is basically toxic waste once they see the losses that have been taken, it’s driving them away en masse.
With that being said, this is ETH’s final stand, it’s time to either show out, or go home with nothing to show for itself. It’s at a very critical support level right now, and if it breaks down below this, the trade will be cancelled. It’s just finished completing the ‘Jesus Take The Wheel’ pattern on the weekly & MONTHLY. This is an extremely high probability pattern, and could cause a blow-off top for Ethereum.
We also see that we got a Wykoff Pattern here, with the last one that we got around the $2k level being a fake out. The only other times it has printed aside from the last fake out, it has been the start of a bull run. ETH now has 6 weeks in total, or about 4 more weeks from now to start recovering old levels, and taking off to the moon.
I drew a bar pattern on the chart that I took from its original bullish pattern from the start of the 2013 bull run. I believe we’ll have a shortened cycle, and due to not having much time left to complete the bull run during this 4-year cycle, that’s all we will get. Thankfully, the price has been beaten down so much, that getting in now, will offer 1000% gains, in just about 6 months. This will be one of the most incredible feats in all of crypto.
Fear is at an all time high, and ETH has been teasing everyone with a bull run for months and even years now. We haven’t seen an all time high since 2021. Most investors will suffer from boredom exhaustion as well, and with the stock market also sinking, we could see a huge push once we recover some levels, for the masses to finally come into the market via Ethereum ETF’s, so they don’t have to actually risk any money moving crypto around. The boomers and traditional investors with stock accounts will be free to throw cash at these ETF’s and that’s what will give us our final pumps past all time highs, once the crypto traders all get back into the market, and get us to new ATH’s in the first place, and help us recover key levels.
One thing is clear: ETH needs to stop trying so hard to control its environment, it’s time to just let Jesus Take The Wheel 🚀

ALTCOINS: Market bottomed and about to surge.The Altcoin market is almost oversold on its 1W technical outlook (RSI = 30.160, MACD = -0.160, ADX = 18.210) but this very same 1W RSI pattern has emerged numerous times before an altcoin market surge (Altseason). How high it can go depends on whether the Fed will cut on its next meeting or not. Nevertheless, this level is an excellent opportunity to start investing in altcoins.
## If you like our free content follow our profile to get more daily ideas. ##
## Comments and likes are greatly appreciated. ##

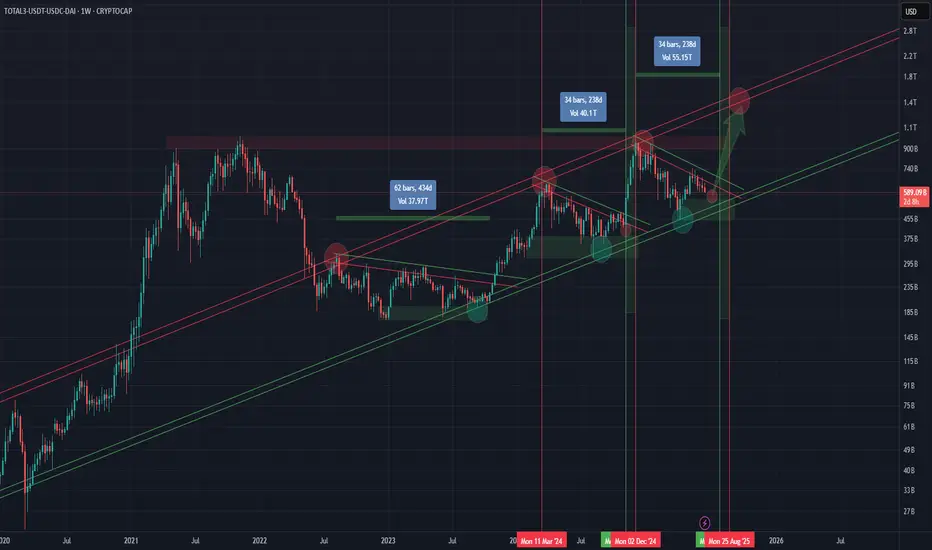
PURE TOTAL 3 ALTCOIN INDICATOR without stable coins, BTC and ETHCRYPTOCAP:TOTAL3-CRYPTOCAP:USDT-CRYPTOCAP:USDC-CRYPTOCAP:DAI
Original idea inspired by trader SpartaBTC — highly recommend checking out his page.
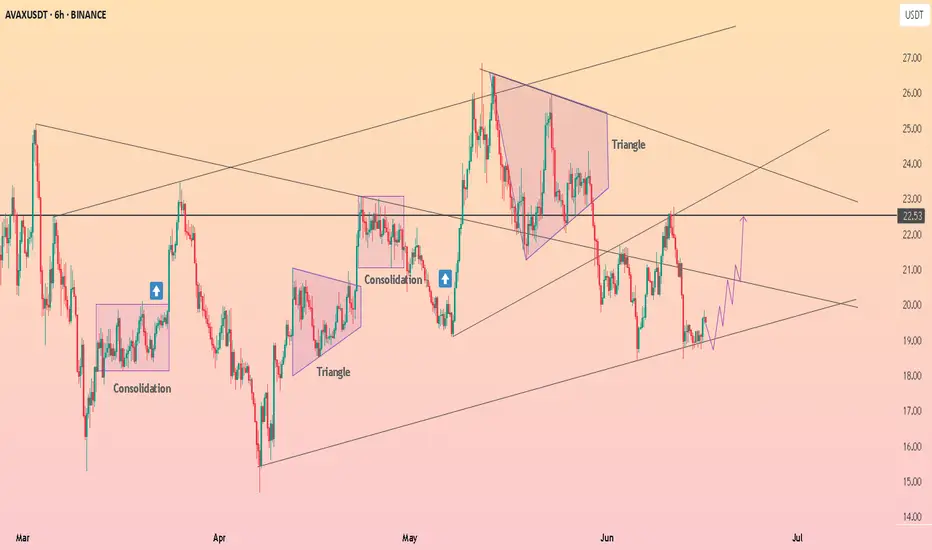
HolderStat┆AVAXUSD held the trend lineBINANCE:AVAXUSDT is rebounding from the 19 support after a falling-wedge break, flipping the pullback into bullish continuation. Holding the trend-line keeps Avalanche pressed north; clearing 22.8 unlocks 25 and fresh-highs narrative 📈
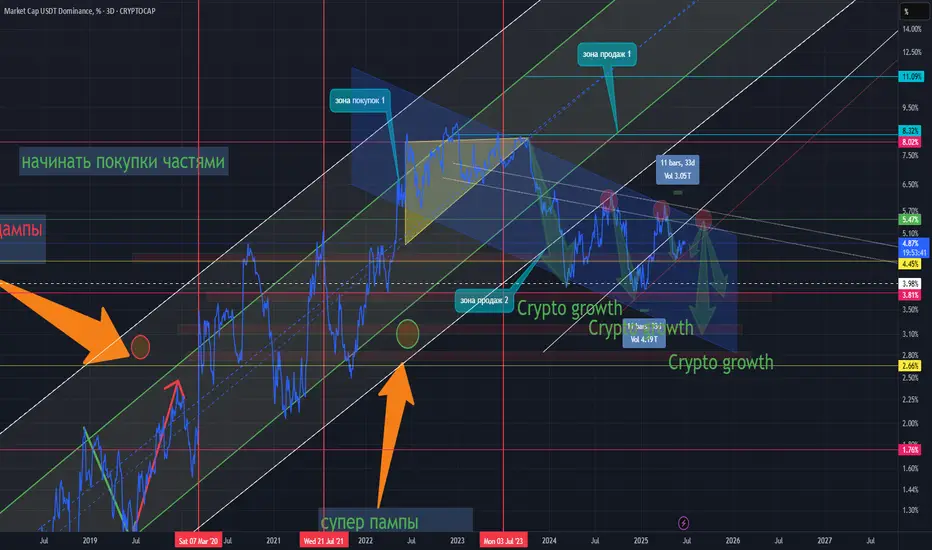
USDT.D Original idea inspired by trader SpartaBTC — highly recommend checking out their page.
On the chart, we can clearly see a descending channel. Historically, every time the price touched the upper boundary and started moving down toward the lower one, it marked the beginning of a broader crypto market rally.
Potential targets are shown on the chart.
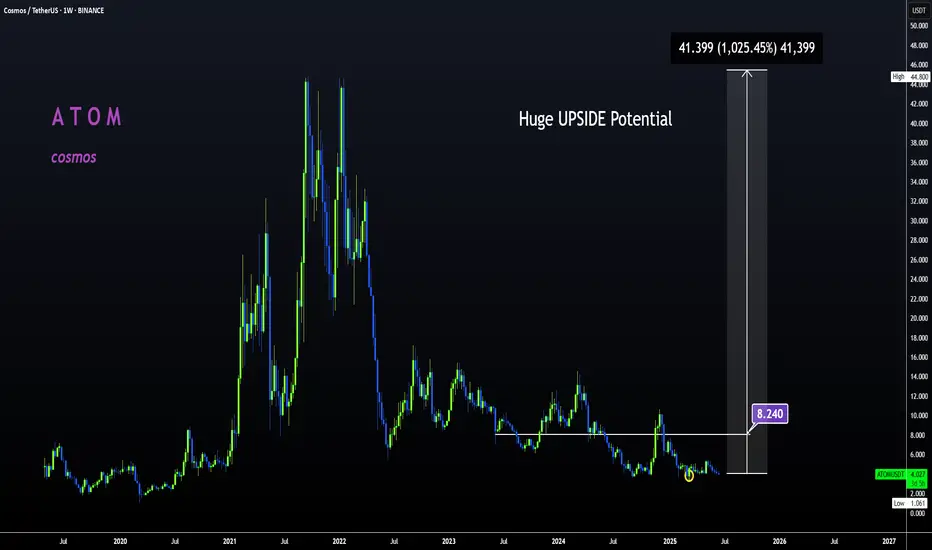
ATOM | SLEEPING GIANT | Altcoin GEMATOM is an alt that I have high expectations for.
From a 4h perspective, we can see the short term price is still very bearish.
This is confirmed by trading under the moving averages, which indicates that the sellers are in control.
The great news about this is that the price doesn't stay long UNDER the moving averages in the 4h. From the chart below, we see a very evident bearish trend - the price STAYS under the moving averages, with occasional, random wicks above and to the upper purple (200d MA).
After the bottom, marked the " BIG TURNAROUND ", we see the price trading mostly just under or just above, as we observe range trading. This is how we know, the bottom is in / close. And from here, it's only a matter of time until we start turning around to another bullish cycle . Where the gains far outweigh the risk.
Following this logic, the next reasonable ( very reasonable ) target, is the purple moving averages, and beyond. Currently at $4.3, a nice +8% from here.
_______________________
EIGEN/USDT – Falling Wedge Breakout Setup | 4H ChartEIGEN is currently showing a bullish falling wedge pattern near a strong horizontal demand zone, indicating a potential reversal move.
Technical Breakdown:
Entry Zone: $1.17 – $1.18 (current market price)
Stop-Loss: Below $1.14 (last wick low/invalidation of wedge)
Target Price: $1.74, $2.51 (+118%) from CMP
Resistance 1 (Minor): $1.33
Resistance 2 (Major Target): $1.74
Support Levels:
• $1.17 (Immediate support)
• $0.749 (Major demand zone if breakdown)
Target & Risk-Reward
Target Price: $1.74, $2.51 (+118%) from CMP
Stop-Loss: $1.14
Risk per token: ~$0.03
Potential Profit per token: ~$0.56
Risk:Reward Ratio: ~1:6.5
Potential Gain: +118% from entry
Indicators:
Falling wedge breakout looks imminent
RSI (14) at 39.5 — recovering from oversold zone
Demand zone previously triggered rallies — the probability of a bounce is high
Strategy:
Wait for a 4H candle close above the wedge trendline + volume confirmation to validate the breakout. Scaling in near support with a tight stop-loss can offer a strong risk-reward play.
Not Financial Advice – This is a technical view for educational purposes. Always DYOR & manage risk accordingly.
Like & follow if you found this useful!
#EIGEN #Altcoins #Breakout

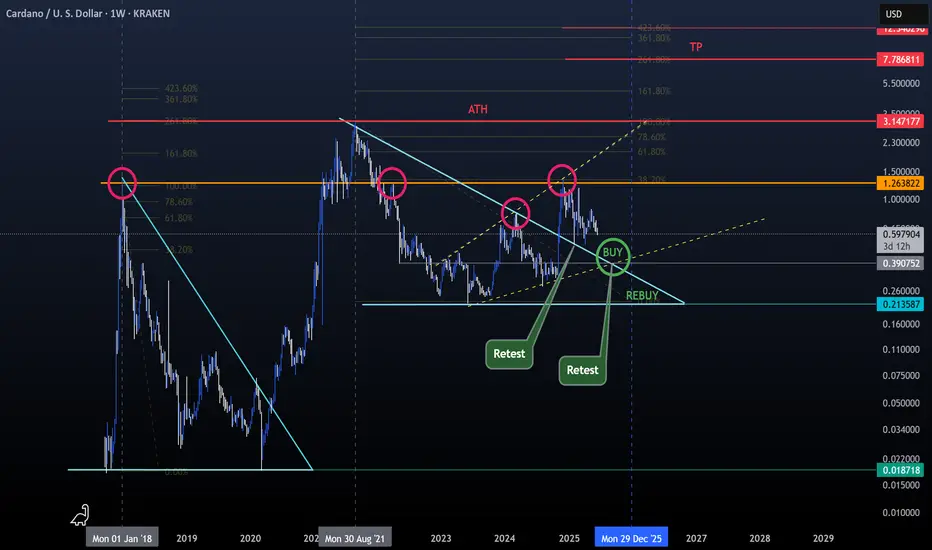
Cardano UpdateA lot of you have been DMing me asking for altcoin analysis. i hear you, but here's the truth:
- Right now, most altcoins are simply too weak to offer a reliable forecast. I prefer to post when timing makes sense, not just for engagement, but to avoid misleading anyone.
- BTC Dominance is still heavily suppressing the altcoin market, and I’d rather wait than risk rekting my followers with premature calls.
So why do I post about Cardano? :
- Simple, Cardano is one of the most established altcoins. It makes sense to track its evolution alongside Bitcoin and Ethereum. When you're analyzing the broader market cycle, starting with BTC, ETH, and ADA gives meaningful context. Newer cryptocurrencies from 2020+ don’t have the same historical data, which makes reliable analysis much harder.
Back to Trading (Everything is marked on the chart for easier reading) :
- Cardano got rejected around $1.25, which aligns with its 2018 ATH, a key historical resistance.
- Check the bullish megaphone pattern and how it connects with the trendline and that $1.25 level (marked with yellow dotted lines).
- Also observe the minor bounces and retests above the bearish triangle trendline (light blue).
What we can do now?
- Nothing. If BTC dips, altcoins will likely follow and get rekt.
Best strategy for now:
- Consider setting a buy order around $0.41 (don’t go all in).
- Keep some dry powder in case of further downside, potentially to rebuy around $0.21 if pressure continues.
Be wise, be patient, ride the wave, don’t fight it.
Happy Tr4Ding !
HolderStat┆XRPUSD correction from the trend lineOKX:XRPUSDT found footing at 2.09 and now grinds beneath descending resistance. Regaining 2.18 should unlock a glide toward 2.25-2.35 inside the larger bull channel, whereas failure to defend 2.05 risks a trip to 1.95 reload territory.

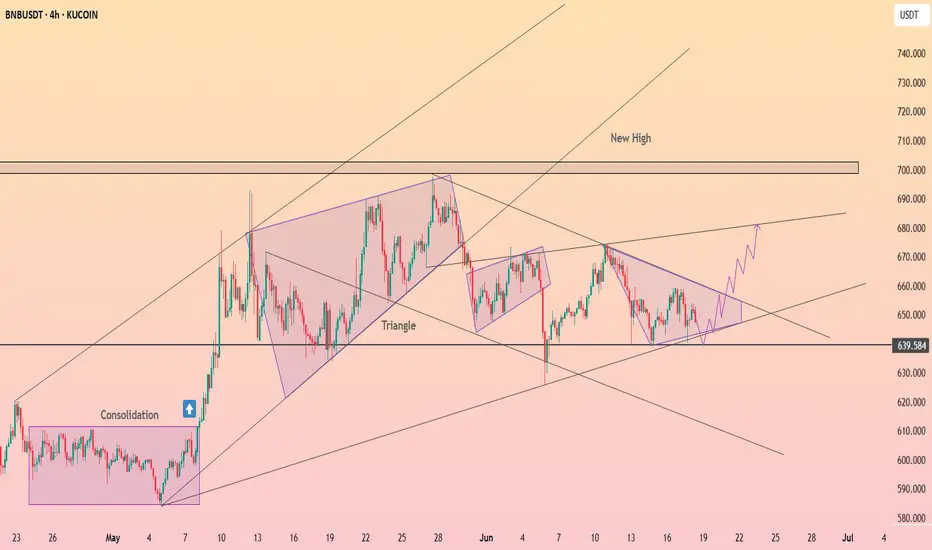
HolderStat┆BNBUSD held supportKUCOIN:BNBUSDT keeps coiling inside a contracting wedge above the $639 launchpad. A 4-h close over 650-655 can spark a thrust to 680 and revive the 700–710 “new-high” box; slip-back under 630 delays the breakout but leaves the structure intact 🚀
HolderStat┆ADAUSD retesting of the $0.6 levelBINANCE:ADAUSDT is orbiting the major $0.6000 shelf inside a fading down-channel. A lift through 0.63-0.64 would flip short-term momentum and open a swift path toward the mid-$0.70s, while a daily close below $0.58 cancels the run-up thesis 📈

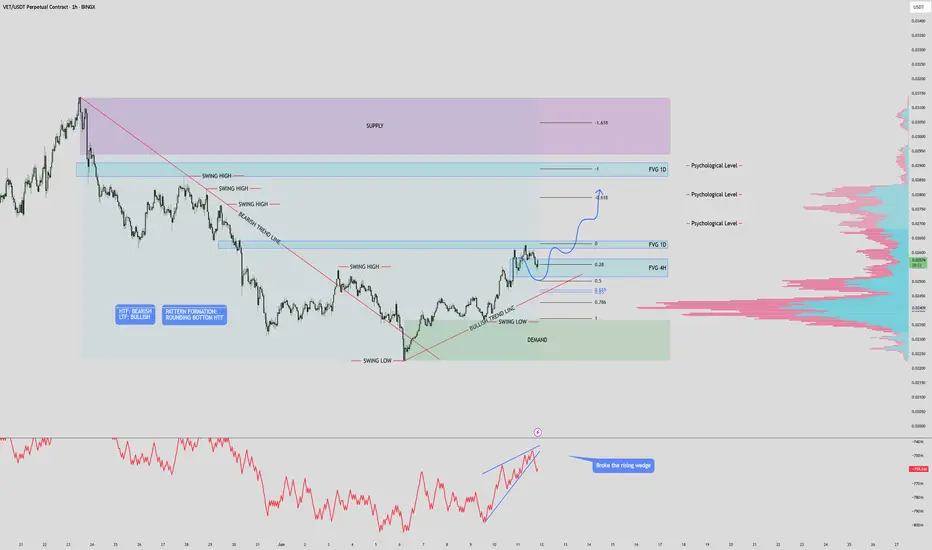
$VET USD 1HR INCOMING PUMP?Structure & Zones
Price is trading between a clear supply zone above and a demand zone below, offering defined areas for reaction.
Two unfilled FVGs on the 1D timeframe above current price could act as magnet zones for price continuation.
A 4H FVG just beneath current price is nearly filled — potential area for a bullish bounce.
Three psychological price levels are marked and align with Fibonacci and FVG targets, likely to act as resistance zones if price pushes higher.
Trend & Pattern
High timeframe (HTF) remains bullish, supported by the formation of a rounding bottom — a strong reversal structure suggesting accumulation.
Lower timeframe (LTF) is showing short-term bearishness as price pulls back and retests key support/trendline.
Price is holding above a bullish trendline, maintaining structure unless a breakdown occurs.
Volume & Momentum
The OBV indicator shows a broken rising wedge, signaling a possible momentum slowdown or short-term correction.
Anchored volume profile reveals high volume beneath price — indicating that previous trading activity supports current levels and adds bullish confluence.
Outlook & Trade Consideration
Bias remains bullish overall, supported by HTF structure and unfilled FVG targets above.
A potential pullback into the 0.5–0.618 fib retracement zone or into the 4H FVG could present long entry opportunities.
On continuation, price may target the daily FVGs and psychological levels as resistance or take-profit zones.
Watch for a rejection at fib/psych levels or breakdown below the bullish trendline to reassess bias.
TRBUSDT Long with good RRTRBUSDT with bullish pivots, follows with divergence on smaller time frames, possible reversal with FakeBO, a good Risk Reward. First 85 daily target on fibonacci levels.

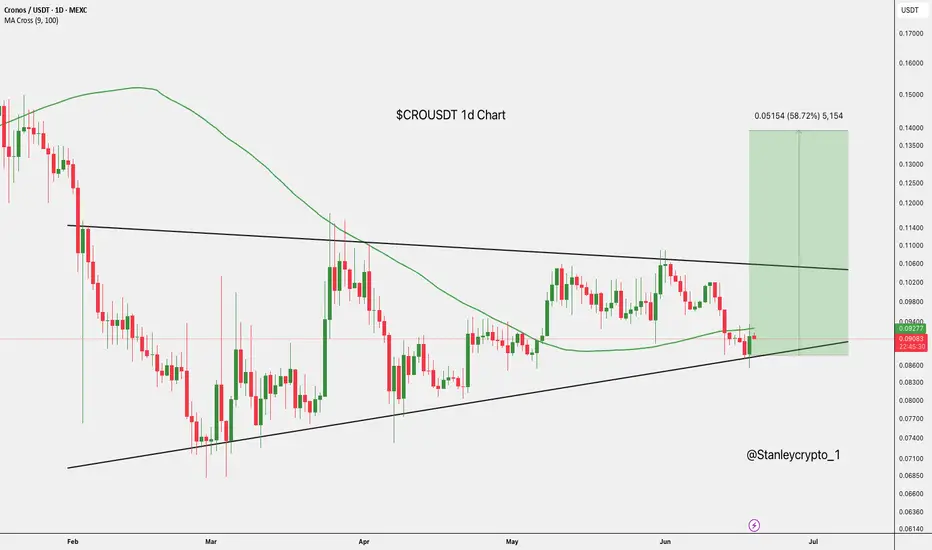
$CROUSDT Eyes 59%CROUSDT is consolidating in a symmetrical triangle, holding above trendline support and testing the 100-day MA.
A breakout above $0.10595 could trigger a bullish move toward $0.14001, offering nearly 59% upside.
Bitcoin 4-Year Cycle Structure – Technical BreakdownBitcoin 4-Year Cycle Structure – Technical Breakdown
This chart examines Bitcoin’s historical 4-year cycle behaviour, focusing on the repeating market structure observed across the last three cycles: Bull Market → Bear Market → Accumulation/Recovery → Halving → Expansion.
Key Observations:
🔹 Cycle Timing Consistency
Each of the past three cycles has shown a consistent duration between the halving and the final bull market peak—typically between 500–550 days. Based on that timing, the current cycle suggests we are still ~100 days away from a potential macro top.
🔹 Post-Halving Correction is Expected
Corrections shortly after the halving have historically marked mid-cycle retracements, not macro tops. The current pullback is structurally aligned with the 2017 and 2021 expansions, where Bitcoin consolidated before pushing to final highs.
🔹 Altcoin Market Segments Lagging
TOTAL2 (Total Market Cap excluding BTC)
TOTAL3 (Excluding BTC & ETH)
OTHERS (Altcoins excluding top 10 by market cap)
All remain below their prior cycle all-time highs, which historically occurs before the full market cycle concludes. These segments often accelerate after BTC has established dominance, typically in the later stages of the bull market.
🔹 USDT Dominance Suggests More Upside
USDT.D is still trending down, which historically reflects increasing risk appetite and capital rotation into crypto assets. Prior cycle tops have aligned with much lower dominance levels, indicating further downside risk for USDT.D, and potential upside for crypto markets.
Conclusion:
Despite short-term volatility, the technical structure across Bitcoin and broader market indicators suggests the cycle remains in its expansion phase. Timing models, altcoin lag, and dominance signals all point to further upside potential before a full cycle peak is in.
1W:
1M:

HolderStat┆BTCUSD forming a triangleBINANCE:BTCUSDT is bouncing from the 104 k pennant foot on trend support, turning squeeze into bullish advance. Holding the rising line preserves upside bias; clearing 111 k unlocks 121 k and ATH chase 🏆

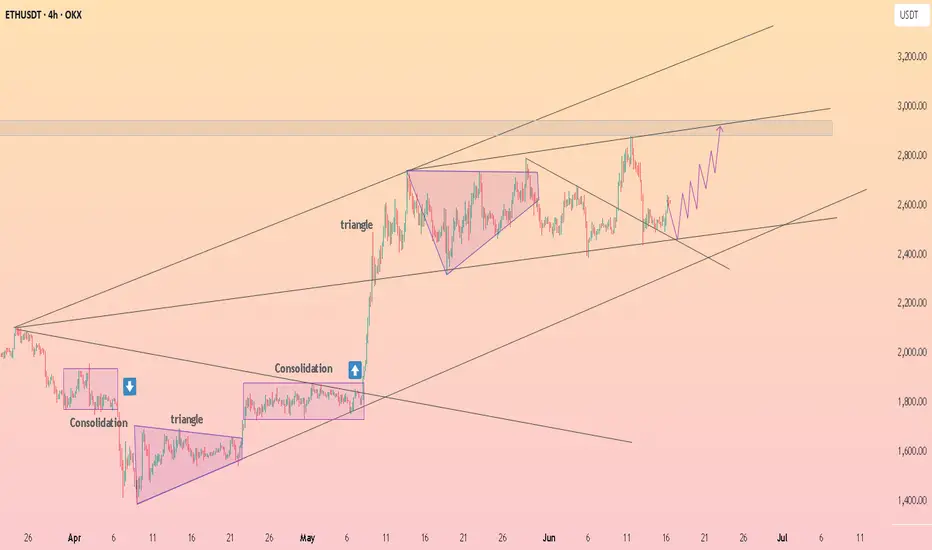
HolderStat┆ETHUSD continues to accumulateOKX:ETHUSDT is catching bids at the 2.50 k rail after triangle retest, converting shakeout into upside continuation. Staying above 2.40 k keeps bias north; clearing 2.75 k releases the 3 k target rocket 🚀
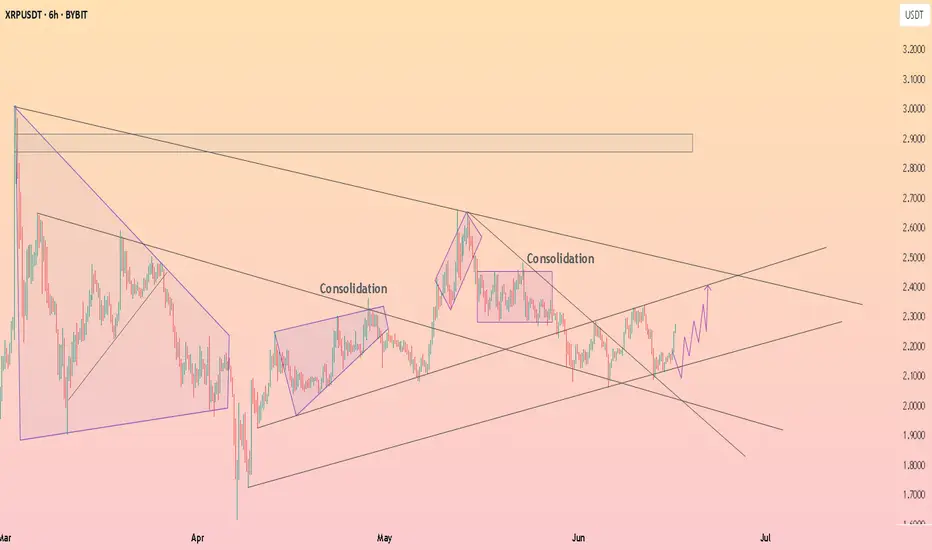
HolderStat┆XRPUSD reboundBYBIT:XRPUSDT is carving higher lows off 2.03 support through a wedge break, morphing base into bullish momentum. Holding the rising line sustains upside tilt; clearing 2.35 unlocks 2.55 and breakout buzz 🌊