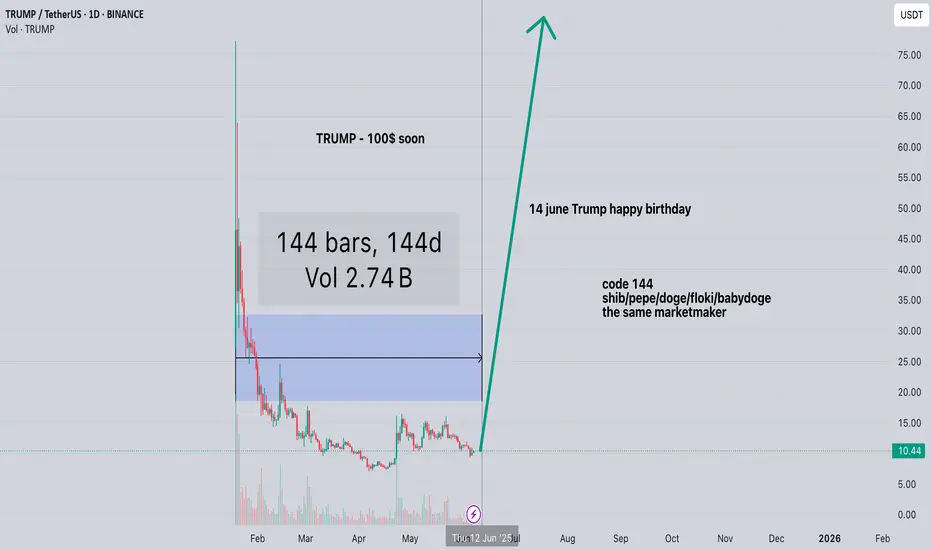
TRUMP to $100? Code 144 and Trump's Birthday I want to share my unique hypothesis, which no one has discussed before. I noticed an interesting pattern: on the 144th day after listing, a pump began for meme tokens like SHIB, PEPE, DOGE, FLOKI, and BABYDOGE.
I call this "Code 144" — and I believe the same scenario could repeat with the TRUMP token, especially considering June 14th is Donald Trump's birthday. This is the perfect media opportunity to trigger a FOMO wave, especially if it coincides with this critical 144th day.
📌 What’s important:
The same pump pattern on these coins' charts (possibly controlled by the same market maker);
TRUMP is currently in an accumulation phase;
The US election hype could amplify the effect;
I expect a pump near June 14th, as part of the "Code 144."
The target for TRUMP, based on this scenario, is $100 as a short-term spike due to the hype.
⛔ This is not financial advice, but my personal idea based on observing past cycles of meme tokens. I’m sharing it to document the hypothesis and check it against time.
Altseason
ATOM | Sleeping GIANT Altcoin Gem 1️⃣ATOM is probably one of my favorite altcoins at the moment.
If you look at ATOM from a macro timeframe such as the weekly, it seems like there is barely any hope and that it's just been one big liquidity run.
And although ATOM has retraced nearly 92% since it's ATH, we see a much brighter picture when we look at the daily, or 3D timeframe.
______________________
BINANCE:ATOMUSDT

ETH Technical Structure: Bullish Bias Unless This Level BreaksEthereum is at an interesting spot.
After forming a clear bullish structure with Higher Highs (HH) and Higher Lows (HL), ETH entered an accumulation zone right below the key resistance zone.
Currently, price is retesting the 50 EMA + 100 EMA confluence zone — a critical area of demand. This level has previously acted as a strong support, and the Stoch RSI is bouncing from oversold territory, signalling possible bullish momentum ahead.
If ETH holds this accumulation zone and the EMA support, we could see another push toward the key resistance zone or even a breakout. However, if this zone fails, a deeper pullback toward lower support levels is likely.
For now, watch how price reacts here — this is a decision point.
If you liked it, do comment and follow us for regular market updates.
THANK YOU

3️⃣ Altseason and the US "Crypto-Reserve"3️⃣ Altseason and the US "Crypto-Reserve"
❗️ Disclaimer: This idea is only a part of an article with a forecast for Bitcoin and the cryptocurrency market for 2025-2028. To fully and completely understand what is being discussed here, please refer to the root idea via the link:
1️⃣ Main Idea: Analysis of US Treasury Documents
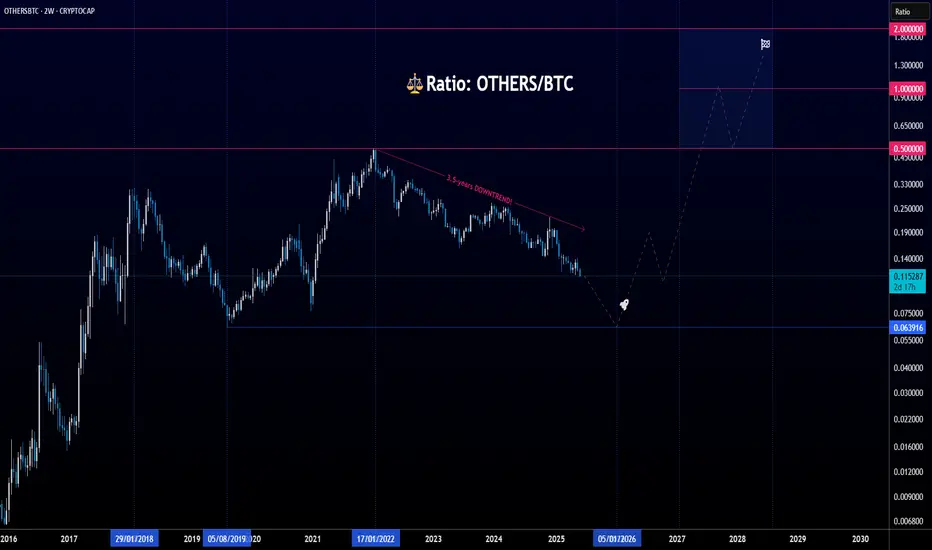
TradingView recently added an interesting new ticker: $CRYPTOCAP:OTHERSBTC. It represents the ratio of the total market capitalization of the top-125 cryptocurrencies, excluding the top-10 by capitalization (OTHERS), to the market capitalization of Bitcoin (BTC).
What does it measure?
OTHERS (Total capitalization of other altcoins): This is the aggregated market capitalization of cryptocurrencies that are not in the top-10 by capitalization. In other words, it's a metric that allows tracking the dynamics of "small" and "medium" altcoins, excluding the influence of the largest players (such as Bitcoin, Ethereum, and other large altcoins in the top-10).
BTC (Bitcoin Market Capitalization): This is a standard metric showing the total value of all circulating Bitcoins.
Thus, OTHERSBTC shows how "small" and "medium" altcoins generally relate to Bitcoin in terms of market capitalization. Why is this needed? This ticker is an important indicator for assessing the "altcoin season" and the overall sentiment in the cryptocurrency market:
⬆️ Growth in OTHERSBTC: Means that the market capitalization of "other" altcoins is growing faster than Bitcoin's market capitalization (or falling slower). This often indicates the beginning or continuation of an "altcoin season," when investors start shifting funds from Bitcoin to riskier but potentially more profitable altcoins. This can be a sign that the market is becoming more risk-on.
⬇️ Decline in OTHERSBTC: Indicates that Bitcoin is growing faster (or falling slower) than "other" altcoins. This may suggest that investors prefer safer assets, or that Bitcoin's dominance is strengthening. This often happens during market corrections or when investors seek refuge in Bitcoin.
📈 Analysis of the main chart: OTHERSBTC
The fact that the OTHERSBTC index has been in a downtrend since the beginning of 2022, I think, is not difficult to understand:
A decline in OTHERSBTC directly means that the "altcoin season" has not fully arrived or has been absent since the beginning of 2022.
For a full-fledged "altseason," OTHERSBTC should show sustained growth, meaning that "small" and "medium" altcoins are outperforming Bitcoin in terms of capitalization growth. This is not happening yet.
Current market state: The decline in OTHERSBTC since 2022 confirms that the market has been in a bear phase, and after that – in a recovery phase where Bitcoin leads, and altcoins (especially those not in the top-10) are recovering slower or not at all.
Thus, the decline in OTHERSBTC since the beginning of 2022 is a direct reflection of the bear market, decreased risk appetite, and increased Bitcoin dominance during a sideways period for the rest of the crypto market. For a potential "altseason," we will need to observe a change in this trend, when CRYPTOCAP:OTHERSBTC begins to show sustained growth.
✴️ The Concept of a US "Crypto-Reserve": Not Exclusion, but Absorption
In the face of an impending economic storm and the inevitable "cleansing" of the crypto market, it becomes clear that the US government does not intend to completely destroy digital assets. Instead, a multi-step strategy is being developed for their integration and subordination under its control. This involves not just a set of rules, but the formation of a full-fledged "National Crypto-Reserve."
This concept is not new. The history of finance shows that "private currencies" that do not meet reliability requirements always lead to instability and ultimately are either absorbed or replaced by regulated government equivalents. (As TBAC notes, "history shows that 'private money' that does not meet the requirements of NQA leads to financial instability and, as such, is highly undesirable" – DA&TM, p. 3). When Bitcoin collapses under the pressure of a global economic crisis and massive liquidations in 2025, and "high-beta" altcoins bleed out, the US government and its affiliated institutions will begin to buy them up at a discount. The goal is not to destroy digital assets, but to accumulate them in this "National Crypto-Reserve" .
And here lies another, deeper meaning: this process is not just about buying assets; it's about testing and mastering new technologies on "live hamsters," meaning the current participants of the crypto market. This entire "Wild West" of decentralized finance, DeFi, NFTs, and rapidly changing altcoins serves as a giant laboratory. It is here, under real market conditions and the pressure of huge capital, that the system studies how blockchains, smart contracts, consensus mechanisms work, how quickly "digital" infections spread, and how effectively to manage liquidity in decentralized environments. All these experiments are, in essence, paid for by the crypto- hamsters -enthusiasts themselves, while the state and the global establishment receive invaluable data for building their future digital economy.
This "soup-kit" of digital assets for the US Crypto-Reserve will include, first and foremost, Bitcoin as the primary "digital gold" – an asset that TBAC itself already calls a "store of value." This will allow the government not only to control a significant portion of Bitcoin but also to use it in future "tokenized" financial products. In addition to BTC, the reserve will include carefully selected altcoins under US jurisdiction or of strategic importance for the new, controlled digital landscape. Theoretically, these could be assets that have clear issuers or are centralized enough for easy "absorption" and regulation. This list may include: ETH, XRP, SOL, HBAR, XCH, LINK, UNI, DOGE, OP, AVAX, MATIC, AAVE, LDO, BAT, NEAR, SUI, ALGO, ADA, and others that may be deemed "best of the best" in their understanding.
Thus, the "crypto-reserve" will become the foundation for a new digital financial system , where control and stability will first be ensured by the "nationalization" of key digital assets. This will allow the state not only to manage significant volumes of digital funds but also to use them for future "tokenized" financial products that will be issued on "private, permissioned blockchains managed by central banks" (see DA&TM pp. 7 and 14). This is how "wild" crypto will be tamed and integrated into the traditional system, losing its decentralized essence but gaining "legitimacy" under state supervision.
📈 Analysis of the chart: OTHERS
In this capitalization index, the value of the top-10 coins was removed from the top-125. It is also quite informative and convincing, showing that the capitalization is -50% below its 2021 highs.
I will also add a few altcoin charts here, namely: DOT, NEAR, ETH. For all charts, a further decline of another -70% from current levels is expected, approximately by early 2026.
📈 ETH Chart. Forecast 2025-2028
📈 NEAR Chart. Forecast 2025-2028
📈 DOT Chart. Forecast 2025-2028
📊 General chart description
Ethereum and NEAR behave very similarly, only CRYPTO:NEARUSD is more volatile and does not hold up as well as ETH. INDEX:ETHUSD today is -47% below its ATH, while NEAR is -88%. Nevertheless, they are at least roughly in the middle of the trading range since 2021, whereas CRYPTO:DOTUSD look much weaker than the top coins, and have been languishing at the bottom for about two years.
Moreover, after a thorough analysis of current prices and historical highs of 2021-2022 for coins from the top-100 that existed during that period, very few of them are trading today above or near their 2021-2022 peaks. List of coins from the top-100 that existed in 2021-2022 and whose current price has updated the ATH of that period:
XRP (Ripple): Its current price of $2.2 exceeds its 2021 ATH (~$1.96).
UNUS SED LEO (LEO): Price $8.65 exceeds its 2022 ATH (~$8.14 in Feb. 2022).
TRON (TRX): Price $0.266 exceeds its 2021 ATH (~$0.18).
BNB (Binance Coin): Price $660 is very close to its 2021 ATH (~$690).
SOL (Solana): Because the list is so small, I had to partially count Solana, as it indeed updated its 2021 high at $260, but today trades at -45% lower, around $160.
Thus, if we strictly adhere to the criterion of "trading above 2021-2022 highs," then out of the top-100 that existed during that period, it's only five, again, FIVE alts! The bottom line is that Bitcoin, two native exchange tokens (BNB, LEO), the "Ethereum killer" TRON, the Trojan horse XRP, and let's include SOL, have updated their 2021-2022 ATHs and are trading above or near their historical highs out of ALL TOP-100 coins. Only some alts from the top-100 are somewhere in the middle of the three-year trading range, and the rest have been looking for the bottom for two years.
While influencers have been talking about some altcoin season for the third year, ATOM today is -90% below its 2022 ATH! And NEAR is -88%, DOT is -92%, and CHIA is -99% from its ATH, and this list can go on and on. That's all you need to know about the so-called "alt season" and "bull market" in crypto over the last three years.
❗️ Disclaimer: This idea is only a part of an article with a forecast for Bitcoin and the cryptocurrency market for 2025-2028. To learn more, refer to the root idea via the link:
1️⃣ Main Idea: Analysis of US Treasury Documents
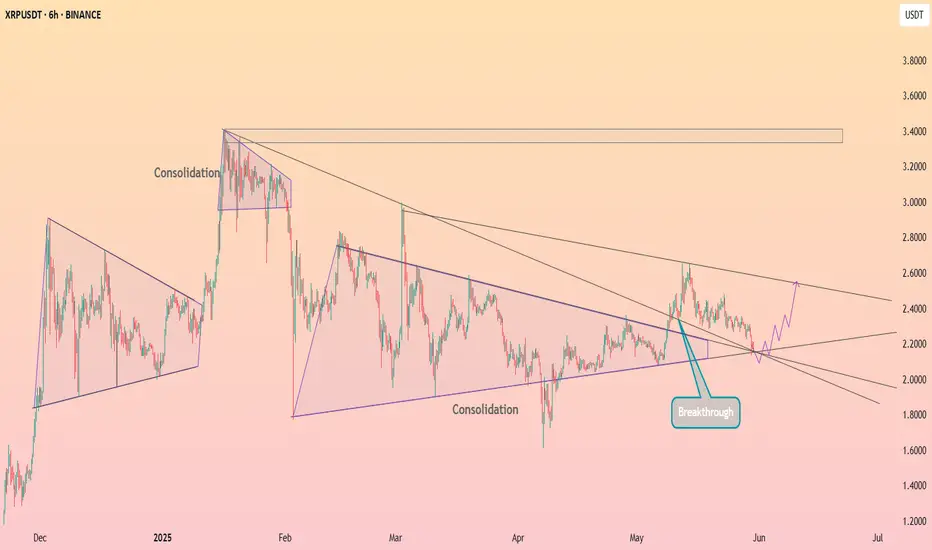
HolderStat┆XRPUSD triangle coil to 2.38CRYPTOCAP:XRP snaps its descending trendline after a neat 4-h triangle + box consolidation combo, reclaiming 2.15 pivot and pointing to the 2.38 supply—trendline break, bullish continuation pattern, resistance retest and clear upside target.

HolderStat┆SOLUSD rebound from supportCRYPTOCAP:SOL revisits the 150 pivot inside a corrective wedge, yet April’s growing channel stays intact. Confluence of horizontal demand, wedge resistance and prior consolidation tips a comeback toward 175, then the 185 ceiling, as long as trendline cradle support endures.

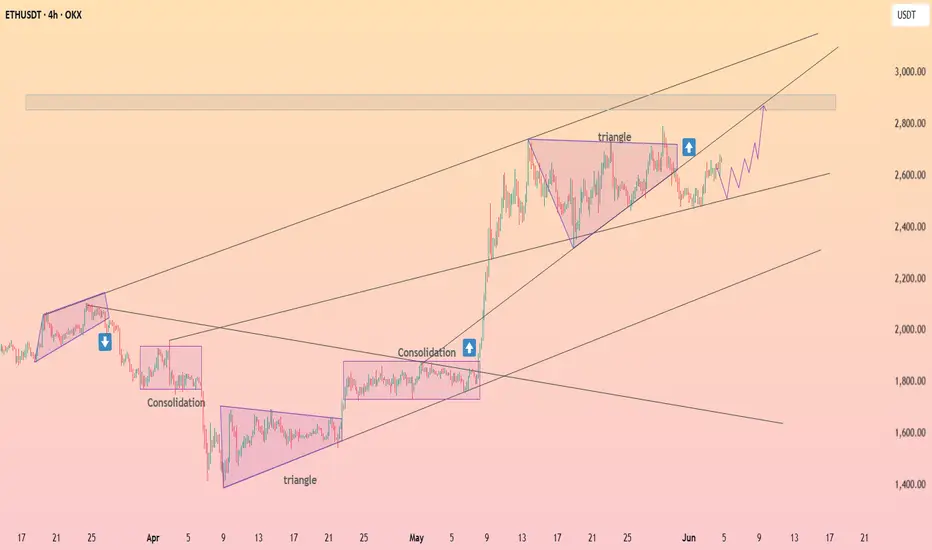
HolderStat┆ETHUSD channel climbCRYPTOCAP:ETH cruises within a steep four-hour rising channel; the latest triangle breakout paused near 2.6 k. Converging trendlines, former consolidation support and higher-low structure all aim for the 2.9 k liquidity zone. Bulls steer while the channel median holds.
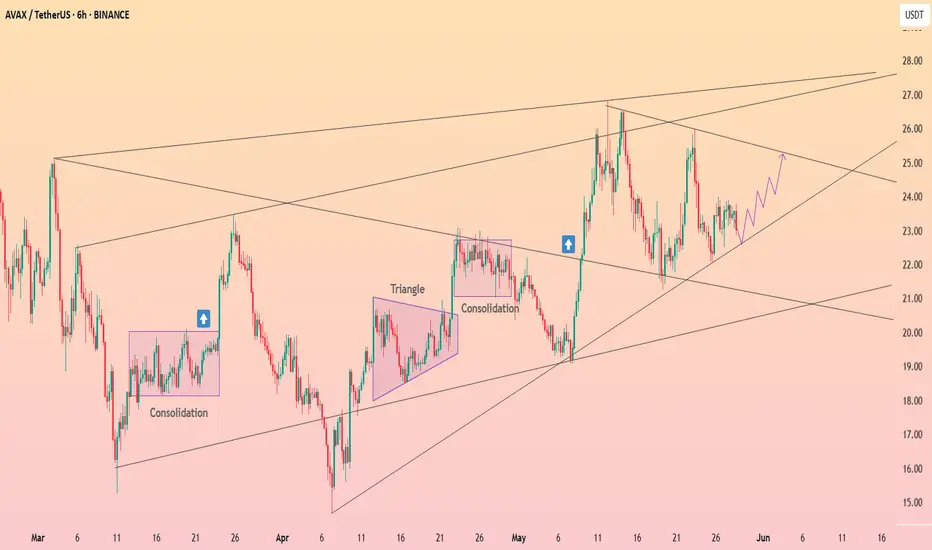
HolderStat┆AVAXUSDCRYPTOCAP:AVAX price analysis: After triangle breakout and twin consolidation phases, Avalanche respects a rising wedge, pinging support near 23.00 as buyers eye the overhead trend-line at 25.00. Momentum hints at a bullish crypto forecast into resistance.
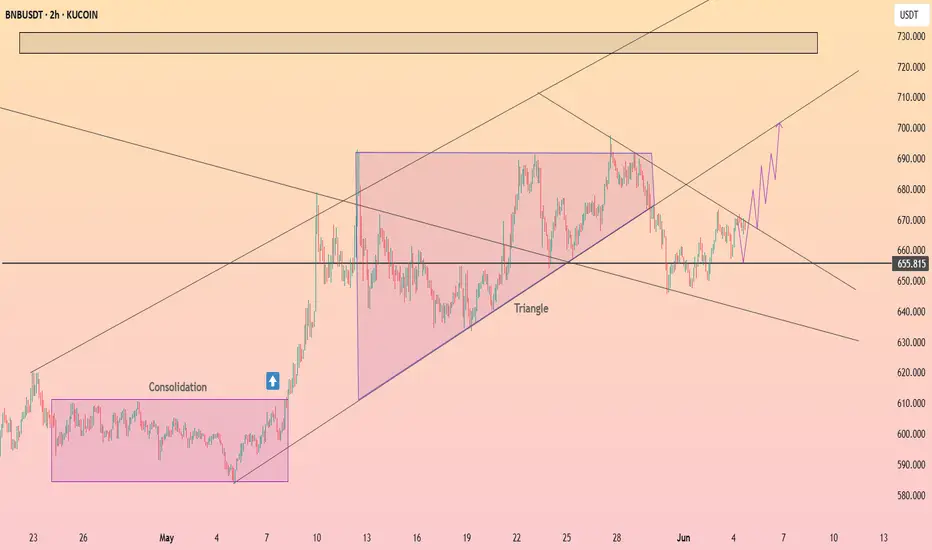
HolderStat┆BNBUSD coil at 655CRYPTOCAP:BNB compresses in a tight two-hour symmetrical triangle atop the 655 floor. Multiple consolidation shelves plus an intact rising trendline load energy for a burst toward the 700 – 730 supply band. Horizontal support dominance keeps the new-high narrative alive.
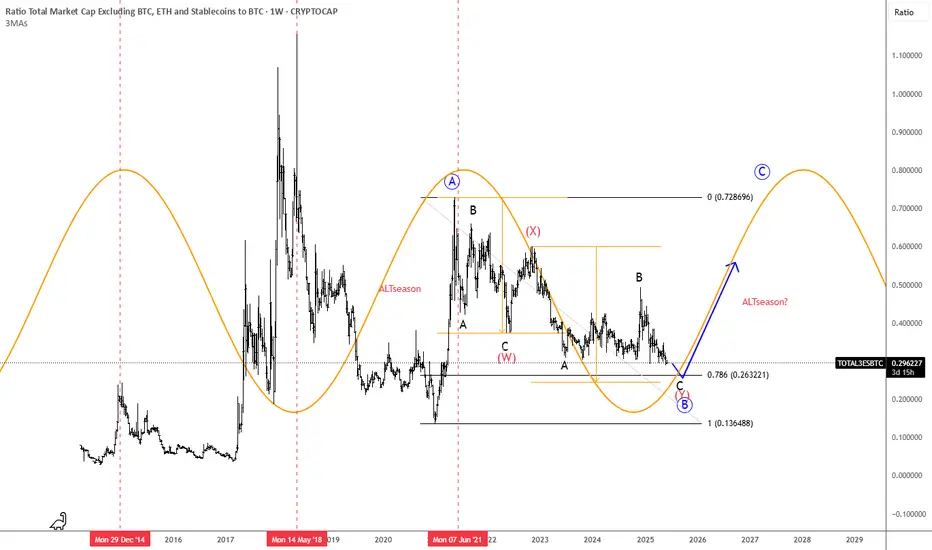
ALTseason May Show Up In 2025We found an interesting chart, which is showing us the ratio of TOTAL3(ALTcoins) market cap against Bitcoin with ticker TOTAL3ESBTC. Well, even this chart is showing that ALTcoins may start outperforming BTC soon. It can be finishing final subwave C of (Y) of a correction in blue wave B that can cause a new strong rally into wave C, which can bring the ALTseason similar as in the beginning 2021.
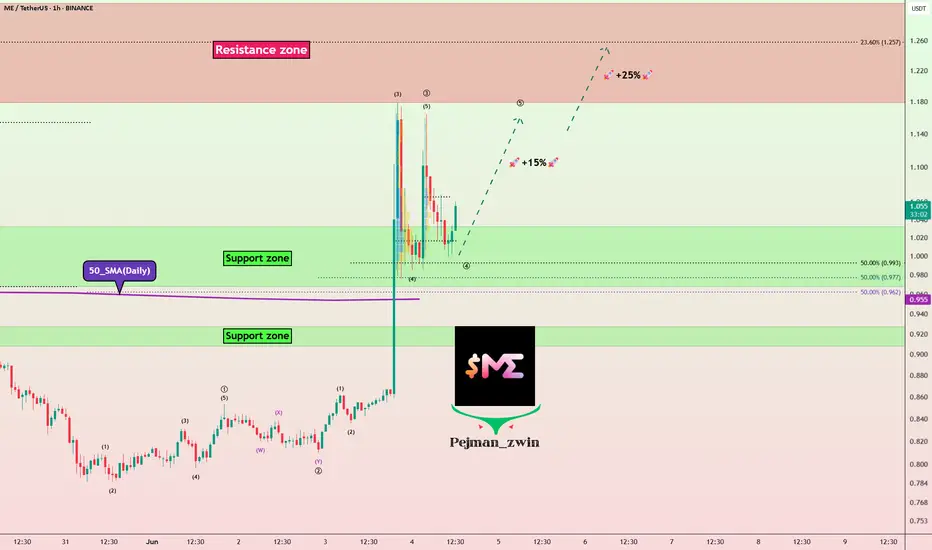
Magic Eden’s ME Token Eyes Bounce After Trump Wallet VolatilityOn June 3, , Magic Eden ( BINANCE:MEUSDT ) announced a collaboration with a project called to launch a new" Trump Wallet "
This announcement triggered a + 35% price increase , pushing the price of ME Token to approximately $1.17 .
However, shortly afterward, members of the Trump family, including Donald Trump Jr. , denied any involvement with the wallet or the project.
This resulted in a -20% price drop due to shaken investor confidence .
-----------------------------
Let’s see how ME Token is doing on the 1-hour timeframe .
ME Token is trading in the Support zone($1.03-$0.96) near the 50_SMA(Daily) .
From the Elliott Wave theory perspective, ME Token seems to have completed the main wave 3 and is currently completing the main wave 4 .
I expect ME Token to rise to at least $1.146(+15%) .
Second Target: $1.237
Note: Stop Loss = $0.95
Please respect each other's ideas and express them politely if you agree or disagree.
Magic Eden Analyze (MEUSDT), 1-hour time frame.
Be sure to follow the updated ideas.
Do not forget to put a Stop loss for your positions (For every position you want to open).
Please follow your strategy and updates; this is just my Idea, and I will gladly see your ideas in this post.
Please do not forget the ✅' like '✅ button 🙏😊 & Share it with your friends; thanks, and Trade safe.
Ethereum has reached its bottomKey support trendline should offer spring towards the next bullish wave.

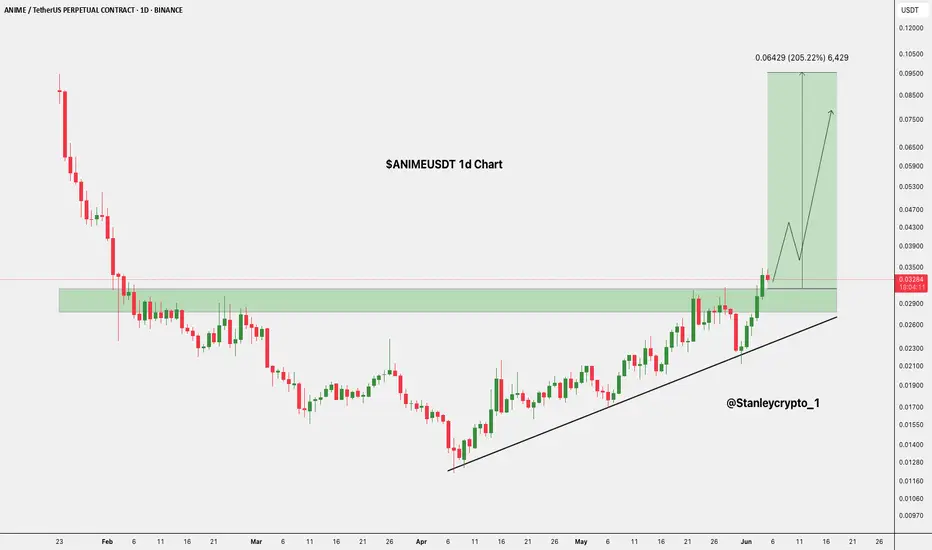
$ANIME Brreakout Ahead?- BINANCE:ANIMEUSDT is breaking out of a key resistance zone after weeks of higher lows.
- If this breakout holds, a move of 200% or more toward $0.09505 could be next.
- Watch for a retest. This could be the start of something big. 👀
DYRO, NFA
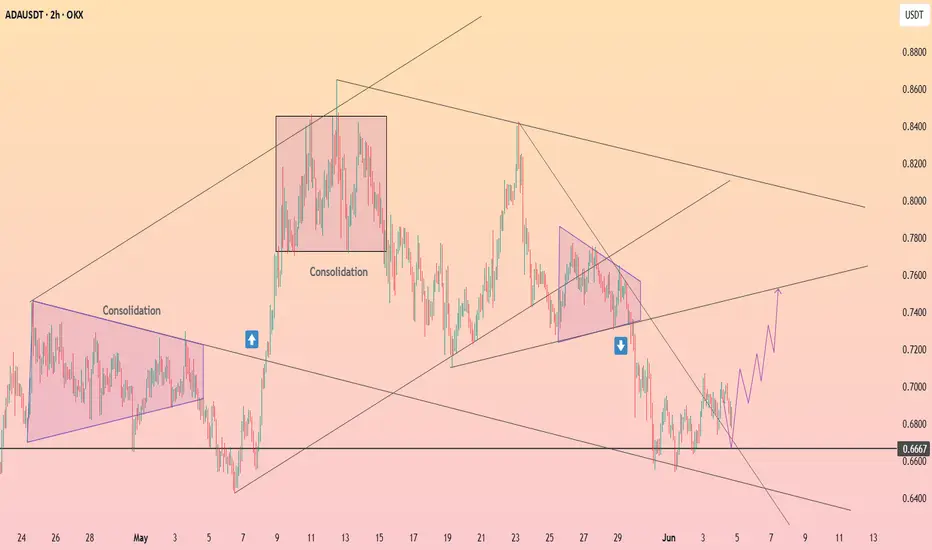
HolderStat┆ADAUSD triangle breakCRYPTOCAP:ADA rebounds off the 0.666 base, slicing through a two-hour down-trend line. Stacked consolidation boxes now act as demand, and an emerging ascending channel eyes 0.75 – 0.76, maybe 0.80. Key support flip, improving momentum and bullish breakout pattern align for higher highs.
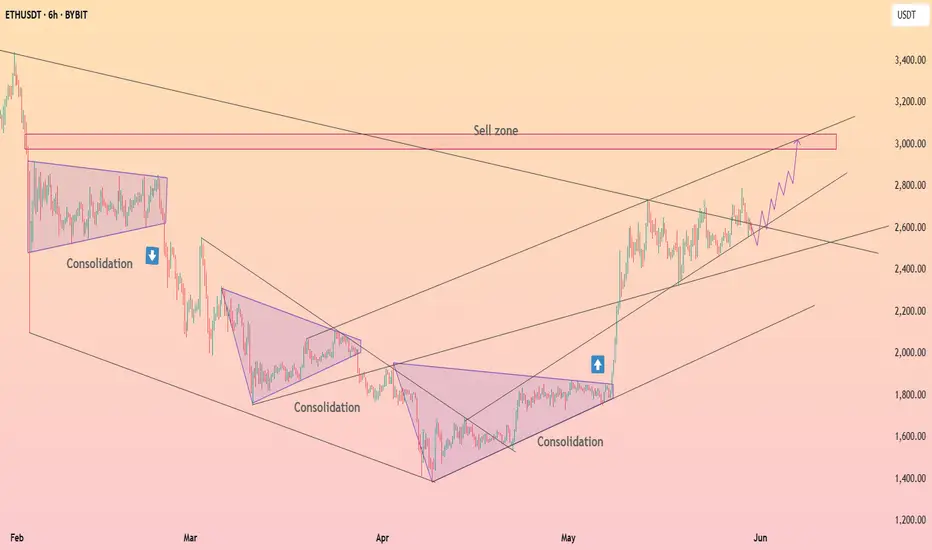
HolderStat┆ETHUSD road to the sell zoneCRYPTOCAP:ETH price ascends inside a neat channel after a trio of consolidations. The chart’s marked sell zone near 3 100 USDT aligns with upper resistance, yet current higher-low structure, breakout arrows and supportive trendline suggest bulls intend to test that ceiling soon.
HolderStat┆SOLUSD channel surferCRYPTOCAP:SOL exited a falling channel, built a clean growing channel and parked on 165 USDT support. Repetitive consolidation mid-way and a projected path to the 190 USDT level underscore continuing strength, with trendline confluence favoring upside continuation.

HolderStat┆XRPUSD rebound renaissanceCRYPTOCAP:XRP bounced off a long falling wedge, logged a labeled “rebound”, and now glides within a widening channel. Multiple consolidation pauses plus higher lows keep momentum positive; watch the 740 USDT overhead zone as resistance where breakout traders may aim next.
HolderStat┆ADAUSD coiled for new highsCRYPTOCAP:ADA has printed boxy consolidations, respected its rising base and survived a sharp pullback; price now rests on ascending support. With prior “new highs” still warm and trendline resistance nearby, the setup flags a rebound toward 0.78 amid persistent bullish price action.

Bitcoin Dominance, BTC ATH and ALT Seasons since 2017-some facts
There is little doubt now, that this Crypto cycle is very different from previous cycles and the main reason for this is the Bitcoin Dominance ( BTC.D) of the Market.
The reasons for this Dominance is complicated but we can certainly point towards the arrival of ETF's as one of the principle factors.
Corporations simply Buy Bitcoin, Hold it and Trade the ETF's - The Key Principle here being that the Coins are HELD Long term.
As we can see from the main chart, we have a key point in the BTC cycle called the Bitcoin Halving. To many extents, the explanation of this is not relevant right now.
But what you can see is how, previously, after the BTC Halving, we saw a drop in BTC.D,
This was due to the money Flow out of BTC and into ALT coins.
As more ALT coins were bought up, the demand drove the price higher and so their dominance increased, driving BTC.D down
This has not happened this cycle due to bulk buying of BTC for ETF's and BTC being Held Long term.
We can also see how , as we approached a certain time span After the Halving, we saw a sharp rise in BTC.D as we headed towards the next BTC ATH as the BTC buying picked up.
Again, this is not happening this cycle as the Bitcoins are being held long term.
What we can also see on the main chart is how we would normally be approaching a period of expected BTC ATH ( green vertical box )
And the HUGE question is, Will we get a Bitcoin ATH in this period ?
This is, to many extents, impossible to answer but as demand for Bitcoin continues and coins become harder to find, the price should continue to rise.
The tricky bit is, now, with a Bitcoin costing over 100K usd, it becomes harder to move the price. Only Corporations can afford to bulk buy.
So, again, things are different.. Retail is struggling to find a foot hold in the Bitcoin market, seeming to think that a Bitcoin is too expensive for them.....forgetting that they can buy a bit and that will also increase in price by the same %.
And so they look to the ALTs, fast volatile price rises and high returns,
This is seen very clearly in this chart that shows us when we had previous ALT seasons after the Halving
See how, after a period of time after Halving, the ALT Seasons appeared when the BTC.D dropped.
And that has simply just NOT happened this time.
It has to be said, it did try to appear. ALT season tried to happen.
See how after 210 days after halving this cycle, BTC.D did drop sharply but, it found a line of support and bounced back, Killing the ALT season dead in its tracks
There have been a lot of attempts since but the Market has been Bloody for ALTS, with sharp rise and Falls destroying confidence..... And Bitcoin continues to Rise.
So, where are we now ?
This Daily BTC.D chart may offer some ideas
BTC.D PA is currently at TOP of long Term range and finding it hard to get over that line of resistance.
BTC.D Weekly MACD , while not overbought, is curling over Bearish
BTC ATH's have previously been attained from Oversold areas as MACD Rose back higher.
The Volatility has gone and MACD is ranging smooth
SO, in conclusion, it is anybodies Guess right now if we will ever see an ALT season again.
Technically, on many fronts, we are poised, ready for it, even if it is a mini one.
But as we have seen on many occasions this cycle, Bitcoin is a very desired asset now and Demand drives price.....and so the Sell off that we need to drive an Alt season just may not occur.
One thing that is Absolutely certain though, we are highly likely to see another Bitcoin ATH
Stay safe everyone and Love one another. It is Free to do and is worth more than anything

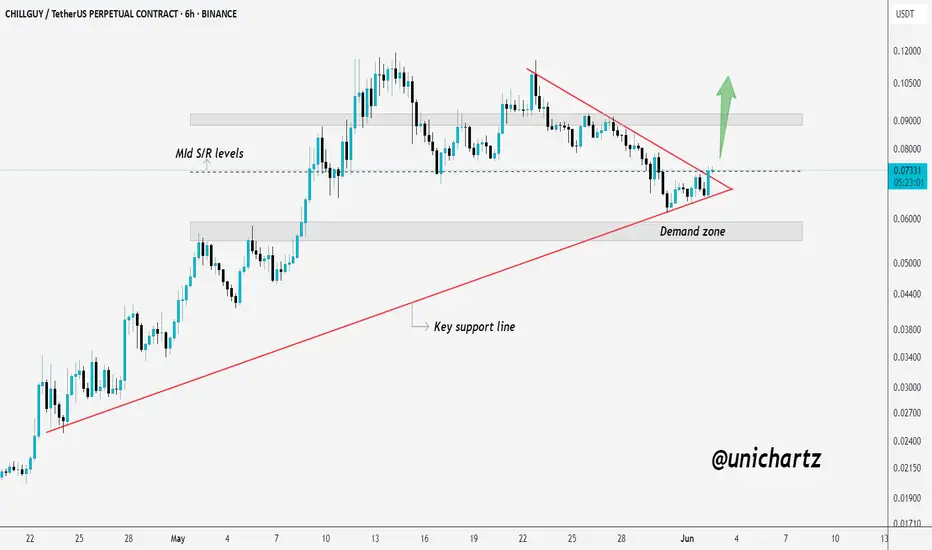
CHILLGUY Tight Range Play – Patience Could PayCHILLGUY/USDT Analysis – 6H Chart
CHILLGUY is currently consolidating above a strong demand zone and key support line. Price is squeezing into a tight range, showing signs of buildup after the recent uptrend.
As long as the support holds, a bounce toward the mid S/R levels looks likely. A strong breakout from this zone could fuel the next leg higher.
But if price loses the demand zone, it may trigger a deeper correction.
Stay alert — a decisive move is nearing.
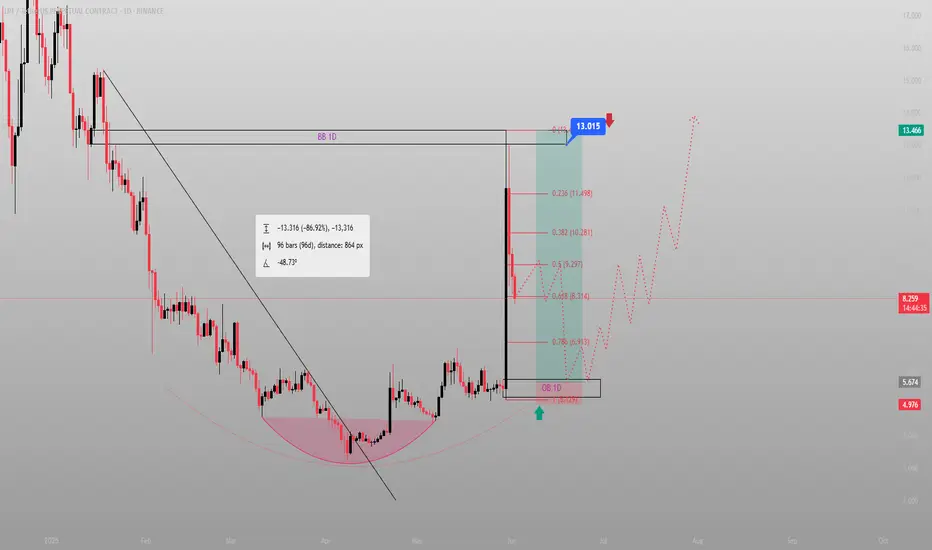
LPT reversed a 3-month bleed — and I caught the reset candle.This isn’t noise. This is reversal.
LPT just completed a 96-bar, -86% bleed. But price didn’t just stop randomly — it formed a rounded base and exploded straight into a 1D breaker block, clearing internal structure and printing a clean power candle.
Now? Price is retracing.
We’re back into the 1D OB at 8.31 — aligning perfectly with the 0.618 fib retracement of the entire move. This is where price pauses, not reverses. And if Smart Money is still in control, this is where the next leg builds.
Targets are layered:
9.29 (0.5) is the first inefficiency reclaim.
10.28 (0.382) is the emotional level that marks continuation.
13.01 is the liquidity pocket — and the full draw.
This isn’t about whether price “goes up.” It’s about how price delivers.
Execution structure:
🟩 Entry: 8.31–6.91 (discount into 1D OB)
🎯 Target 1: 9.29
🎯 Target 2: 10.28
🎯 Final: 13.01
❌ Invalidation: sustained close below 6.12 (break of intent)
Everyone sees the candle.
Few understand the reclaim behind it.
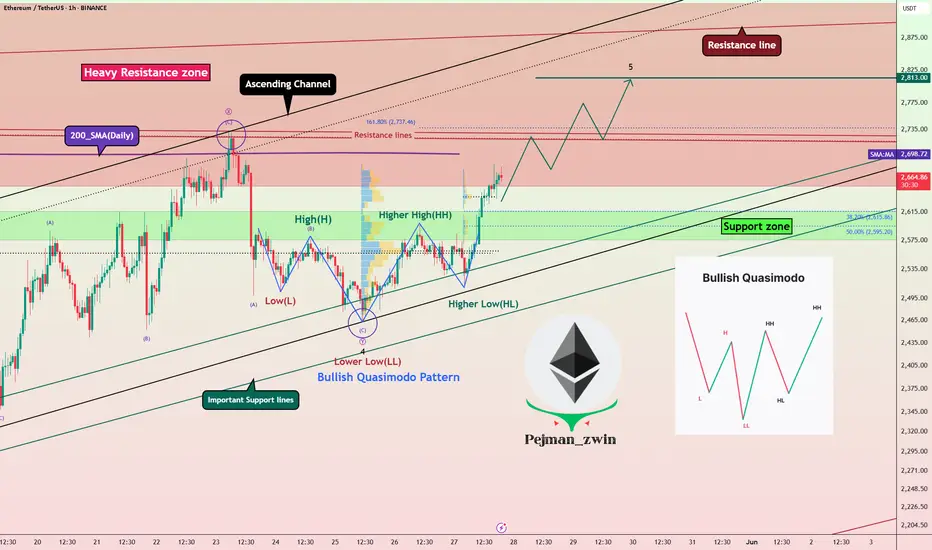
Quasimodo Pattern + Validator Support = Bullish Signal for ETHToday I want to analyze Ethereum ( BINANCE:ETHUSDT ) for you, many tokens are on the Ethereum network , and the increase or decrease of Ethereum directly affects most tokens.
So please stay with me.
Ethereum is trading in a Heavy Resistance zone($2,929_$2,652) near the Resistance lines and 200_SMA(Daily) . It is worth noting that Ethereum is preparing itself for a third attack on 200_SMA(Daily).
In terms of Price Action Analysis , Ethereum could start to rise with the help of the Bullish Quasimodo Pattern and break out of 200_SMA(Daily) and Resistance lines .
In terms of Elliott Wave theory , Ethereum appears to have completed a main wave 4 near Important Support lines . The structure of the main wave 4 is a Double Three Correction(WXY) . By breaking the 200_SMA(Daily) and Resistance lines , we can confirm the end of the main wave 4 .
The ETHBTC ( BINANCE:ETHBTC ) chart conditions are bullish , so it seems like investing in Ethereum could be better than Bitcoin . At least if the market falls , Ethereum is likely to be less likely to suffer a decline .
Note : Over 150,000 Ethereum validators, representing approximately 15% of the network, signaled support for increasing the gas limit from 36 million to 60 million units. This proposed change aims to enhance network capacity, reduce transaction fees, and improve scalability. While this development could positively impact ETH's price by making the network more efficient, it's essential to monitor potential technical risks and ensure that decentralization is maintained.
Note: If Ethereum touches $2,547 , we can expect further declines.
Please respect each other's ideas and express them politely if you agree or disagree.
Ethereum Analyze (ETHUSDT), 1-hour time frame.
Be sure to follow the updated ideas.
Do not forget to put a Stop loss for your positions (For every position you want to open).
Please follow your strategy and updates; this is just my Idea, and I will gladly see your ideas in this post.
Please do not forget the ✅' like '✅ button 🙏😊 & Share it with your friends; thanks, and Trade safe.
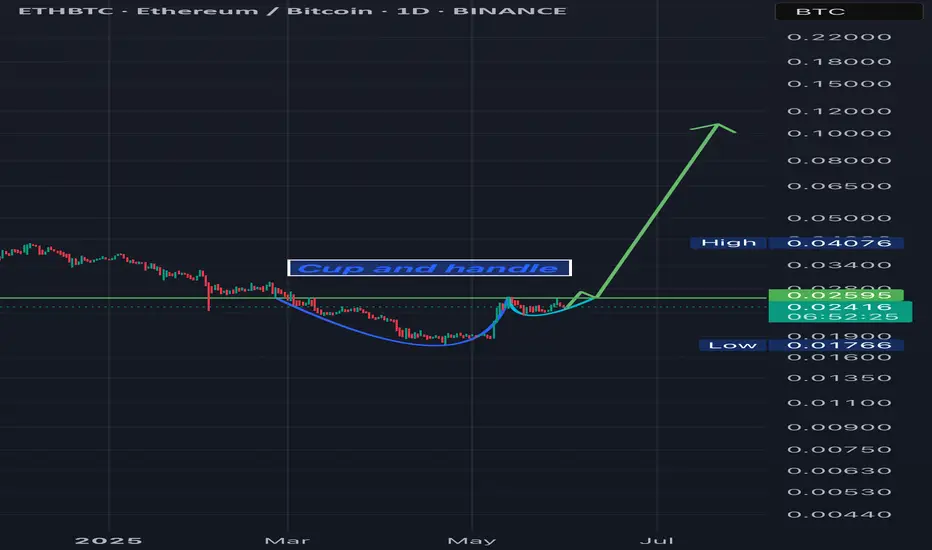
Altseason started Bullish from this chart cup and handle. Consider to see this breakout.
This ill be the start of Altseason, Bitcoin will pump .. others will follow.. 250X incoming & 15 Trillion MCAP