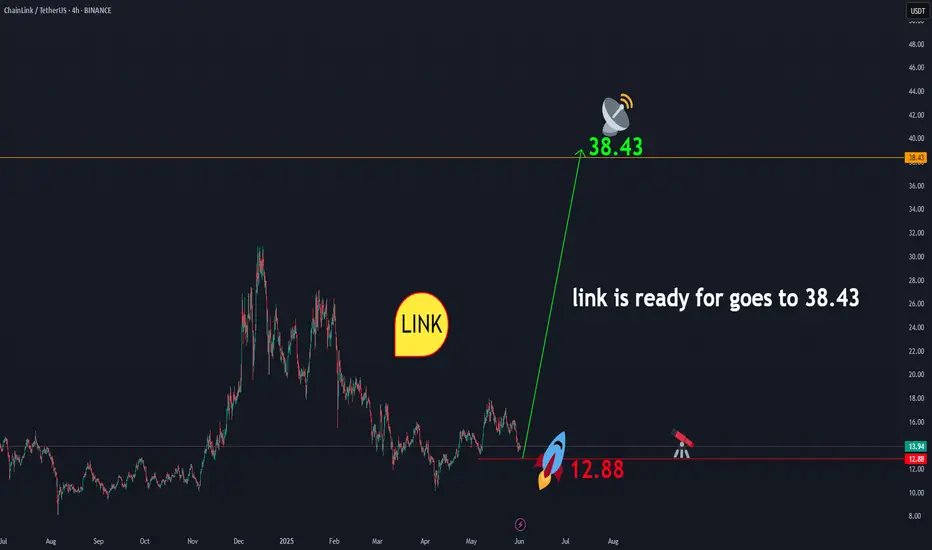
linkusdtLINK is showing readiness to initiate an upward movement towards $38.43. From the current price range of $13.93, a correction down to the $12 area is possible. This zone presents a favorable opportunity for long-term investment . In any case, according to the geometry that has formed in LINK, the price level of $38.43 is expected to be achieved. And this is certain.
BINANCE:LINKUSDT
Altseason
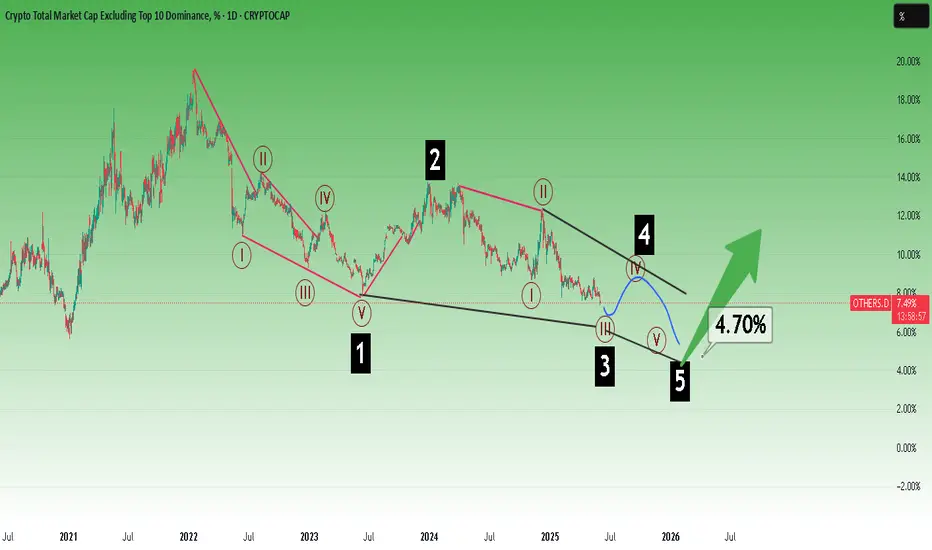
OTHERS ROADMAPTo me the view is pretty clear.
* The purpose of my graphic drawings is purely educational.
* What i write here is not an investment advice. Please do your own research before investing in any asset.
* Never take my personal opinions as investment advice, you may lose your money.
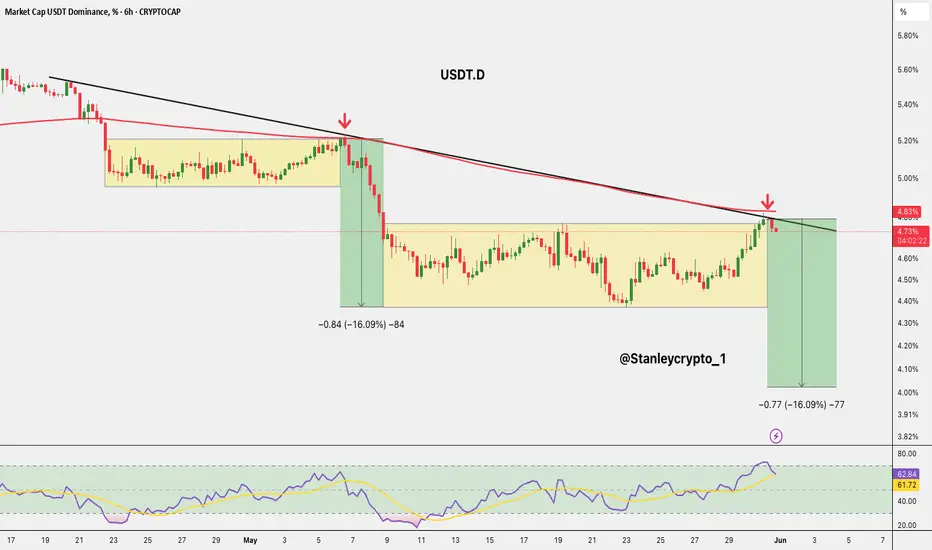
$USDT.D Rejeccted Again Altseason SignalCRYPTOCAP:USDT.D Rejected Again Altseason Signal
USDT Dominance is showing a clear rejection from the descending trendline and 200 MA, similar to the previous 16% drop.
The RSI is turning down from the overbought zone, signalling potential downside.
If this move plays out, we could see USDT.D fall toward the 4.0% zone, which is bullish for Altcoins.
DYRO, NFA
Bozo Benk – Road to Top 300
Bozo is a low-float, high-conviction breakout that’s showing all the early signs of a full-blown cycle runner. Right now, it’s flying under the radar — but that won’t last long.
coingecko: BozoBenk
Key Metrics:
Current Market Cap: $4.72M
Target Market Cap (Top 300 Range): ~$200M
Total Supply: 800M
Circulating Supply: ~400M (50% of tokens are locked)
If we hit a $200M market cap on just 400M circulating tokens, that gives a projected price of:
$200,000,000 / 400,000,000 = $0.50 per token
That's a 100x from here — and yes, that’s within striking distance in meme coin terms when a proper run begins.
Why This Isn’t Just “What If” Talk:
Low Float = High Velocity
With only 400M tokens in circulation, price impact per dollar is massive. When buyers show up, price moves fast — and that speed becomes the magnet.
Breakout Is Confirmed
After months of accumulation, Bozo just cleared its resistance zone. Volume spike. Momentum flip. Classic early-stage markup.
Reflexivity Effect
As price rises, more eyes come in. CT starts posting. Telegrams start firing signals. The crowd sees the move, and FOMO becomes self-fueling. This is how 10x becomes 50x.
Realistic Target Based on Ecosystem
$200M is not a moonshot. There are dozens of meme coins with less utility and worse structure sitting at or above that level. If capital rotates back into memes — and it always does — Bozo is positioned to ride that wave hard.
The Alpha:
This isn’t about “maybe” — it’s a perfect mix of low cap, reduced float, clean chart, and momentum fuel.
A $200M market cap on 400M circulating tokens = $0.50.
You're here at ~$0.005.
That’s the kind of asymmetry you don’t get often — and when it runs, there won't be time to chase.
Know what you hold. Trade it like you mean it.

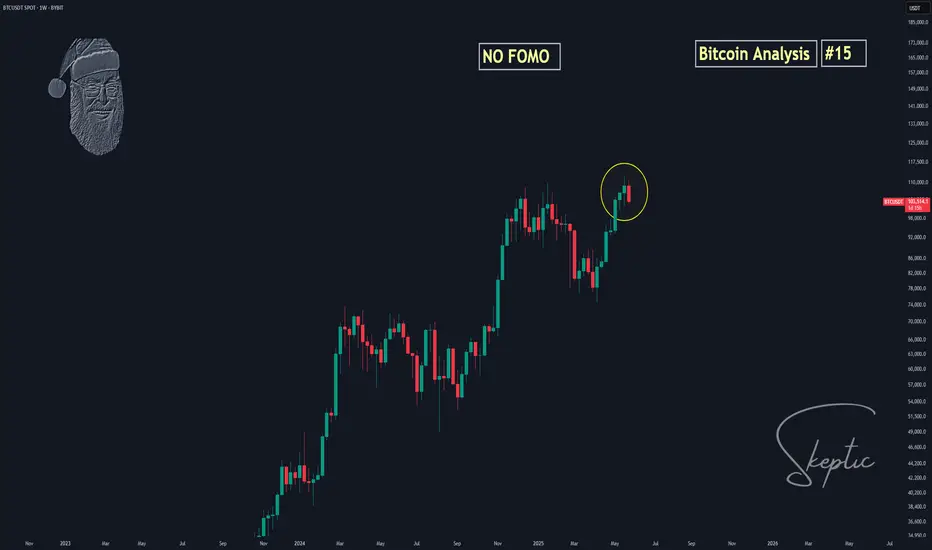
Skeptic | Bitcoin Weekly Recap #15 Bull Run On? Altcoin Next?Hey everyone, Skeptic here! Bitcoin’s been throwing curveballs this past week—did it leave you spinning? 😵 Still unsure if the bull run’s officially on, or hunting for the perfect altcoin entry? Don’t worry, in this recap, I’m laying it all out with clear reasoning to give you a crystal-clear view of the market and help you ditch those FOMO-driven decisions. Here at Skeptic Lab , we analyze Markets with one motto: No FOMO. No hype. Just reason. We’re not like others who panic over dumps or hype every pump—we’ve got risk management , stop losses , and we stay glued to the market’s pulse. Let’s dive into the Bitcoin Weekly Recap and unpack it all! 📊
Monthly Timeframe: The Big Picture
Let’s zoom out to the last three months. The 74,000 to 82,000 range has been a rock-solid support zone for Bitcoin, with heavy shadows every time we touch it. Big shadows like that scream potential trend reversal, and right now, Bitcoin’s major trend is firmly uptrend. Until we see a clear signal for a trend change, all that noise about Bitcoin crashing to 50K or “the bull run’s over” is pure nonsense. If you hear anyone making those bold future price predictions, run the other way! Our job isn’t to predict the future—it’s to map out scenarios and have a plan when they play out. Comparing the 2022 bear market to now is flat-out silly. Why? Back then, we’d already seen massive gains, but now, we haven’t had significant growth yet—altcoins are quiet, and total market volume hasn’t spiked. The end of a trend isn’t when everyone’s scared of losses; it’s when everyone’s dreaming of becoming a millionaire and the news is pumping FOMO. 😄 So, ignore those baseless analyses and let’s get to the real stuff.
Weekly Timeframe: Momentum Check
On the weekly chart, we kicked off a solid uptrend momentum, even hitting a new all-time high. Bears tried to jump in and sell, but here’s the catch: the previous ceiling hasn’t been technically broken yet, so we haven’t gotten a clear buy signal. Why? Because support and resistance levels aren’t static—they shift over time. The longer time passes, the higher or lower these levels move, and they need updating. Right now, we got rejected after testing the ceiling because our true resistance is still intact. So, when do we get confirmation? Let’s drop to the Daily Timeframe for clarity.
Daily Timeframe: Spot Trigger
After breaking 112,000 , we’ll get the main confirmation that the last ceiling before the correction is broken, signaling the continuation of the major uptrend per Dow Theory. That’s our spot buy trigger—buy above 112,000 with a stop loss below 100,000 , giving you a 10% stop loss size. Please, manage your capital so that if you hit the stop loss, you lose no more than 3% of your total capital. Staying alive in financial markets hinges on risk management. Now, let’s hit the 4-Hour Timeframe for long and short triggers.
4-Hour Timeframe: Long & Short Setups
We had a solid upward trendline on the 4-hour chart, but it broke to the downside. When this happens, two scenarios are possible: either the uptrend’s slope has just softened with no trend change, or we’re entering a correction. My take? We’re likely heading for a time-based correction (think range-bound boxes). If we start ranging, don’t beat yourself up or pile into trades impulsively—win rates for most traders tank in range phases, and losing streaks pile up. For long positions, I suggest waiting for a break above 108,900 . That’s where we got a strong rejection and pullback last time, so we need solid confirmation to go long since bearish momentum is stronger in this phase. For shorts, 105,000 was a good level, but the next short trigger is a break below support at 101,577 . If we see a strong reaction at any level on this timeframe before that, you could short on a break there too. For breakout confirmation, indicators like SMA or RSI work, but volume is king. High volume on a break means it’s likely to continue; low volume screams fake breakout, so cut your risk there.
Bitcoin Dominance (BTC.D): Altcoin Timing
Let’s wrap up with a quick look at BTC.D to figure out if it’s time to jump into altcoins. BTC.D shows Bitcoin’s share of the total crypto market cap—the higher it is, the more liquidity flows into Bitcoin, often from altcoin sales. On the daily chart, we’re still above an upward trendline I mentioned in previous analyses, and altcoins haven’t made any real moves. When I say “moves,” I mean serious 100-500% or even 10,000% rallies , not just 10-20% pops. An altseason would be confirmed by a break of this trendline and a drop below support at 60.27. That’s when we’d expect massive altcoin gains, but it only works if Bitcoin’s already in a strong uptrend with solid market liquidity. Otherwise, don’t expect crazy altcoin pumps. The total market cap needs to be growing too for this to happen.
💬 Let’s Talk!
If this recap sparked some ideas, give it a quick boost—it means a lot! 😊 Got a pair or setup you want me to tackle next? Drop it in the comments. Thanks for joining me at Skeptic Lab—let’s grow together with No FOMO. No hype. Just reason. Keep trading smart! <3✌️
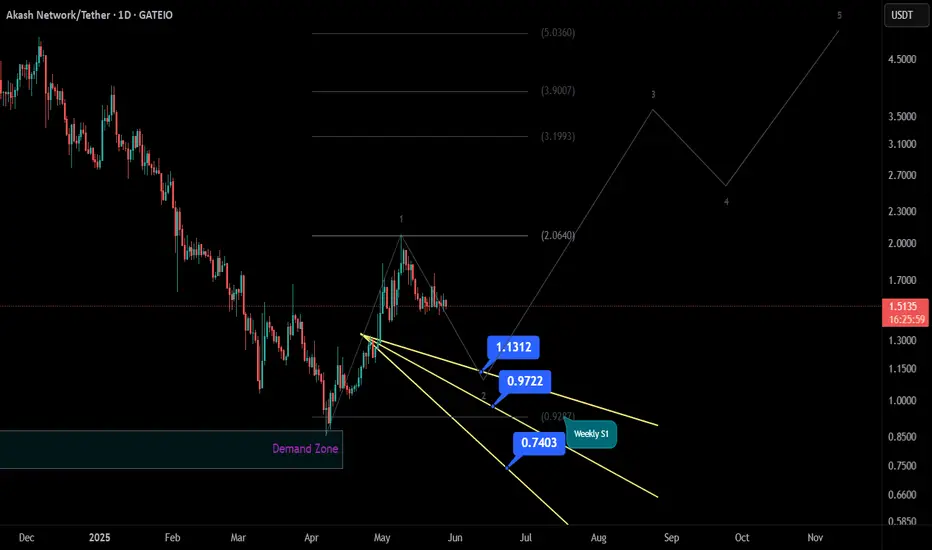
AKT/USDT Analysis💥 CSEMA:AKT - Swing Long Plan After 30% Correction 💥
AKT faced heavy selling pressure around the weekly pivot at $2.0640 , leading to a significant correction of nearly **30%**. The big question now: **Is it time to open a swing long?**
Here’s my take👇
Although we’ve already seen a 30% drop, that doesn’t mean the downside is over . For a high-conviction swing long, patience is key. I’m watching **three key levels** to build a position safely — no FOMO here.
🔹 Long Area 1 : $1.1291 (25% allocation)
🔹 Long Area 2 : $0.9722 (35% allocation)
🔹 Long Area 3 : $0.8234 (40% allocation)
💡 This is my ultimate swing long setup . Scaling in at these levels provides a better risk-reward profile rather than chasing the bounce.
But what if price only taps **Long Area 1** and then reverses? That’s fine too. The priority is **capital preservation and strategic entries**, not catching every single move.
✅ Focus: Make more with less risk
❌ Avoid: Emotional entries and overexposure
📌 Not financial advice. Do your own research. Trade safe! 🧠💰
#AKT #SwingTrade #CryptoAnalysis #TradingStrategy #DYOR #Altcoins
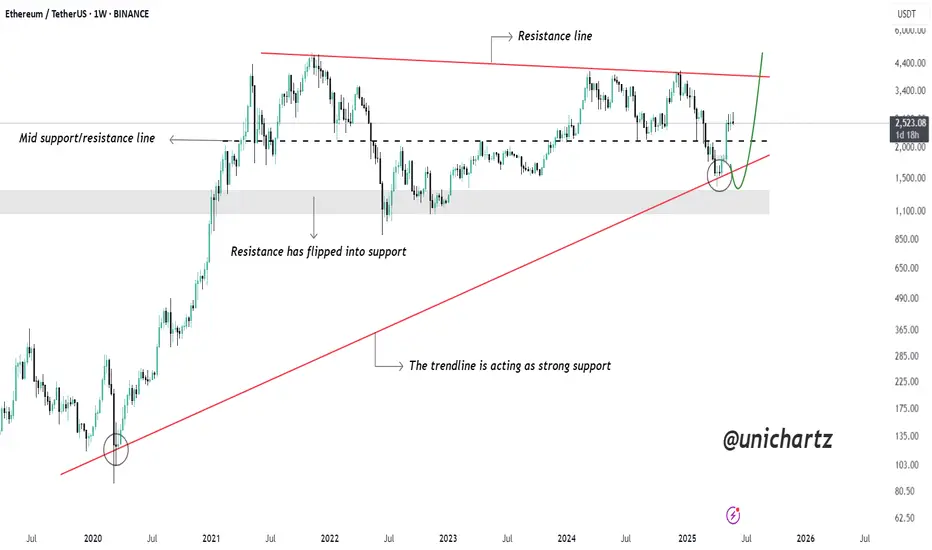
ETH Holding Long-Term Support – Road to $4K Open?CRYPTOCAP:ETH has successfully bounced from a long-term rising trendline that has acted as strong support since 2020. This trendline has historically triggered major bullish moves, and it’s doing its job once again.
Notably, ETH has also reclaimed the mid support/resistance level, which had previously acted as a key flip zone in past market cycles.
With both the trendline and horizontal support holding, the structure looks bullish. If momentum continues, ETH could head toward the upper resistance line, potentially targeting $4,000+ in the coming months.
The trend remains intact — this bounce could mark the start of a major leg up.
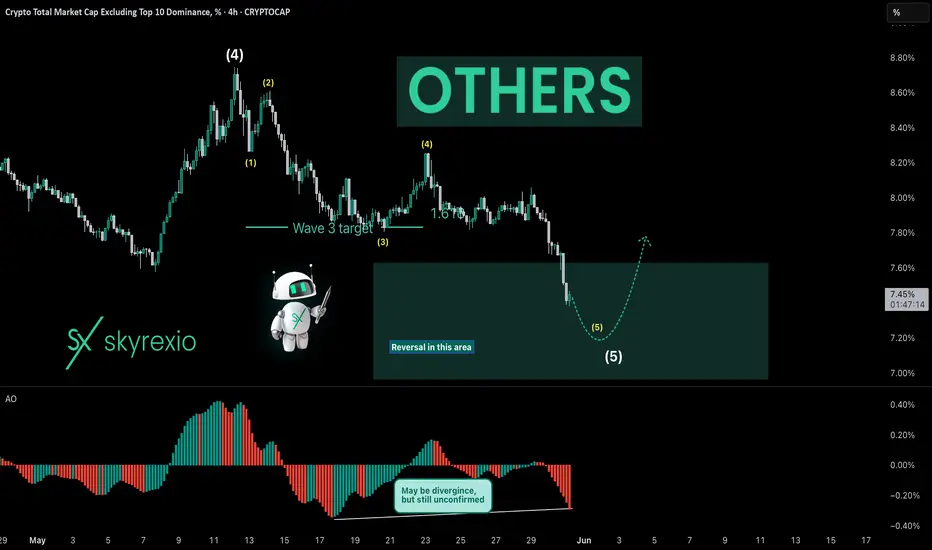
Actions Nightmare Is About To Be FinishedHello, Skyrexians!
Recently I shared this article about CRYPTOCAP:OTHERS.D where I pointed out that this chart is about to print another one lower low. Now it's happening, but this is wave 5 and now it's time to look for the altcoins bear market bottom.
Here we have 4h time frame and the internal structure of the final wave 5. Our main reversal signal can be divergence on Awesome Oscillator, and now it can happen if this drop will be decelerated. Price is inside the large green box - reversal zone. If we will see 3 rising columns on the histogram it's going to be the reveal signal with the yellow Elliott waves structure. This structure can be changed if price continues going down now without pullbacks. In this case I will recalculate waves and may be it will reach 7%. Also it shall match with BTC dominance which also has some space to go up. It shall at least retest the high at 65.5% (potential shortened wave 5).
Best regards,
Ivan Skyrexio
___________________________________________________________
Please, boost this article and subscribe our page if you like analysis!
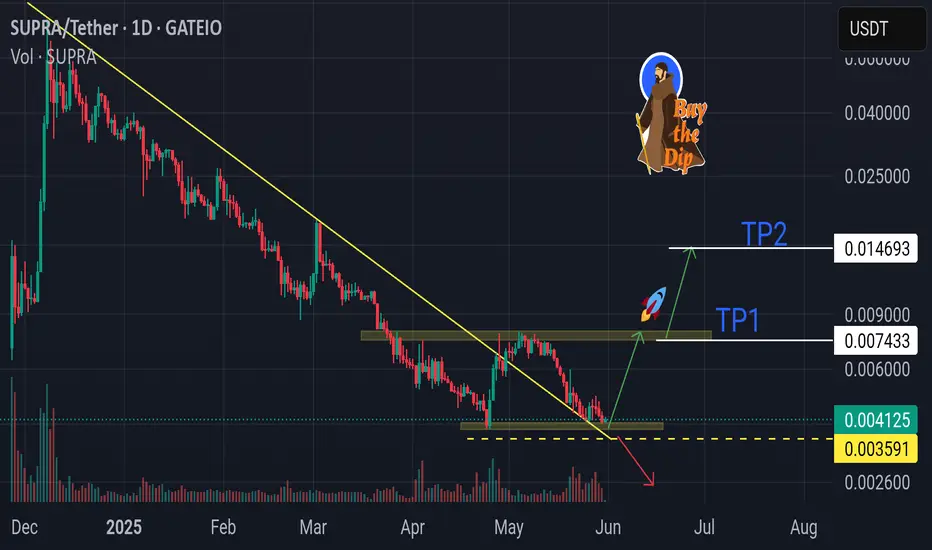
SUPRA !! Big double bottom setupSupra has potential for double bottom. invalid level if it falls below 0.003591.
DYOR!NFA!
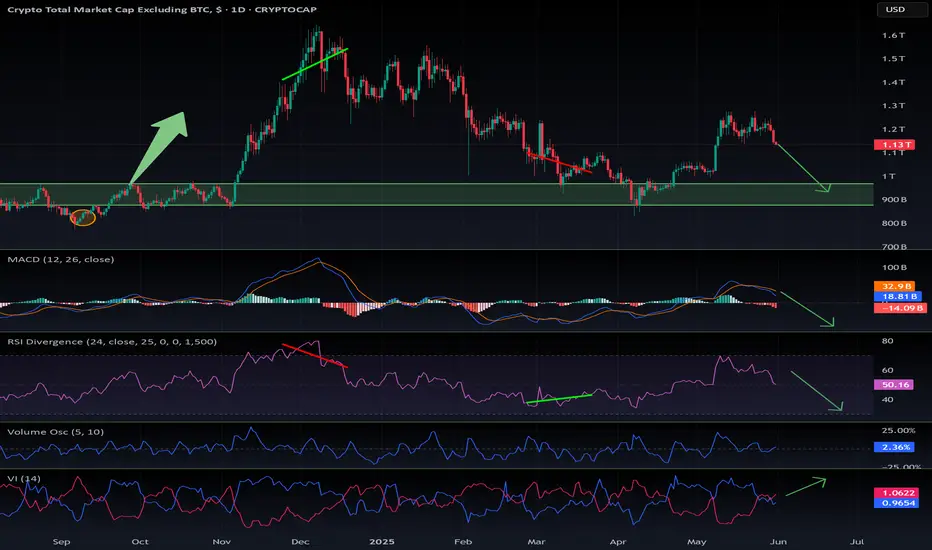
Altseason is cancelled for now. But Should resume soon.If you're interested in altcoins, be sure to check out my ideas. I’m closely tracking CRYPTOCAP:BTC.D and CRYPTOCAP:OTHERS , and you’ll find plenty of valuable insights in those analyses.
So, what’s going on? My CRYPTOCAP:OTHERS prediction played out — May was bullish. But was it the real altseason? Not quite. The true altseason typically begins at the end of the Bitcoin cycle, and we’re not there yet.
Right now, we’re seeing price action reminiscent of December 2024. Bitcoin maximalists are aggressively buying BTC during a time it should be correcting, which is inflating BTC dominance and crushing any momentum for an altseason. They appear to be using altcoins as exit liquidity to pump BTC, especially as retail investors hesitate to buy Bitcoin above $100K.
What’s next?
The daily MACD suggests we’re entering a correction phase that could last around two weeks. A drop toward $1.2T is likely, as there's a major order block between the current level and that target. However, the real support lies below $900B — my "green box" — which I view as the ideal buy zone.
Historically, entries in this green box have offered 2x–3x returns on high-volatility altcoins from the top 100, especially in sectors like memes, DeFi, and AI.
I expect altcoins to correct into that zone in the coming weeks — keep an eye on it.
DYOR (Do Your Own Research).
#Crypto #Altcoins #Bitcoin #BTC #BTCdominance #Altseason #CryptoMarket #CryptoTrading #MACD #TechnicalAnalysis #DeFi #MemeCoins #AIcoins #AltcoinSeason #DYOR
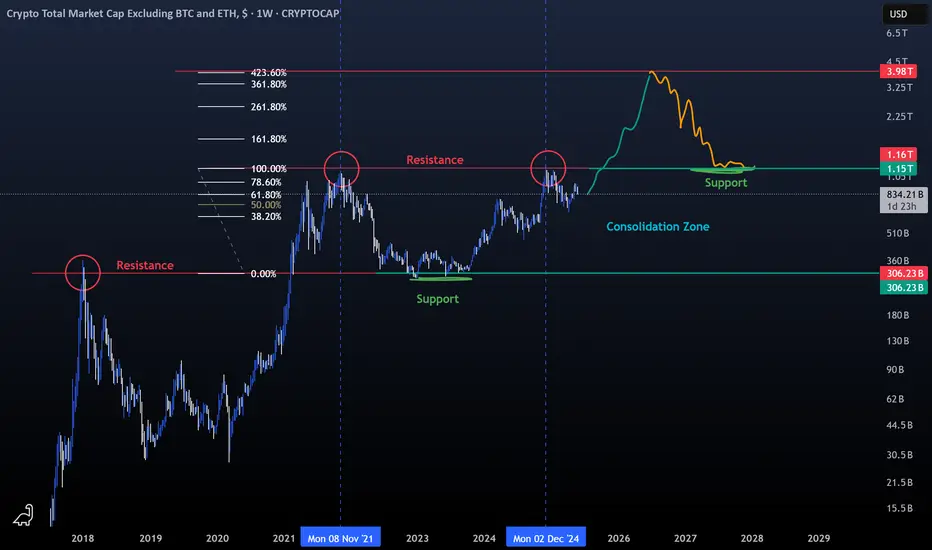
Altcoins The Moon AwaitsLike always, everything is clearly outlined on the charts :
- As a trader, it's crucial to follow logic and technical analysis. If you get caught up in the news and listen to everyone on Twitter, you won't last long.
- The first major altcoin rally was in 2018, pushing the market to $300 billion. This level later acted as a key support throughout the 2022–2023 bear market.
- The last all-time high for the crypto market (excluding Bitcoin and Ethereum) reached $1.15 trillion in 2021. ( blue doted vertical line )
- This all-time high was retested in December 2024, with this ATH acting as strong resistance. ( second blue doted vertical line )
- The next move could be a breakout above this resistance. According to Fibonacci projections, the altcoin market has the potential to reach $4 trillion.
While the spotlight remains on Bitcoin and ETFs, altcoins could catch up with a sudden and powerful surge, so make sure you’re not left behind.
Hodl!
Happy Tr4Ding !
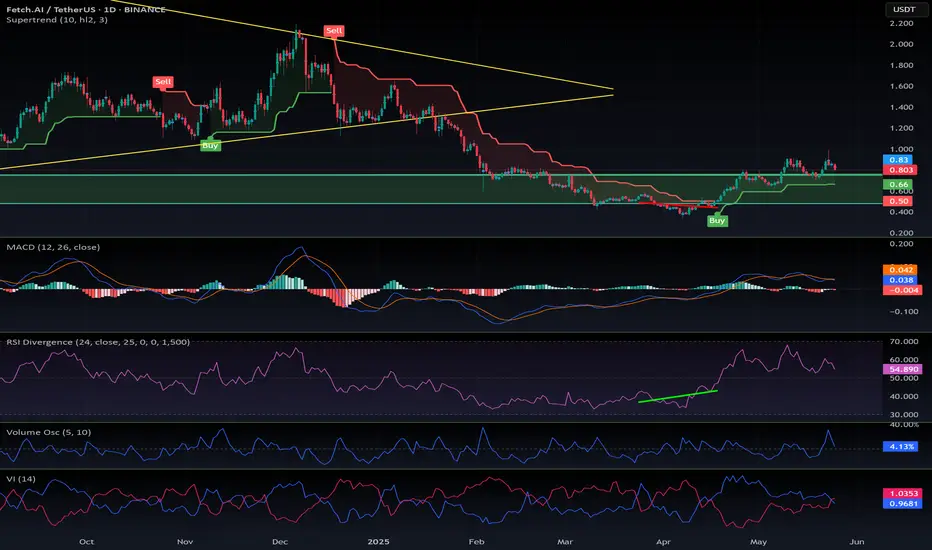
$FET is about to re-enter my buy green zone. Quick update on this coin:
The consolidation appears to have found its bottom, and the bullish divergence has played out as expected.
We’re currently seeing a slight cooldown on the daily timeframe, which is healthy after the recent move.
If NYSE:FET enters my green buy zone, it could offer a strong long entry opportunity.
As always, make sure to DYOR, especially during these uncertain times for altcoins.
#FET #CryptoUpdate #Altcoins #TechnicalAnalysis #BullishDivergence #CryptoTrading #BuyZone #CryptoMarket
$BTC.D Dominance forecast: update May 2025📉 BTC Dominance (%BTC.D) Update – At Resistance, Altseason in the Balance
Back on April 5th, I published a forecast highlighting the critical 65% resistance level on BTC Dominance. That analysis still holds: BTC.D reached 65% and got rejected, pulling back to 62% as of now.
⚔️ What’s Happening?
Bitcoin dominance is compressing, and we're approaching a make-or-break moment:
🔹 Resistance confirmed at 65%
🔹 We bounced down to 62% — not up
🔹 Market is hesitating, and the next move will shape the short-term direction for alts
🔍 The Bigger Picture
Bitcoin pumped hard recently, mostly due to:
MACD reversal on the weekly
Oversold conditions now turning bullish
Renewed institutional interest in risk-on assets
But let’s be clear:
🚫 We’re not in a full altseason yet.
What we’re seeing is cautious altcoin rotation, not a blow-off alt rally.
📊 Tech Indicators
MACD: Overheated
RSI: Still has room to move up
So technically, BTC.D could still break out above 65% — but it hasn’t yet.
⚠️ What to Watch:
If BTC.D breaks out above 65%, expect:
➡️ Altcoin bloodbath
➡️ BTC.D could head toward 70%, crushing the mini-altseason
But if BTC.D continues to drop from here?
➡️ Altseason starts to heat up
🔮 Outlook
A true altseason might not arrive until September/October. For now, the market is stuck in a range of uncertainty.
Keep your eyes on:
BTC.D reaction at 62%–65%
TradFi stress (bond markets, macro fears)
Bitcoin strength and ETH/BTC ratio
🧠 Take profits when you can. Protect your capital.
📌 Follow me for future updates—and don’t forget to DYOR.
📎 Original forecast:

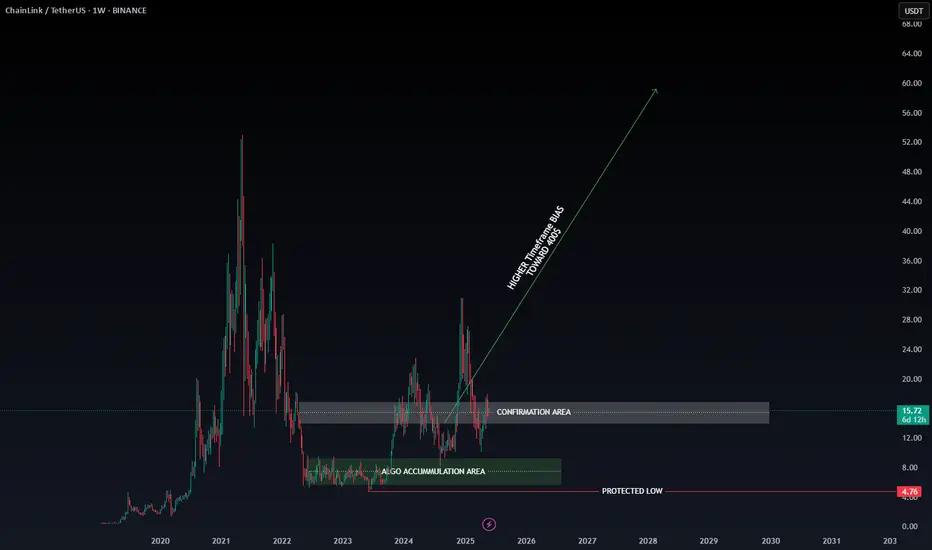
Winter Is Coming — And LINK Is Leading the Charge (x25) Chainlink acts as a bridge between blockchain and the real world.
This asset has been on our radar for years, silently building strength. Its fundamentals are rock-solid, and the current price action is highly favorable for a strategic buy.
📈 On November 12, 2023, LINK officially confirmed its journey to $400 by breaking through our algorithmic confirmation zone. Since then, it’s shown a modest price increase… and right now, it's retesting one of the best buy zones we've seen.
But here's the catch:
In the coming weeks, we expect explosive rallies — the kind that won’t allow for optimal entries anymore.
✅ We are currently positioned long on LINK, and it’s proving to be one of our strongest investments to date.
And remember:
The assets we publish on TradingView have already confirmed their trajectory toward our predicted targets.
🎬Not even Trump... not even a world war could stop what’s coming.
🚀 Buckle up... because winter is coming.
And LINK is ready to lead the storm.
🔍 Disclaimer: This is our personal analysis and not financial advice. Always do your own research before making any investment decisions.
💬 What’s your take on this? Drop your thoughts in the comments and feel free to share this with your friends! ❤️
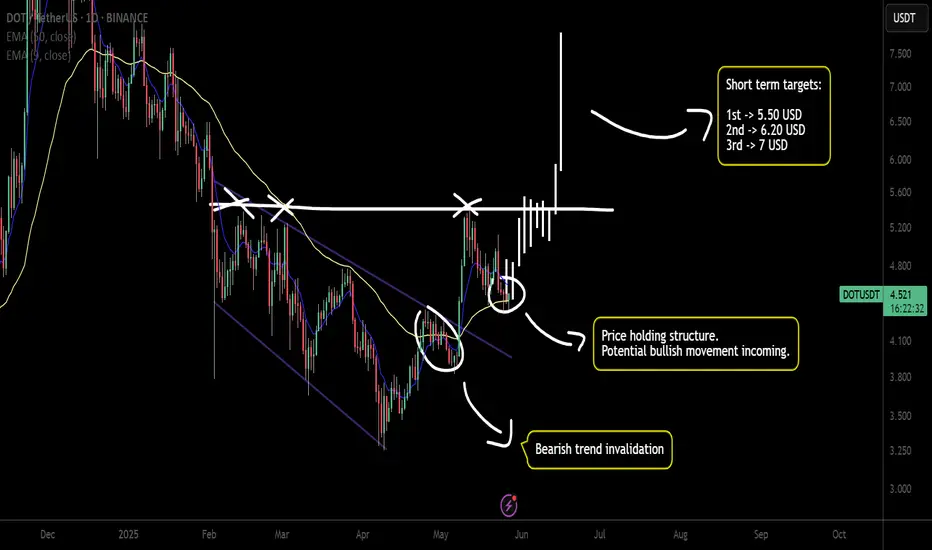
$DOT - Polkadot imminent bullish momentumHey traders!
Hope you are doing GREAT!
On this occasion I've decided to spot on CRYPTOCAP:DOT as its showing a clear bullish momentum ( as other alts). The chart is clear about the movement. There is no need to use fancy indicators neither a complex analysis.
Just price action.
As a brief comment, $Polkadot broke a clear bearish trend with confirmation on the daily timeframe. That's why I'm looking for a speculative trade (just in and out).
What I'm targeting? Prices between 6.00 USD and 7.00 USD in short term could be a nice zone to take profits.
Stay tuned!
ETH | New ATH on the cards | Fibonacci $7K TARGET Ethereum is gearing up towards the upside and we're seeing another resistance zone being crushed.
While BTC is trading sideways, we can expect ETH to play catch-up:
Don't miss yesterday's update on DOT:
_____________________________

HolderStat┆ADAUSD above the $0.72 levelCRYPTOCAP:ADA broke the falling channel, replaced by a higher-low structure; consolidation near 0.75 sits atop trendline support. Maintaining 0.65 keeps bulls in control for a push toward the 0.90 resistance band flagged above.

HolderStat┆BNBUSDCRYPTOCAP:BNB breakout watch: Binance Coin reclaims the 692 pivot, carving a triangle within an ascending channel and aiming at the 740 supply zone. Technical analysis notes firm trend-line support, bolstering a bullish continuation view for traders.

HolderStat┆XRPUSDCRYPTOCAP:XRP price pulse: Ripple leaps from consolidation and now coils just under 2.48 resistance inside a falling wedge. TA signals breakout toward the ceiling, mirroring earlier triangle bursts, while layered support keeps the bullish scenario in play.

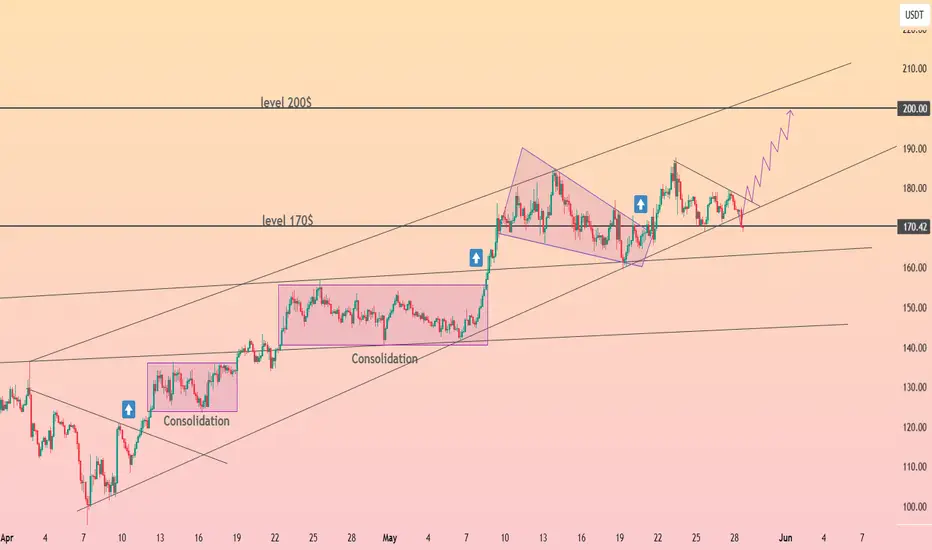
HolderStat┆SOLUSDCRYPTOCAP:SOL price radar: Solana escaped dual consolidations and now oscillates between 170 and 200 inside an ascending channel. Bulls defend trend-line support as a tightening wedge eyes 200. Chart structure and price analysis favor further upside momentum.
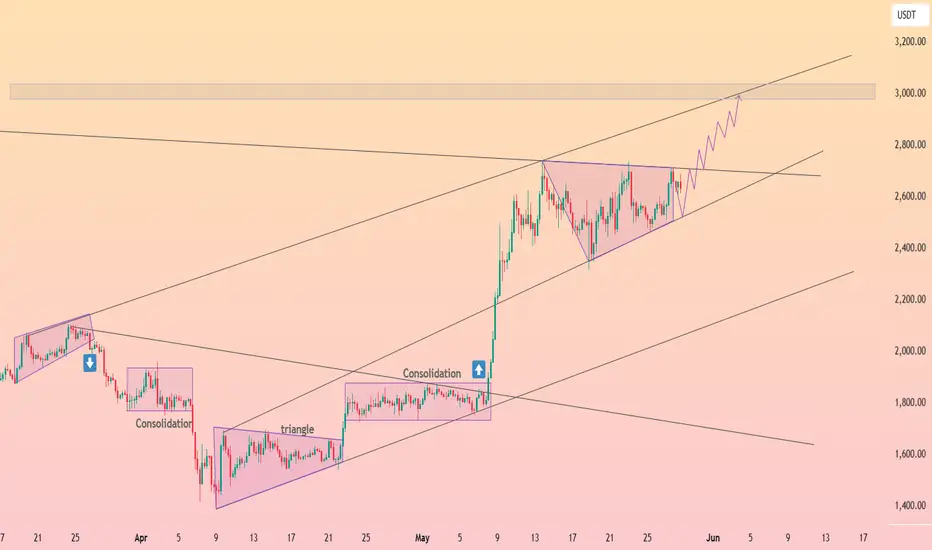
HolderStat┆ETHUSDCRYPTOCAP:ETH momentum check: After breaking consolidation, Ethereum rides an ascending wedge, clinging to support while eyeing the 3000 supply band overhead. Earlier triangle pops hint bulls may punch resistance. Chart bias and TA remain constructive.
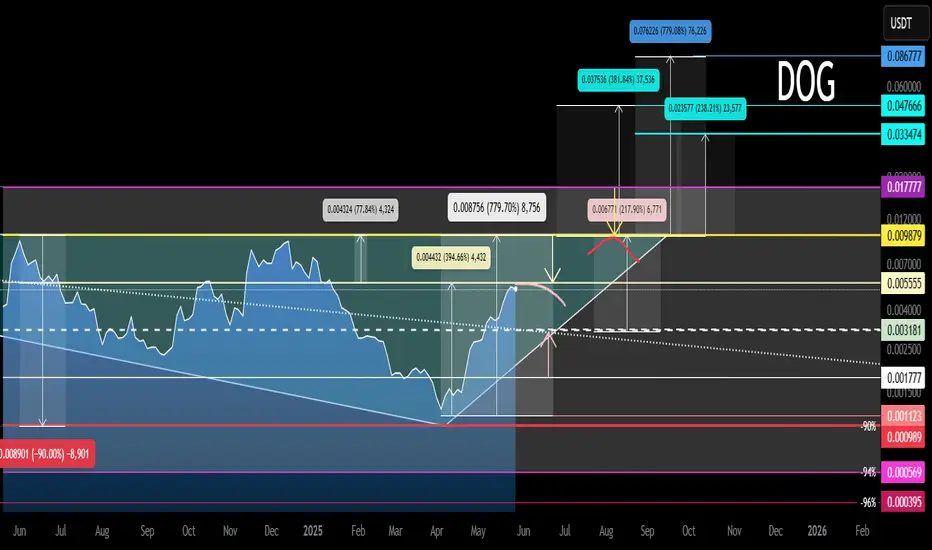
DOG Main Trend. Reversal Zones 05/29/2025Logarithm. Time frame 3 days. The chart shows key reversal zones in the horizontal channel, and when exiting it. For clarity, percentages are shown from the skin reversal zone. This is convenient for understanding the risk and potential profit in long and short work. You can also work in spot from long, from key zones (more relevant, as margin trading on assets of such liquidity, is extremely destructive, due to price slippage under the market, but already on such assets by a huge percentage, for your liquidation (accumulation of liquidity-benefit of gambling addicts in general).
Now the price has hit the resistance of the internal channel, that is, the zone of the “main liquid” price movement. From the reversal, local profit is significant, therefore, when working, observe risk management and wait for a breakthrough of this resistance level (you can place a trigger order), or wait for a rollback (if there is one), for example, to the median of the channel.
The horizontal channel itself is reformatted into a potential “microphone” (what was half a year ago on bitcoin, with resistance to the 72 thousand zone, and liquidity collection 53-58).
GEC gecko inu ready for pump IHNS pattern, volume increase significantly is a sign of reversal 🚀🛰
NFA!DYOR!
