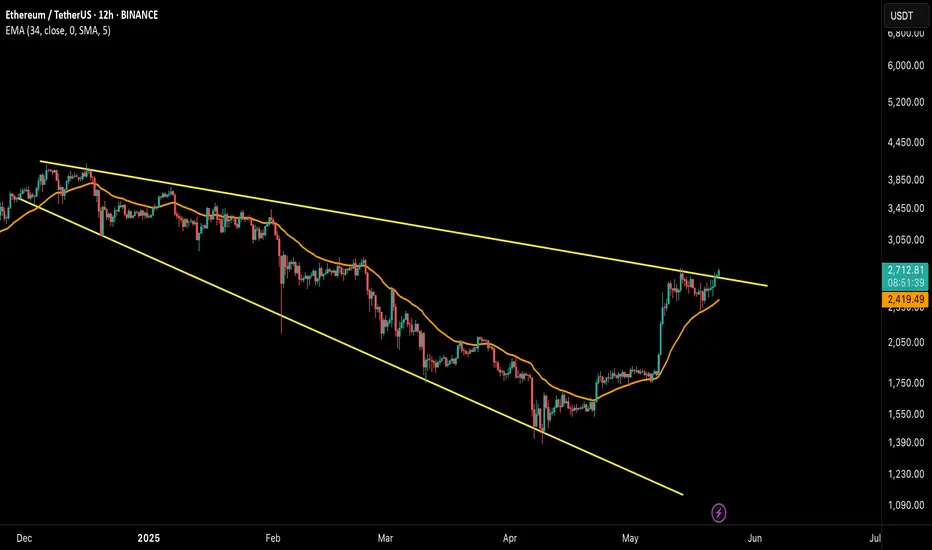
ETH/USDT – Breaking Out After BTC!🚀 Hey Traders! 👋
If you’re finding value in this analysis, smash that 👍 and hit Follow for high-accuracy trade setups that actually deliver! 💹🔥
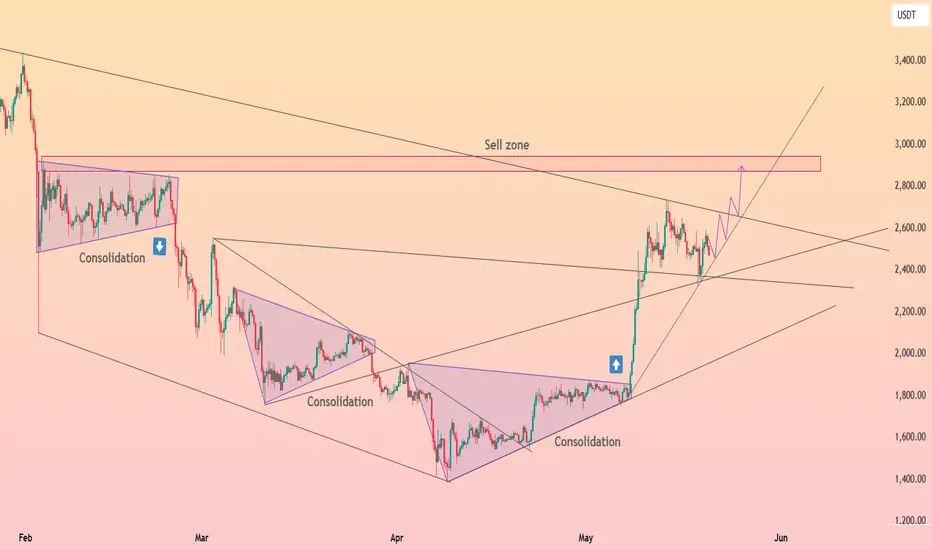
After BTC’s rally, it’s ETH’s turn to shine! 🔥
Ethereum has officially broken out of the descending channel on the 12H timeframe, a structure that’s been holding price down since late 2024. This breakout is significant — and here’s why:
📊 Technical Breakdown:
🔸 Broadening wedge finally broken after months of compression
🔸 Price holding well above the EMA, confirming short-term bullish momentum
🔸 Strong volume on breakout candle, suggesting genuine buying pressure
🔸 Breakout coincides with BTC’s surge — signaling altcoin rotation could be starting
📍 Key Levels:
➡️ Immediate Resistance: $2,850
➡️ Short Term Target Zone: $3,200–$3,500
➡️ Major Target Zone: $5000
➡️ Support to Watch: $2,480 (EMA + breakout retest)
💡 Why It Matters:
This move isn’t just technical — it’s psychological. ETH has been lagging BTC for weeks, and this breakout could shift trader sentiment back toward altcoins. If ETH holds above the breakout zone, we may see altcoins gain serious traction in the coming days.
📌 Strategy Note:
Look for a successful retest of the breakout zone for confirmation. A strong daily close above $2,700 could pave the way for a sustained uptrend.
What’s your ETH price prediction? Drop it in the comments and let’s ride this momentum together! 💥
Altseason
Altcoin Season Brewing?Hi,
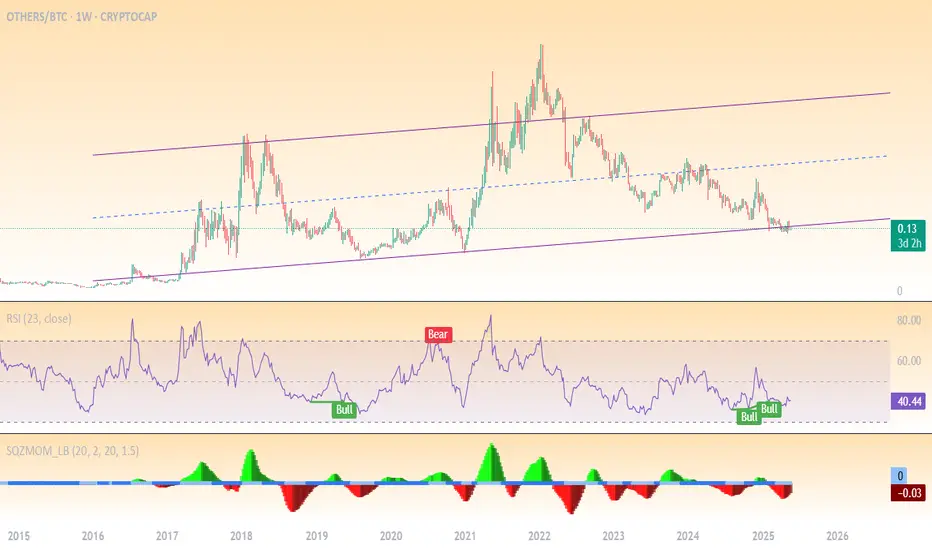
The OTHERS/BTC pair represents the collective market capitalization of altcoins relative to Bitcoin. This ratio is a critical indicator of altcoin strength or weakness against Bitcoin. The weekly chart reveals a prolonged bearish phase for altcoins, with Bitcoin dominance persisting. However, recent data suggests potential inflection points worth monitoring.
Key Technical Elements:
- Ascending Channel: The pair is moving within a well-defined macro upward channel. It is currently sitting at the bottom boundary, suggesting a potential reversal point.
- Support Zone: The lower boundary of the channel (purple line) aligns with previous bounce points (2019, 2020, mid-2023), reinforcing its validity.
- RSI Indicator: The RSI has shown bullish divergence with price making lower lows while RSI forms higher lows.
My Opinion:
This chart suggests we are near the bottom for altcoins vs BTC, and the risk/reward is heavily tilted in favor of a bounce, especially going into a potential Q3-Q4 altseason. It’s a classic accumulation zone where smart money tends to position.
And what to do?
- scale into altcoin positions cautiously.
- Use the channel low as a stop-loss zone.
- Look for confirmation over the next 1–2 weeks with bullish candles or increased volume.
Happy Trading,
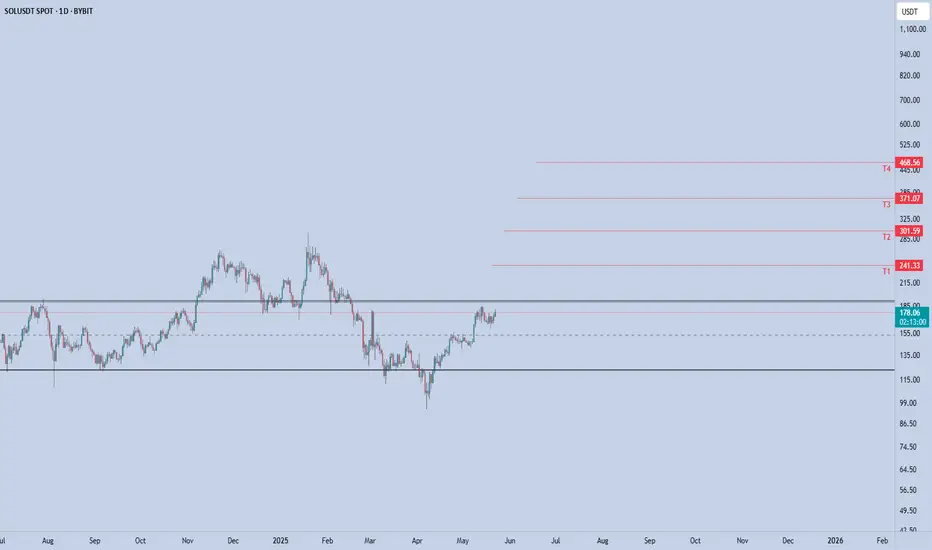
SOLANA - Light it up
SOLANA can flip the $185 resistance into support, it opens the door for a potential rally toward the next key levels:
T1: $241
T2: $301
T3: $371
T4: $468
The structure is clean, and the market sentiment is shifting. As long as SOL holds above the reclaimed range and macro conditions remain supportive, this setup could deliver serious upside.
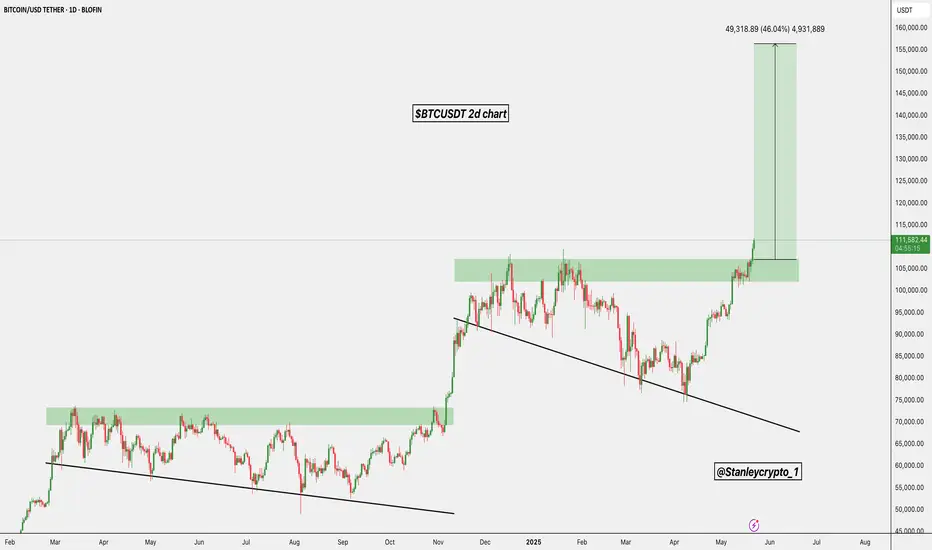
$BTC Breaks Out $155K Target in SightBitcoin has officially broken out above the key $105K resistance zone, confirming a strong bullish structure on the 1-day chart.
The price now exceeds the previous supply area, which has flipped into solid support.
As long as BTC stays above this level, momentum remains bullish with a clear path toward the next major target at $ 155 K.
This breakout marks a strong continuation of the uptrend, and traders should keep a close eye on any retest of the $105K zone for potential long
opportunities.
DYRO, NFA
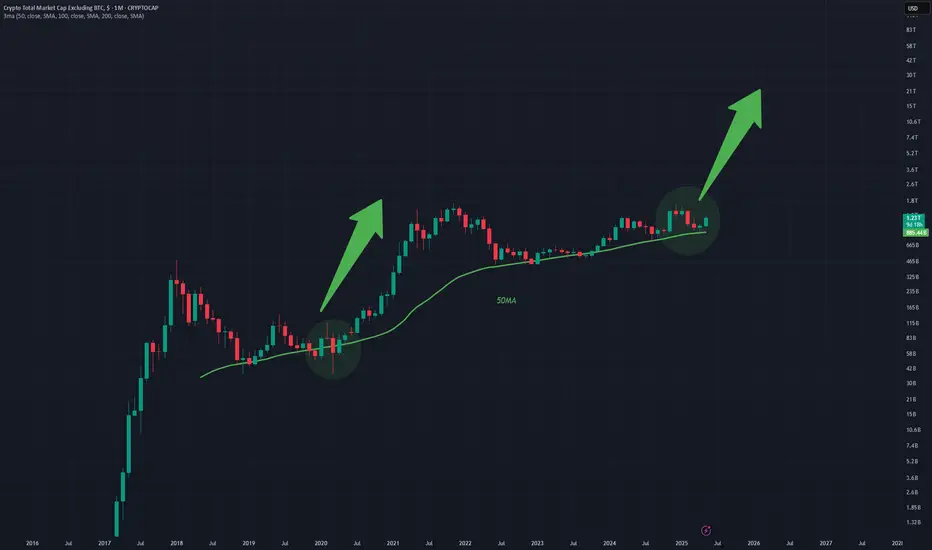
TOTAL2 - Great Bullish SetupGreat position for the bulls
Weekly chart so its gonna be a long position
Bullish bounce off the MA is expected and new ATH's for ETH and BTC will come
Weekly timeframe
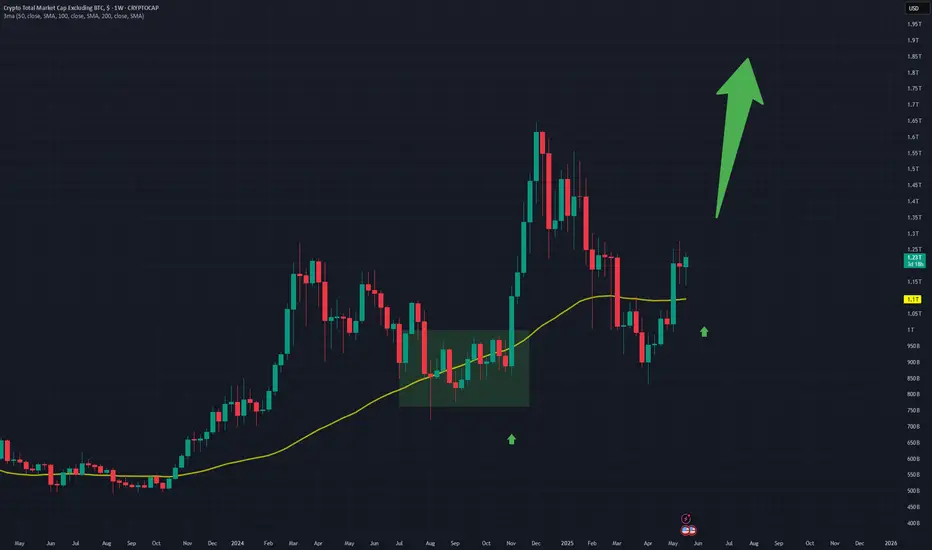
TOTAL2 - AltseasonMonthly observation of the alt coin market cap chart
Looks like the bulls are in for a treat
Very bullish favor
50MA has held quite well
Monthly chart
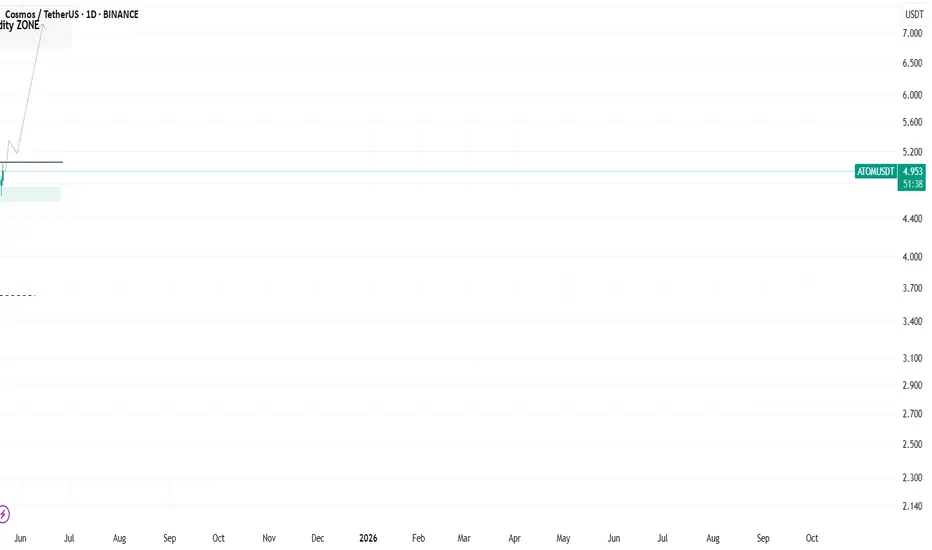
Don't Miss This Big Move on COSMOS (ATOMUSDT)Hello Everyone!
With Bitcoin on the rise and Ethereum likely to follow—as outlined in my recent ETHEREUM analysis idea —we continue to look for strong opportunities in the altcoin market. Right now, all eyes are on COSMOS ( BINANCE:ATOMUSDT ) as it shows promising signs of a potential breakout.
On Weekly timeframe
Price has swept the bottom of September 2024 liquidity zone.
On 4D timeframe
- On the OBV (On-Balance Volume) indicator , price has broken a downtrend—similar to the breakout seen in October 2024 , which was followed by a 170% rally.
- The previous 4-day candle closed above a key Fair Value Gap (FVG), indicating potential bullish momentum.
On 1D timeframe
- V shape inverse pattern.
- There’s significant liquidity in the $6.5–$7.5 range . After successfully breaking above the $5.1 level —just as I strongly anticipated—price is now likely targeting that liquidity zone.
To sum up, BINANCE:ATOMUSDT is demonstrating both fundamental strength and technical confirmation, making it a high-potential candidate in the current market environment.
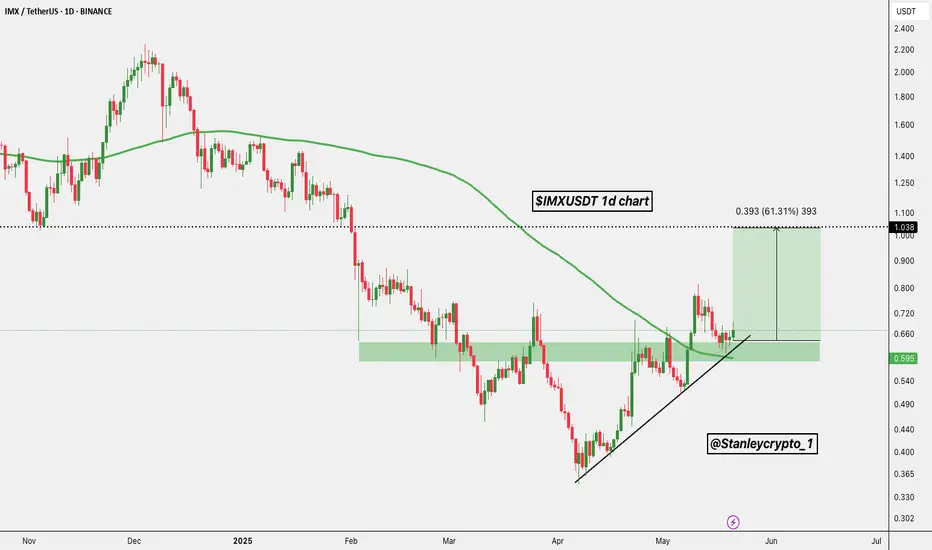
$IMXUSDT looks bullishSEED_DONKEYDAN_MARKET_CAP:IMX looks bullish on the daily chart after a clean breakout and retest of the $0.595 support.
Price is holding above the trendline and 100MA, signalling strength.
If momentum continues, the next target is around $1.03.
DYOR, NFA.
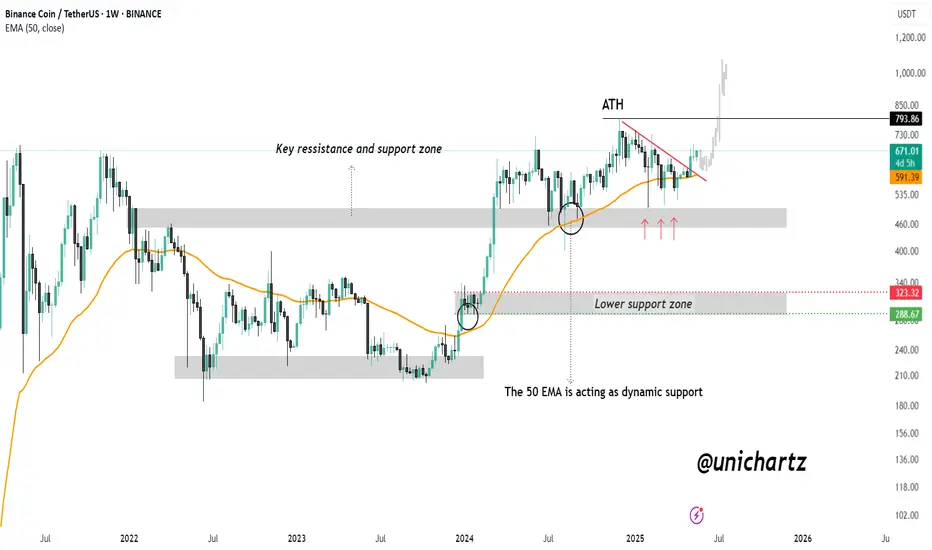
BNB Weekly Breakout: Road to $1,000?CRYPTOCAP:BNB is showing strong bullish momentum on the weekly chart. The 50 EMA is acting as a dynamic support, holding firm during multiple retests and providing a solid foundation for upward movement.
Recently, price action has broken above a key descending resistance line and successfully reclaimed a major support-resistance zone, turning it into a strong base. This area, which previously acted as a battleground for bulls and bears, is now supporting the current rally.
As long as BNB continues to hold above this zone and the 50 EMA, the structure remains bullish. With sustained momentum, a retest of the all-time high zone around $793 is likely, and a breakout above it could open the door for a move toward $1,000 and beyond.
DYOR, NFA
SUSHI Token: A High-Potential Setup You Shouldn’t IgnoreHello everyone!
A huge opportunity has emerged on the BINANCE:SUSHIUSDT chart. I’ll break down the technical analysis for SUSHI using both the Daily and 4H timeframes , highlighting key levels and potential trade setups.
On 1D timeframe
- Price has swept the liquidity below the November 2024 low , forming an inverse Head and Shoulders pattern , which is a strong bullish reversal signal.
- Price recently broke did the May high after that retraced approximately 24% . This pullback aligned perfectly with a retest of the neckline from the inverse Head and Shoulders pattern, reinforcing its validity as a bullish setup.
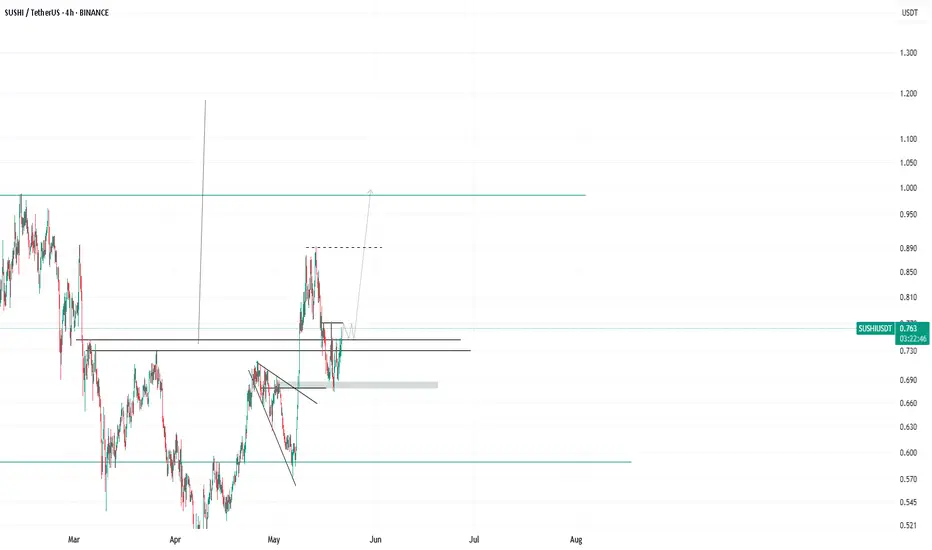
On 4H timeframe
- If price breaks above $0.775 , it would serve as a confirmation of bullish momentum, suggesting a likely move toward the liquidity zone above $1.00 .
- In my opinion, if market conditions remain bullish and Bitcoin continues its upward trend, SUSHI is likely to break above the $1.00 level with ease and potentially reach the inverse Head and Shoulders target around $1.20+ .
In conclusion, SUSHI is currently showing strong bullish signals, and if the broader market gives altcoins room to run, this token has the potential to rally aggressively.
Note: SUSHI is a low-cap token with high volatility, so exercise proper risk management when trading or investing.
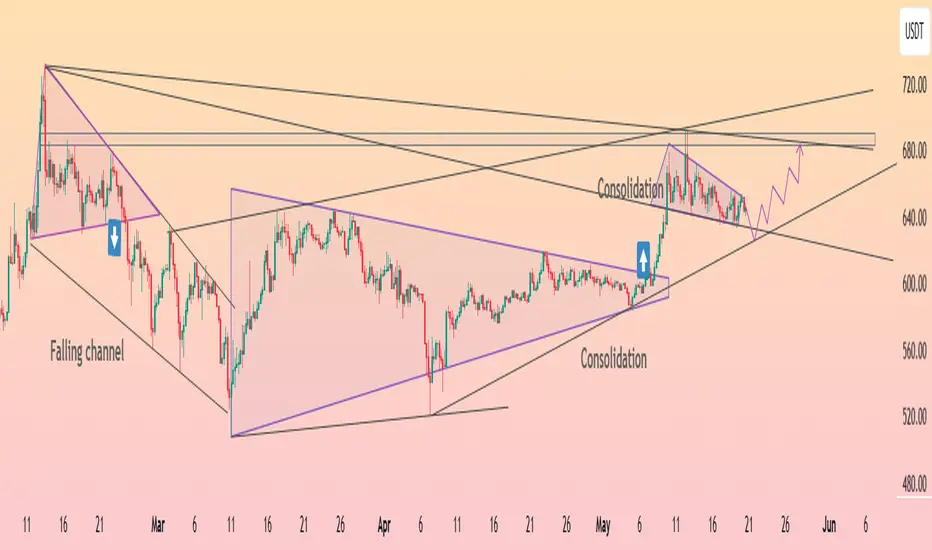
HolderStat┆BNBUSD digesting the wedge breakCRYPTOCAP:BNB shattered a year-long descending wedge, sprinted to 670 USDT, and now forms a pennant atop the 620 neckline. Holding 620 keeps the 700-730 target alive; drop below 600 and price risks sliding back inside the old wedge toward 560. 🔔
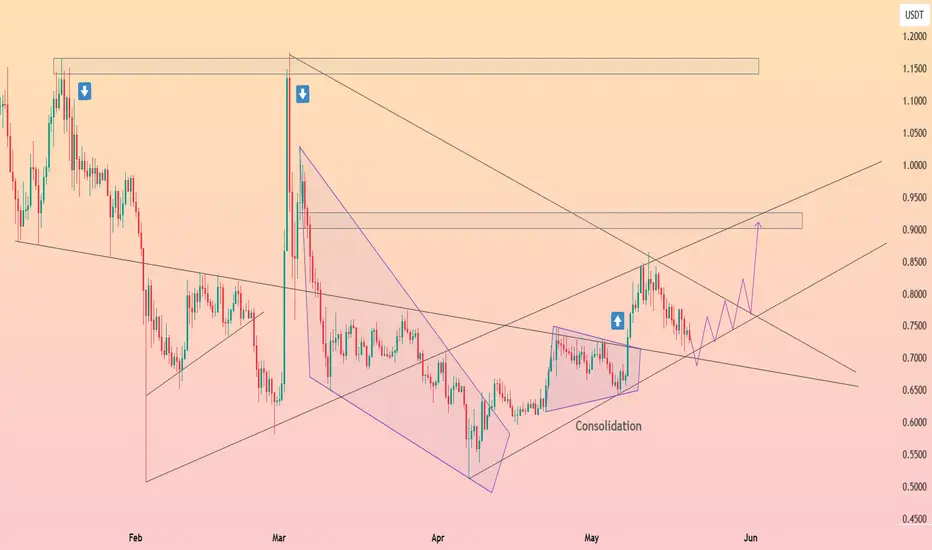
HolderStat┆ADAUSD trend support in focusCRYPTOCAP:ADA slid from 0.84 into the long-standing 0.72 up-trend that has anchored every rally since April. Regaining 0.78 re-targets 0.88-0.92 and eventually the 1.00 psyche level, while a daily close beneath 0.70 warns of a deeper probe toward 0.64. 🌟
HolderStat┆XRPUSD guarding the breakout lineCRYPTOCAP:XRP rocketed from a triangle breakout to 2.6 USDT, then retraced to the 2.30-2.35 confluence of breakout trendline and rising support. Higher-low structure is alive: maintain it and the measured path opens toward the 2.85-3.00 resistance band. A decisive candle under 2.25 would neutralise near-term upside. 📈

HolderStat┆SOLUSD retesting the supportCRYPTOCAP:SOL has ridden a well-behaved growth channel since early April. After rejection at 180 USDT, price tests the channel spine around 165, which also marks the April breakout node. Defend it and the upper rail near 195-200 beckons; lose 160 and eyes shift to the lower boundary close to 150.

HolderStat┆ETHUSD reboundedCRYPTOCAP:ETH exploded out of its multi-month falling wedge, racing from 1.8 k to 2.7 k. It now straddles the broken wedge roof plus a fresh rising guide at 2.45-2.50 k. Hold that shelf and the chart still projects into the 2.9-3.0 k sell zone; slip beneath 2.35 k and bulls will likely regroup at deeper support near 2.2 k. 🎯
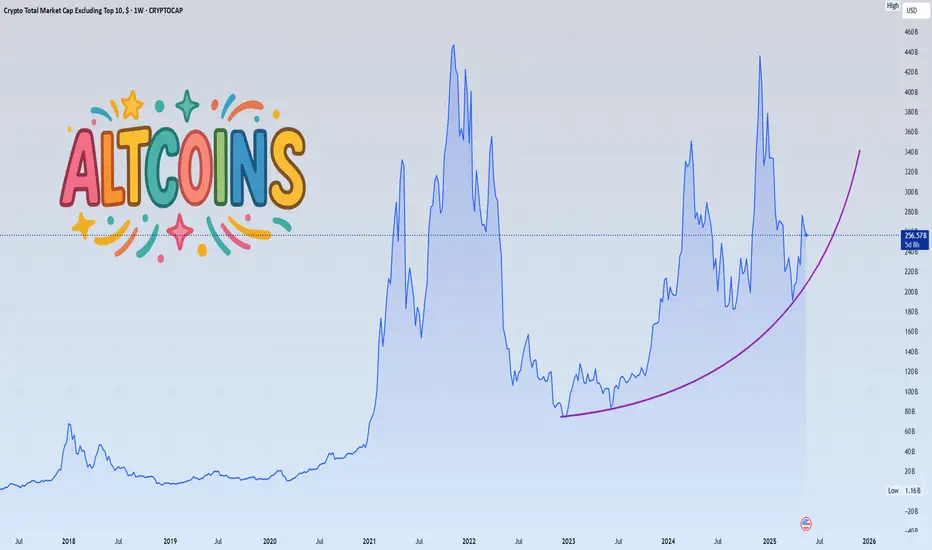
THESE ALTS can +100% | ALTSEASON PART2️⃣Altseason usually happens when BTC trades close towards a new ATH, as it is doing now, and takes some time to stall/trade sideways
Now this season is working a little differently. Usually ETH makes its way towards new highs, but we haven't seen that just yet. Ethereum has HUGE upside potential still.
It's hard to say just how high Ethereum can go, but what we do know is that it's still 88% away from the previous ATH, and due for a new one...
ENA is another alt with big upside potential, from it's previous peak its more than 200% away:
Solana has made a strong V-shaped recovery and if ETH is primed for new ATH, SOL is sure to follow:
TRUMPcoin may be memecoin, but the again so is PEPE! Still big upside after a long while of range trading here:
IOUSDT: Inverse Head & Shoulders Breakout – The Reversal is RealBINANCE:IOUSDT has just completed a textbook Inverse Head and Shoulders pattern, one of the most reliable reversal setups in technical analysis. After a prolonged downtrend that left the asset oversold and undervalued, the market has begun to shift. We’ve now seen a clean breakout above the neckline and a healthy retracement back to it. A classic confirmation signal that often precedes strong bullish moves.
This shift is further supported by the emergence of higher highs and higher lows on the smaller timeframes, suggesting that bullish momentum is building. With the downtrend now exhausted, BINANCE:IOUSDT looks poised to begin a new uptrend that could offer solid upside potential for early entrants.
As always, risk management is key. While the pattern setup is strong, it’s crucial to place stop losses just below the right shoulder or neckline to protect against unexpected volatility. The market doesn’t offer guarantees, but this setup offers high-probability conditions worth paying attention to.
BINANCE:IOUSDT Currently trading at $0.98
Buy level : Above $0.95
Stop loss : Below $0.76
Target : $2.65
Max leverage 3x
Always keep stop loss
Follow Our Tradingview Account for More Technical Analysis Updates, | Like, Share and Comment Your thoughts

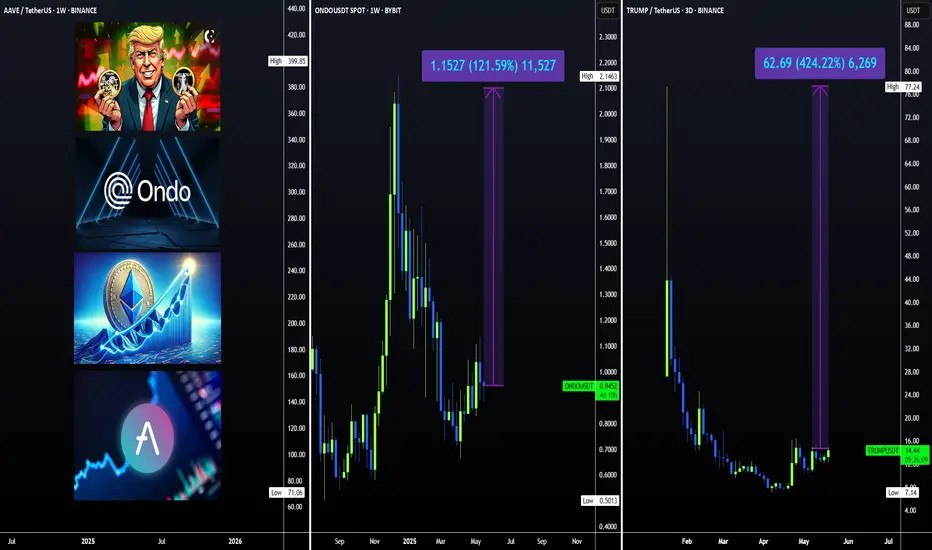
ALTS - Altcoins you MUST WATCH for ALTSEASON1) ONDO | BYBIT:ONDOUSDT
After some consistent higher lows, ONDO is likely on its way back towards it's previous ATH:
2) ATOM | BINANCE:ATOMUSDT
Cosmos is one of my favorites, and I'm patiently waiting for the parabolic run on this one:
3) SONIC | BYBIT:SONICUSDT
SONIC / previously FTM is trading nearly 290% away from its previous ATH, with great upside potential.
4) AAVE | BINANCE:AAVEUSDT
AAVE still has a bit to gain before reaching its previous ATH, and the parabolic run has actually already started:
5) ENA | BINANCE:ENAUSDT
IF ENA can hold it's current support, there's a huge upside awaiting this alt:
😊🧡 Please like and follow !!
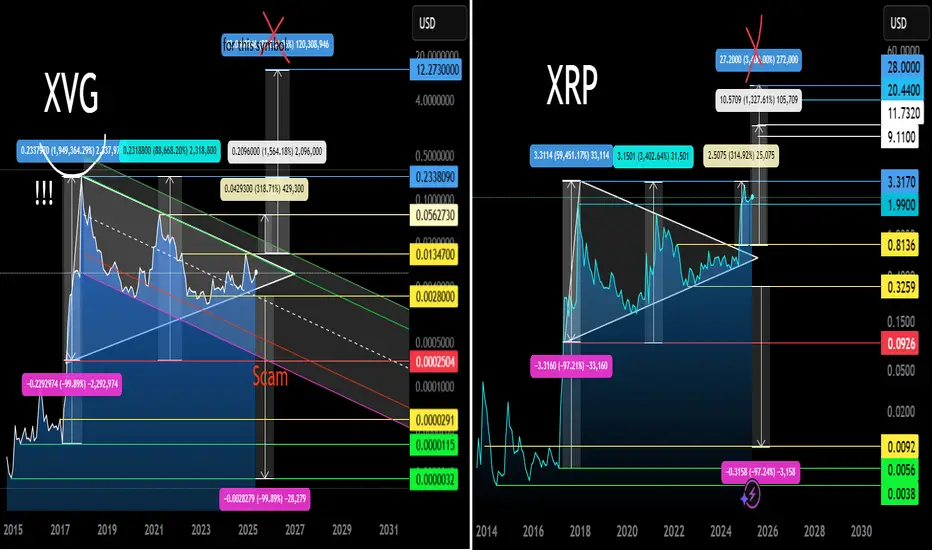
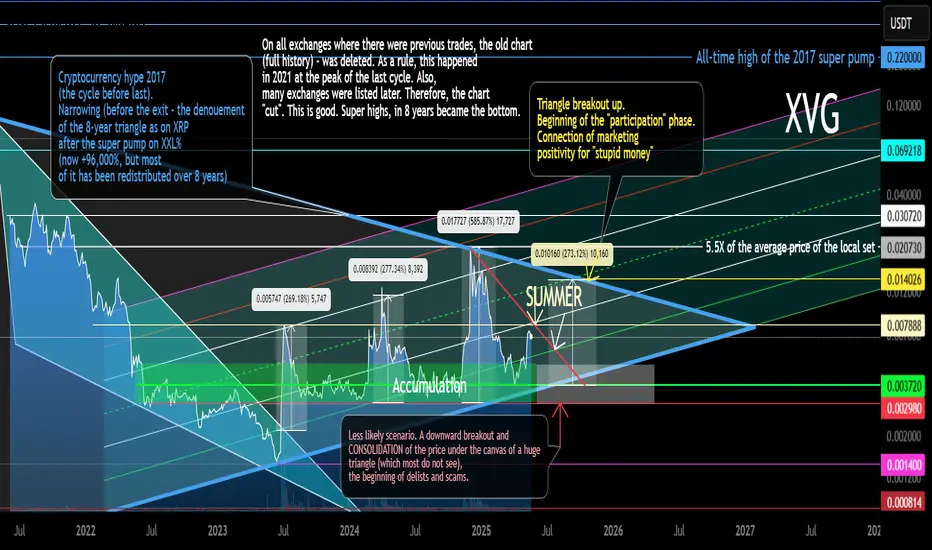
XRP vs XVG 8 Year Triangle Fractal Comparison 05 2025Logarithm. Time frame 1 month. Linear chart for clarity. Two cryptocurrencies of the super hype of altcoins in 2017 (the final alt season of the cycle before last). XRP is ahead of XVG. The structures are similar, but if XVG breaks through the triangle upwards like on XRP, then work with the first target, observing risk management. You can leave 5-10% of the position for the second target, but this is not necessary. As for XRP, everything is as before... local update in the XRP idea.
XVG Secondary trend (part) Resolution of the triangle 8 years 05 2025
XRP/USD Main trend 28 07 2022
THETA Token Is In A Larger Flat CorrectionTheta Token with ticker THETAUSD made a deeper retracement in the last year, but it’s actually still above 2023 lows, so it can still be a larger regular 3-3-5 A-B-C flat correction in play. After recent projected five-wave impulse into wave (C) of a three-wave (A)(B)(C) decline in blue wave B, it can be now on the way back to March 2024 highs for blue wave C, which could be a five-wave impulsive cycle. Currently, it can be still unfolding a lower-degree five-wave impulse into wave (1), so more upside is expected for wave (3), especially if breaks above 1.74 bullish level, just be aware of wave (2) pullback.
Theta Token (THETA) is the native cryptocurrency of the Theta Network, a blockchain-powered platform designed for decentralized video streaming and content delivery. It aims to improve the efficiency and cost of streaming by allowing users to share bandwidth and computing resources on a peer-to-peer basis.

XVG Secondary Trend (Part) Triangle Resolution 8 years 05 2025Logarithm. Time frame 3 days. Linear instead of candlestick specifically for clarity. This is the longest chart history on tradingview that could be found. It does not display everything as is. Where this cryptocurrency was previously traded, the exchanges deleted the entire trading history. Listing on new exchanges does not display the whole picture. I described and showed everything on the chart. More in the channel, screenshots and comparison with XRP, here the site does not provide an opportunity to make such a comparison, as there are simply no charts of such history.
Verge (XVG) like XRP identical chart of the main trend, and the same 8-year triangle after the pumping of 2017. The only difference is that XRP came out of its triangle half a year ago, in alt season #2 of this cycle, and this cryptocurrency is still in the canvas of its triangle. But the price is gradually being driven into a corner. In alt season #3, most likely, the denouement of this story lasting 8 years will occur. More up than down (at the beginning).
Verge (XVG), like XRP, is an asset of the super pump of 2017 and the price retention is -96-98% from the super pump by hundreds of thousands of percent (I am not mistaken exactly so), which forms a huge triangle on XXX (8 years). This is all inherent in the assets of the hype of 2017: XVG XRP NEM XLM ZEC XMR DASH LTC and so on ... Some of them, over the past 2 years, have become on the path of hype (XRP XLM), and some on the path of scam (I do not want to make anti-advertisement).
Most likely, everything will repeat on XVG, as on XRP, but only at the right time, in the final alt season of this cycle. "XVG captains" do not have as much money and a powerful state behind them as XRP, to go against the market and the general trend, therefore, they need the market hype to distribute "a little higher". And so with most of these altcoins. Do not forget to get rid of them on the pump. Remember, the more down-to-earth goals, the more likely you are to earn over the long term. Observe risk and money management.
Remember, there is a big alt season ahead, provided that you are an adequate person and your goals are appropriate.
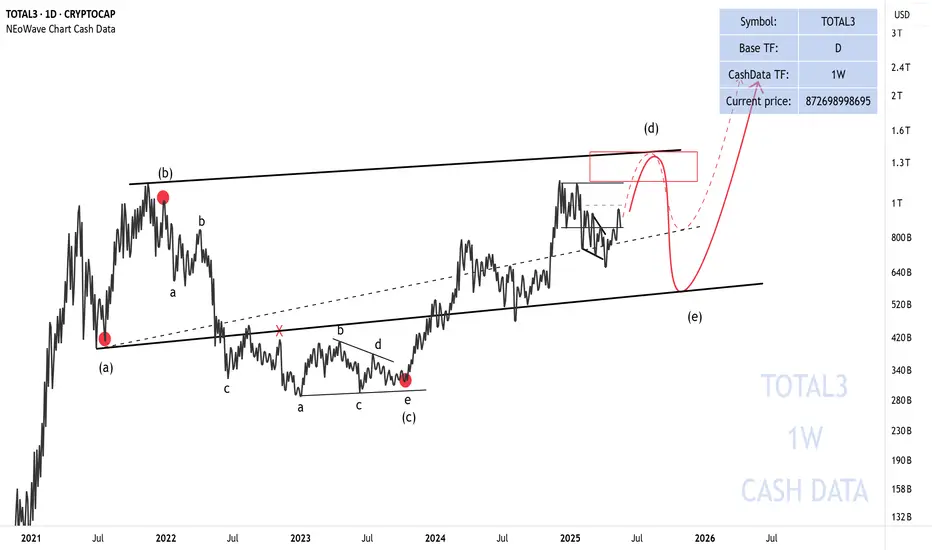
Has the Alt Season Started?Cash Data 1W
By analyzing the weekly Cash Data chart of TOTAL3, we observe that after a rapid and significant rise, a correction in TOTAL3 has begun, which appears to be forming a Neutral Triangle pattern.
Wave Analysis:
Wave-(c) is a double pattern with a small X-wave, making it the most complex wave. However, there is a possibility that wave-(d) could become more complex than wave-(c). We are currently in wave-(d). Given that wave-(b) has surpassed the start of wave-(a) and wave-(c) has been fully retraced by wave-(d), there is a likelihood that a Running Neutral Triangle is forming. For confirmation, wave-(d) must exceed the starting point of wave-(c).
Conclusion:
Based on the analysis, wave-(d) could rise to the range of 1.14–1.38 trillion USD. Subsequently, wave-(e) will begin and may conclude within the retracement zones identified on the chart. To accurately determine the target for wave-(e), we need wave-(d) to complete, allowing us to predict the end of the Running Neutral Triangle with greater precision.
After the completion of the Running Neutral Triangle, we expect a significant rally in altcoins.
Good luck
NEoWave Chart
ETH + ALTSEASON | NEW All Time Highs Soon ??This would have been the first time that BTC made a new ATH during a bullish cycle, but ETH didn't - are we too hasty?
Very interesting to compare the two side by side and see that ETH has much more to gain than BTC:
The BTC new ATH update can be found here:
______________________
BINANCE:BTCUSDT BINANCE:ETHUSDT
