Is Your Altcoin on the Chopping Block?-Update: Originally posted on July 8, 2025… but swiftly vanished into the void by a moderator (rookie mistake—I neglected the sacred posting rules). Turns out, publishing has rules… that I did not interpret accurately?
To my loyal circle of 5 followers: if this feels like déjà vu, my sincerest apologies for the rerun. But with the winds shifting and the drums beating for alts season, I figured it was worth a resurrection.
Let the thrills—and the calls—begin. 🎭📈
Whenever you see “-Update:” that’s the latest as of today — 07/18/25.
Is Your Altcoin on the Chopping Block? 🪓
Brace yourself—this might sting.
Odds are, your favorite altcoin is walking a tightrope. And while I’m not here to spread doom, I am here to give you a wake-up call. Don’t shoot the messenger.
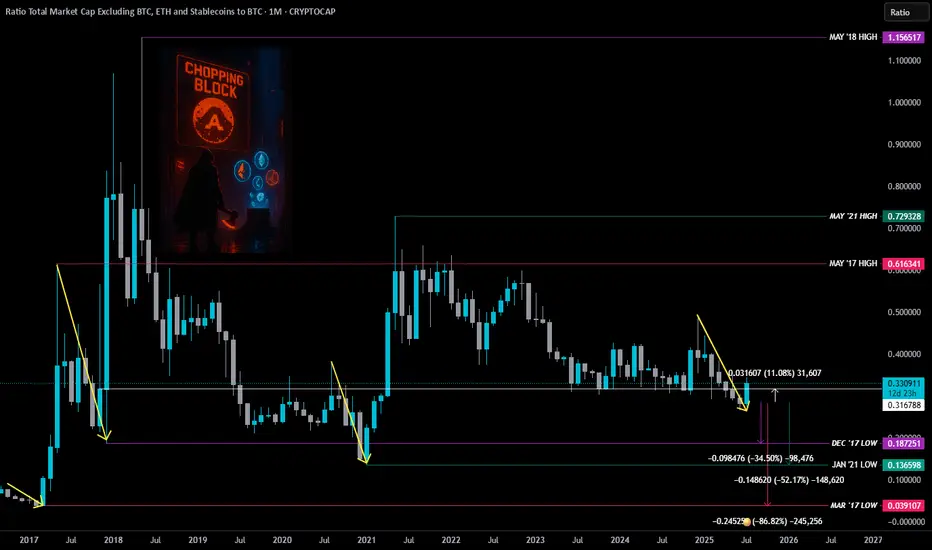
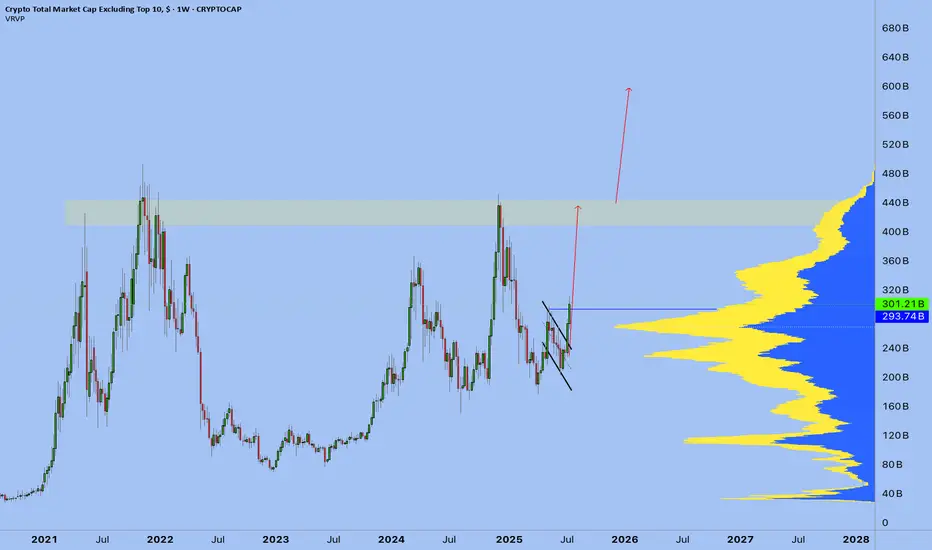
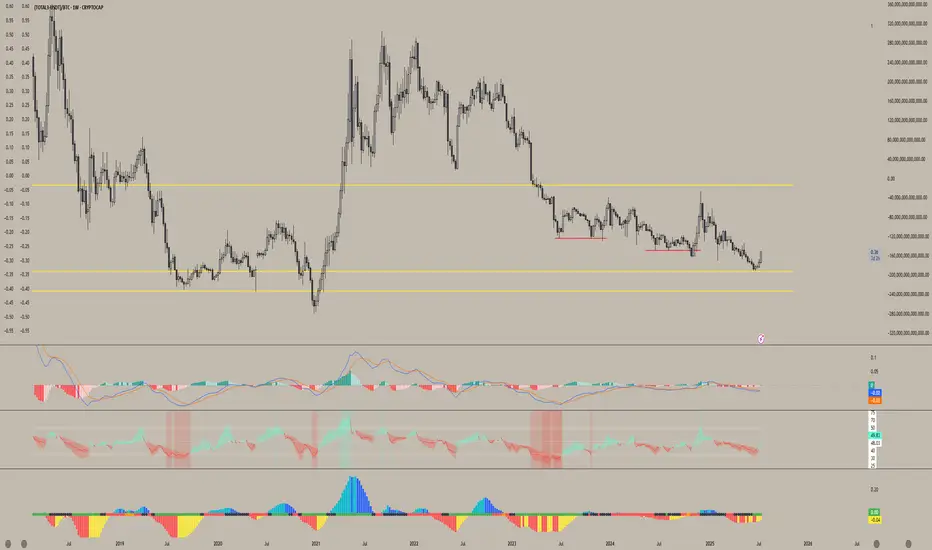
TradingView recently dropped a chart that cuts through the noise: Total3ESBTC.
It’s a ratio of the Total Crypto Market Cap (minus BTC, ETH, and stablecoins) to Bitcoin.
Translation?
👉 A clear, undistorted look at how the altcoin market is actually doing—without ETH clouding the view or stablecoins muddying the waters.
Think of it like night-vision goggles for spotting altcoin strength—or weakness—in the shadows of BTC dominance.
Perfect tool to sniff out market rotation—that sweet spot where Bitcoin hands the baton to alts or rips it back.
So why should you care?
Because the writing's on the wall... and most altcoins might not survive what's coming.
Let’s break it down:
ZOOMED OUT – MONTHLY VIEW 🔭
Before every major altcoin run, there’s always a major low.
You’ll notice three big ones:
🔴 March 2017 (Pink Line)
🟣 Dec 2017 (Purple Line)
🟢 Jan 2021 (Green Line)
Yes, some individual alts have pumped. A few even went full parabolic.
But if altcoins as a whole were ready to fly? They would've taken off already.
-Update: Yes, they finally did it this week… but hold that excitement—there’s more to the story.
Instead, the altcoin ratio broke a critical support (White Line) back in May... and even closed below it. That’s not bullish—it’s a red flag flapping in the wind.
– Update: We just sliced through that white line, but for most alt’s to stay strong, we need a monthly close above it.
Strangely enough (or coincidental, if you believe in coincidences) ...
🗓️ All the major altcoin market highs happened in MAY.
Not once. Not twice. Every. Single. Time.
🔴 May 2017
🟣 May 2018
🟢 May 2021
Call it coincidence. Call it cycle magic.
Maybe it’s a message from the crypto gods—and they don’t whisper for no reason.
So if we just had another May, and the ratio is still sliding with no reversal in sight… ask yourself:
Was that the high?
Or are we still heading toward the low that resets the board?
Here’s the hard pill 💊
If altcoins are ever going to go up again, odds are they’ll need to hit one of these historical lows first.
That’s not a prediction. It’s just how the markets have moved before major alt run.
📉 That means more pain ahead.
We’re talking potential drops of:
🔻 -32% to revisit Dec '17 levels
🔻 -51% to retest Jan '21 lows
🔻 -85% if we go full wipeout to March '17
Harsh? Yeah.
But better you hear it now than wonder “what happened?” when the floor caves in.
The worst part?
Most won’t believe this until it’s already too late.
-Update: Those lows haven’t been tested yet—might be wise to hold off on loading your bags to the brim. Patience pays.
Now here’s the uncomfortable twist:
There’s a legit case to be made that we may never see another “real” alt season again.
Why?
🪙 Liquidity is being siphoned by stablecoins
📈 Speculation is migrating to AI stocks
⚠️ Risk appetite is narrowing
Altcoins used to be the Wild West. Now? They’re the illiquid backyard of a global casino.
BUT… Let’s put on our degen-tinted glasses for a second.
Suppose the Fed hits the panic button:
🛩️ Rates cut
💸 QE returns
🚁 Helicopter money rains from the sky (not that they’d ever do that… right?)
– Update: Crypto Week is announced and broadcasted to the herd.
What happens then?
That’s when this chart—this ugly, broken, bleeding chart—might finally spring back to life.
– Update: Clearing those lows would’ve made this week feel a lot more convincing. But if you’re looking for signs of life—ETH/BTC chart might just be lighting the way. 🚀
Stay Sharp! 🐋R hUNTING!
THIS IS NOT FINANCIAL ADVICE. FOR EDUTAINMENT PUPOSES ONLY.
Altseason
The altcoin bottom is nearHey everyone — I’d like to share some thoughts with you. I believe this chart is a pretty good bottom indicator for altcoins. It has performed well so far, and it’s what I’ll be watching when looking to buy.

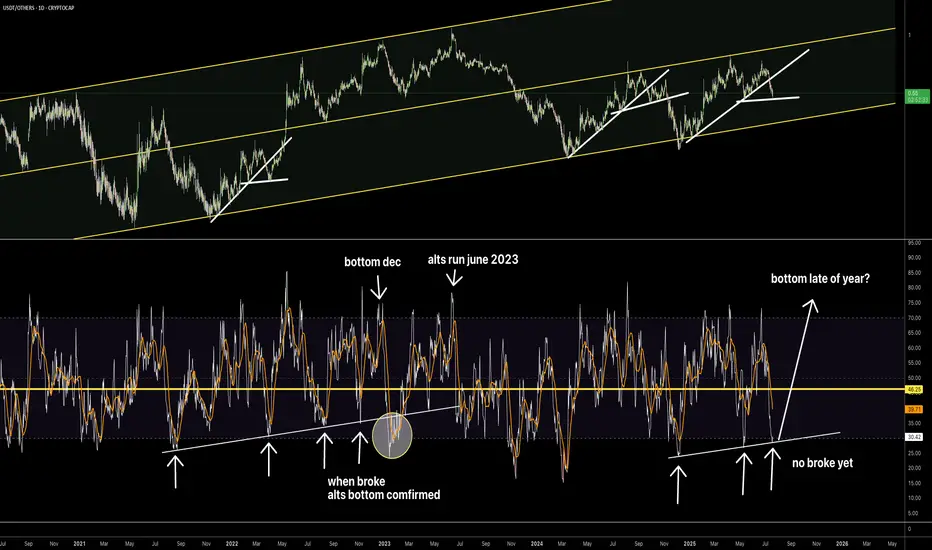
Where is the altcoin bottom?Hi everyone — keep a close eye on the 1D RSI of the USDT/OTHERS chart. As long as it holds, we’ll keep bouncing and seeing corrections. Only after it breaks can we start talking about a trend reversal.
SOL/USDT Technical Outlook – Breakout Holding, Eyes on 175+Solana has successfully broken above the key resistance zone at $155–157 and is currently testing it as new support. If the level holds, this breakout could extend toward the next major target around $175–178.
📌 Key Insights:
Clean breakout followed by a potential SR flip
Watch for confirmation of support before continuation
Target aligns with previous swing high
Invalidated on breakdown below reclaimed level
🟢 Bias remains bullish as long as price holds above the breakout zone. A confirmed retest could provide a high-probability long setup.

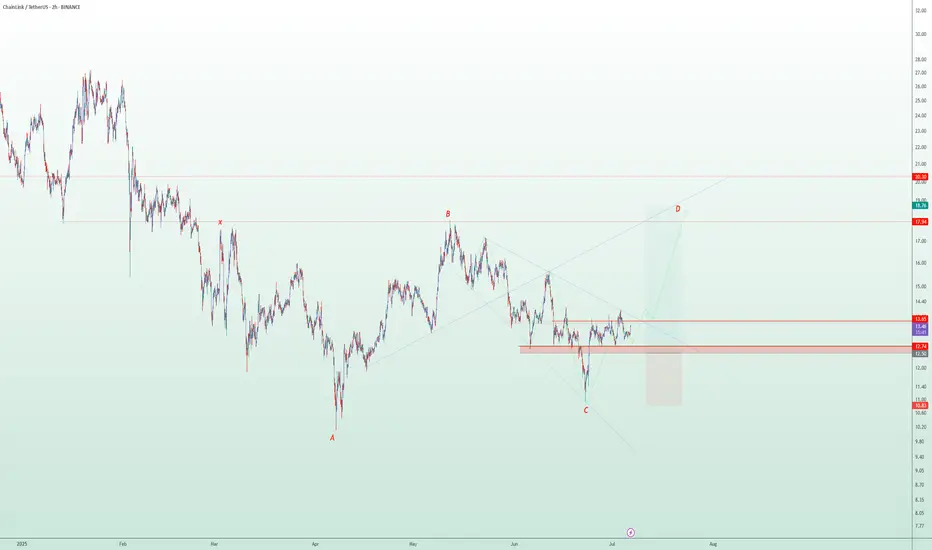
Wings of Opportunity: LINK’s Harmonic Setup Unfolding🦋 Title: A Butterfly on the Edge – But Only with Confirmation
On the 2H timeframe, a Bullish Butterfly Harmonic Pattern is unfolding. The wave structure (X → A → B → C → D) aligns closely with harmonic principles, and point D lies above X, within the 1.27 to 1.618 Fibonacci extension of XA — reinforcing the pattern’s validity.
📌 No entry has been triggered yet.
We are currently waiting for price to break and hold above the key resistance at 13.60 to confirm the bullish scenario.
🔹 Bullish Scenario (our primary and preferred outlook):
Given the strong reaction around the 12.74 demand zone and the harmonic structure completion, we are primarily focused on a long opportunity, if and only if confirmation is achieved above 13.60.
📥 Entry Zone: 13.05 – 13.65
🎯 Target 1: 17.94
🎯 Target 2: 18.76
🛑 Stop-Loss: Below 12.74 (structural invalidation)
🔻 Alternative Bearish Scenario:
If price fails to break 13.60 and instead loses the 12.74 support, the bullish setup becomes invalid, and the market could enter a deeper correction phase.
Potential downside targets in that case:
📉 11.80
📉 10.90 – 10.30 (if bearish momentum continues)
📊 Risk Management Notes:
Position sizing should not exceed 1% of total capital
Avoid early entries before confirmation
Prefer partial entries after breakout and retest
Stick to the invalidation level strictly
📈 While both scenarios are on the table, we are currently favoring the bullish setup, as long as price action supports it. Discipline and patience are key — confirmation first, trade second.
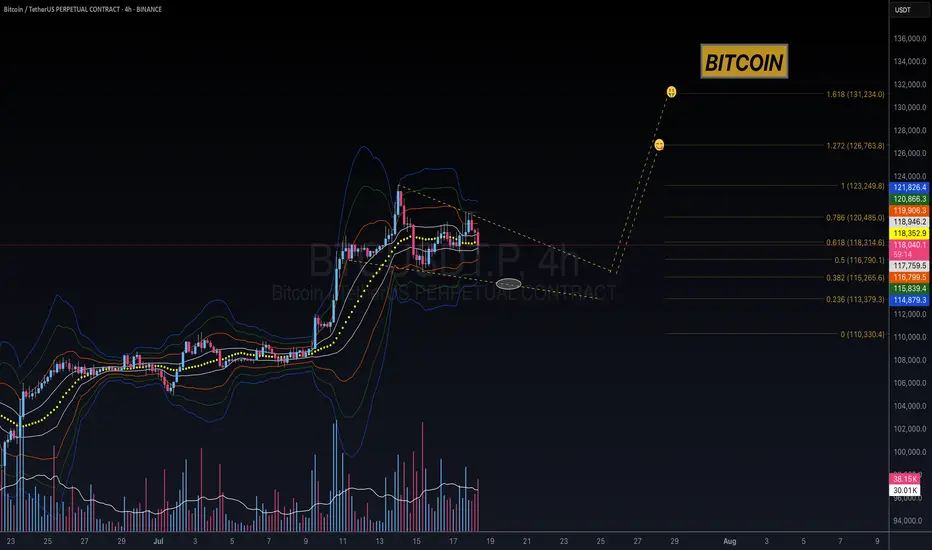
BTC - Long the $115k LiquidationsHiya friends,
Hope the market has been treating y'all well.
Long Btc soon for another leg up! Then take profits! LOL
Trade thirsty, my friends!
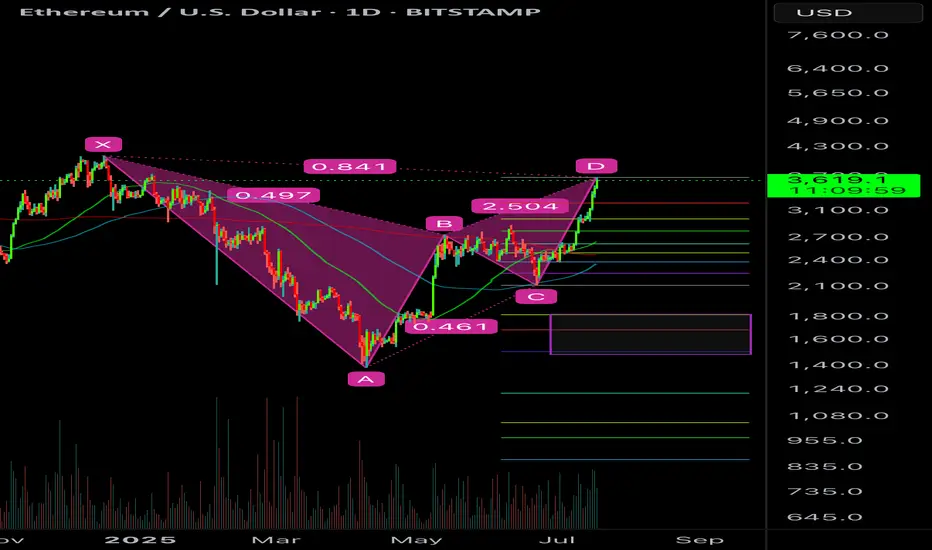
ETH BEARISH BAT POTENTIALETH can go slightly higher but it’s at/near the .886 retracement and meets a valid bearish bat pattern.
I would be targeting a full move if it is unable to break above the .886.
Too many euphoric here. The move has been really scammy off the hype news of Genius Act which everyone saw coming. Expect a sell the news event and BTC.D bounce would destroy alts for one last capitulation most alts may drop 40-50% from here. Then the real bull will start.
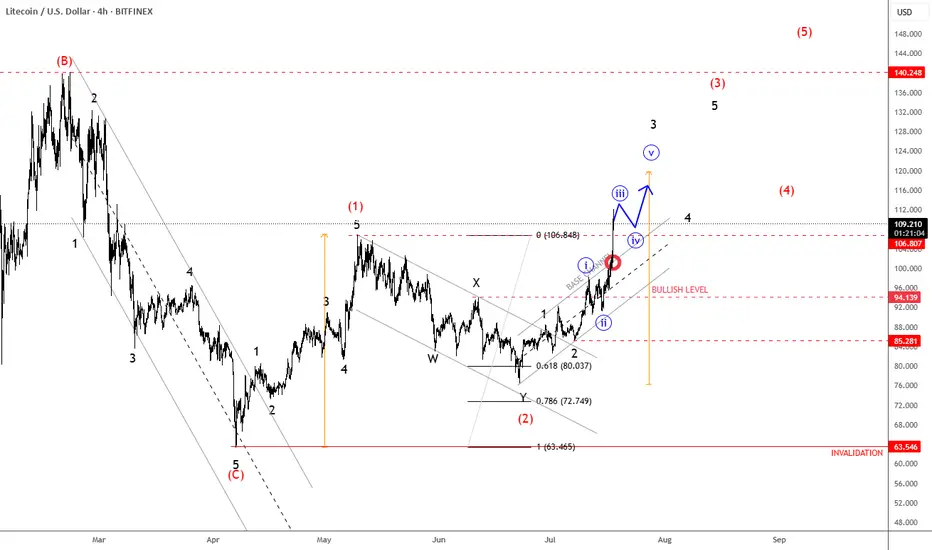
Litecoin Continues Its Bullish Cycle As ExpectedLitecoin Continues Its Bullish Cycle As Expected, which can send the price even higher from technical point of view and by Elliott wave theory.
We talked about Litecoin back on May 30, when we spotted a bullish setup formation with waves (1) and (2) that can extend the rally within wave (3) of a five-wave bullish impulse.
As you can see today on July 18, Litecoin with ticker LTCUSD is now breaking strongly back above May highs after we noticed a complex W-X-Y correction in wave (2). Now that ALTcoin dominance is stepping strongly in, we may easily see more gains within a projected five-wave bullish cycle during the ALTseason, just be aware of short-term pullbacks.
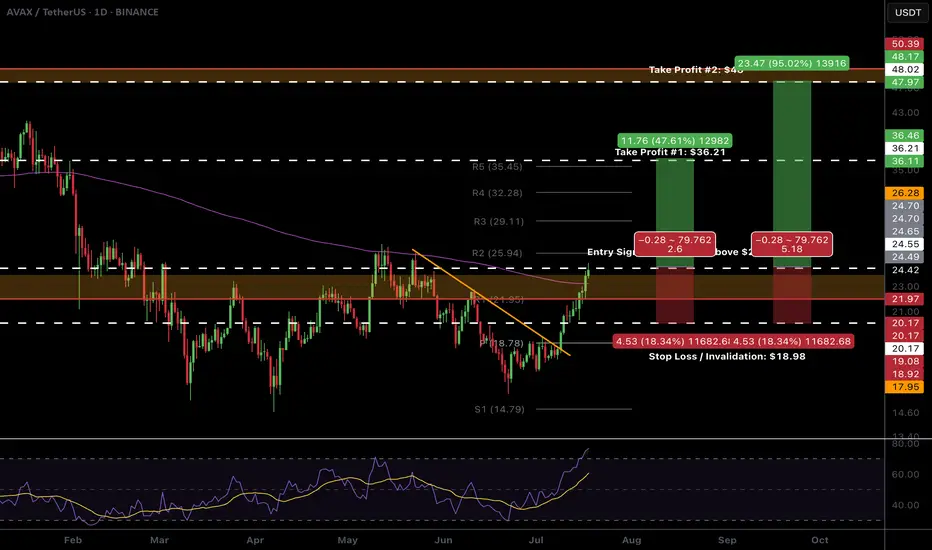
$AVAX Ready to breakout!CRYPTOCAP:AVAX looks ready to pop.
High Volume Node resistance and daily 200EMA is clear and now support. We don't want to see price rejected and moving back below this area.
The R5 daily pivot is my first partial take profit $35-36 followed by the major resistance High Volume Node at $48
Daily RSI is overbought with unconfirmed bearish divergence so watch out for this but should be good to run in the mean time. BTC permitting...
Safe trading
/3.5 The Winner's Psychology & The Hunt for Trade
Introduction: The Dangerous Time of Euphoria
I want to start by thanking you for the phenomenal support for the "Altseason: Live" experiment. We closed Round 1 with a +92% profit on the initial capital from just two trades.
But I need to be brutally honest with you: the most dangerous time is just beginning. Let's be clear: for these two months, I won't be chasing a conservative 3% per month. I will be trading quite aggressively.
That's why, in the coming weeks, you will see various coins "pump" without any logic. Your inner FOMO will be screaming at you: the feeling that you're late, you're in the wrong coin, you've missed out. In this frenzy, many will jump on a moving train. And my forecast remains: sometime around July 17th to 21st, the market will brutally shake out these passengers.
My Philosophy: The Battle with the Main Enemy—My Own Euphoria
After a huge win like +92% on the portfolio, it's very easy to get caught up in the "winner's high." A dangerous confidence appears, the feeling that you've figured out the market and that it will always be like this. This is a trap.
That is why I did something that might seem illogical: I cut my position size for the next trades by a factor of four.
Why? To tame that euphoria. To prove to myself that discipline is more important than elation. To remember that my win rate is not 100%, and a single losing trade on a wave of overconfidence can wipe out all the previous hard work. The most important thing is my inner calm.
Of course, when I talk about "calmness" in the context of futures, leverage, and altcoins, it sounds ridiculous. I get that. But striving for inner composure is the only shield a trader has.
My core principle remains unchanged: Fear losing more than you fear missing out on gains.
The Hunt for Leaders: My Methodology for Picking the Next Trade
Rebranding and New Tokenomics:
When a project undergoes a rebrand, it almost always means the team has a plan. The pressure from old sellers decreases, and the probability of a subsequent rally is high.
' Smart Money' Footprints (Accumulation):
This is my favorite pattern. Long periods of accumulation at certain levels, anomalous volumes, and candles with long wicks—all of this indicates that a major player has entered a position and is preparing for a breakout.
New Listings and Unique Patterns:
Projects recently listed on top exchanges don't have the "baggage" of disappointed holders. Over the years, I've noticed certain unique patterns in their charts that have a high probability of leading to growth.
The Art of the Entry: Hunting for the Entry Point
I try to enter positions with limit orders, and I always wait for a pullback. I look for an entry on a local correction when panic is shaking out the random passengers.
Hunt for your entry point. That is the most important thing.
The Golden Rule: Not a Single Step Without a Stop-Loss
Trading without a stop-loss is suicide. Accepting a small, planned loss is not a weakness but a part of the professional game.
What's Next?
I've already missed one coin I wanted to trade—it took off without me. I didn't chase it. Now, I am patiently waiting and searching for the next setup that meets ALL of my criteria.
The "Altseason: Live" experiment continues. You can watch everything in real-time on my streams. The hunt is on.
Thank you for your attention.
Best Regards EXCAVO
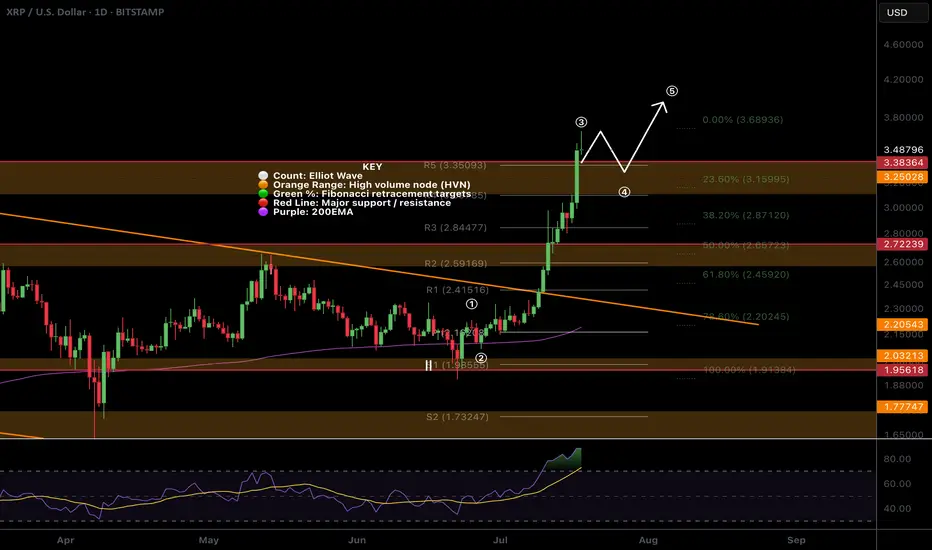
$XRP All time high! Time to sell or...?CRYPTOCAP:XRP appear to have completed wave 3 with a poke above all time high, typically this os behaviour of a wave 5.
The daily R5 pivot point has been breached so there is a significant chance of a decent pullback now but I wouldn't bet against the trend!
Wave 4 could be shallow, targeting the previous all time high, High Volume Node with waver 5 completing near $4.
Daily RSI is overbought but no bearish divergence yet which will likely emerge during wave 5.
Safe trading
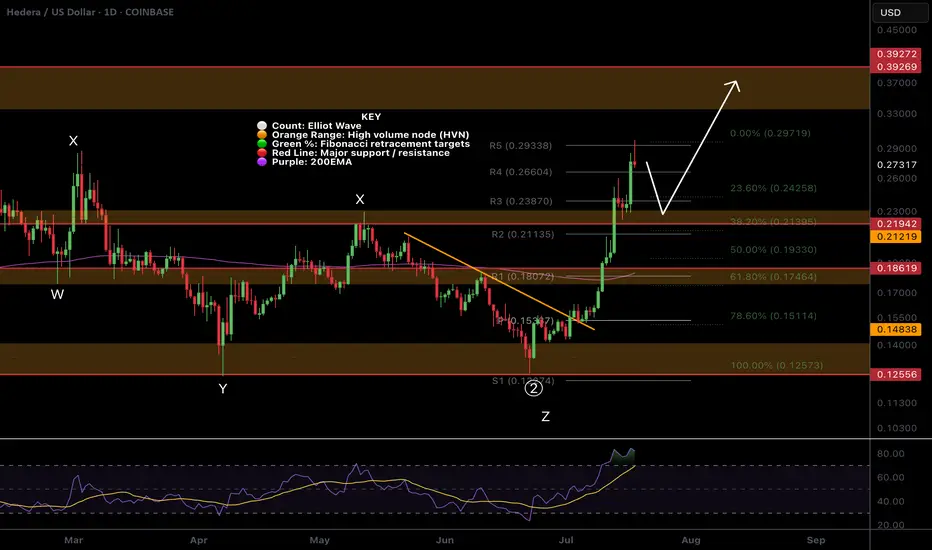
$HBAR Pull Back Started, What is the target?CRYPTOCAP:HBAR doing extremely well, the R5 daily pivot point has been hit and a pull back should be expected before continuation!
It appears wave 3 is now complete and wav4 i expected to pull back to the 0.382 Fibonacci retracement which adds confluence to the High Volume Node in the same place at $0.22 our previous take profit #2 target.
Daily RSI is overbought but no bearish divergence yet! Price behaviour can often pop above the swing high just made to trap new buyers before dumping hard! Watch out for that, that would be the bearish divergence print also.
The next take profit is $0.39
Safe trading
3/ Altseason: Live - My System: Cut Losses, Let Profits RunIntroduction: The Whole Truth About Trading
The "Altseason: Live" experiment is in full swing. Before we continue, I want to show you something important. Not just the wins, but the complete picture.
This is real trading. With big wins and unavoidable losses. And this single screenshot contains my entire philosophy.
My Core Strategy: Cut Your Losses, Let Your Profits Run
My main job as a trader comes down to two simple rules:
Hold my winning positions for as long as possible.
Cut my losing positions as quickly as possible.
Look at the screenshot again. The losing trades on SAGA (-90) and PUMP(−595) were closed fast.
The moment I realized the setup wasn't working, I got out. No hope, no emotions. This is the cost of doing business.
Now, look at MAV (+4,302) and RONIN(+3,254)
I let them run because they were following the plan. These two trades brought in +$7,556 in profit, more than covering all the small losses and securing a great overall result. This is how the system works.
The Winner's Psychology: The Battle with Euphoria
After a series like this, it's easy to get a "winner's high" and believe you're invincible. That's a trap. That's why, after the first wins, I deliberately cut my position size for the next trades by four times. To tame that euphoria and remember that discipline is more important than overconfidence.
My main principle remains : Fear losing more than you fear missing out.
The Hunt Continues: The Current Position
This system isn't a theory from the past. It's working right now. As of this moment, I have one open position in :
GETTEX:WOO , which is already showing over 2121 in unrealized profit.
I plan to manage this trade by the same rules and will likely close it within the next 1-3 days.
What's Next?
I'm not looking for dozens of trades. I'm looking for a few high-quality setups where I can apply my system. I use limit orders to enter on pullbacks, and I always use a stop-loss.
The experiment continues. You can follow it all in real-time on my streams, where I broadcast my trading terminal.
Thank you for your attention. The hunt for Trade #3 has already begun.
Best regards EXCAVO

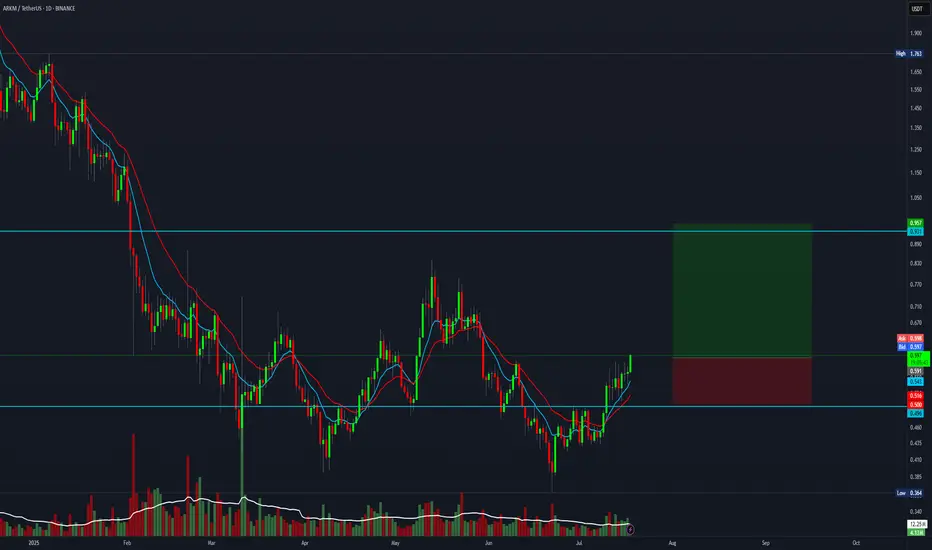
4:1 R:R trade setup for ARKMEverything is pumping right now, and this one also offers a 4:1 R:R setup.
Entry: 0.596
Stop Loss: 0.500
Target: 0.950
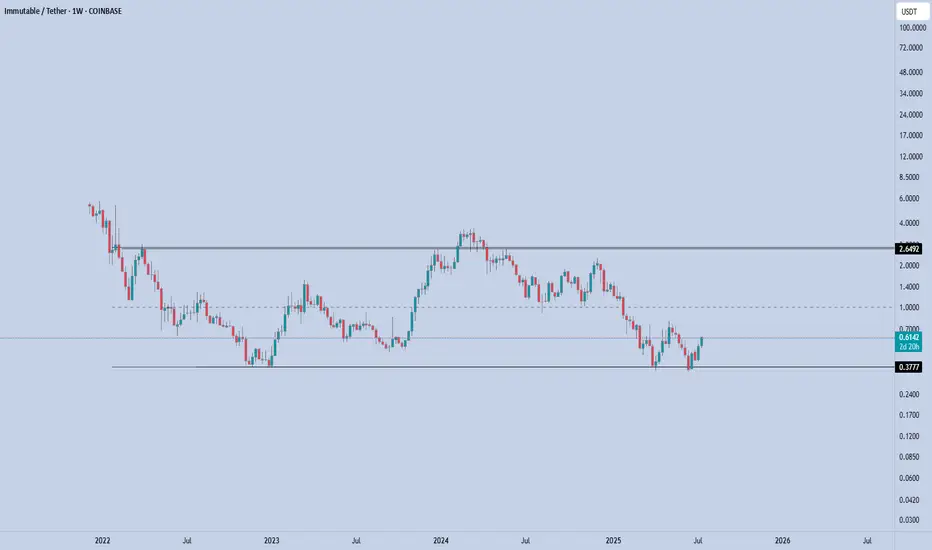
IMX – Range Low ReclaimedIMX has once again defended the $0.37–0.38 demand zone, bouncing sharply off the lows. This level has acted as a long-term accumulation base since late 2022, and price is now showing early signs of another range rotation.
Currently trading at $0.61, IMX is holding above the reclaimed support. As long as this level is maintained, the setup favors a move toward the mid-range and potentially the upper boundary of the established range.
🎯 Key Levels:
Support: $0.38 (range low & invalidation)
Mid-range: $1
Target: $2.65 (range high)
If bulls can push through the $1 mid-range resistance, the top of the range at $2.65 becomes the next magnet.
📌 Risk Management:
$0.38 is the line in the sand. A close below this level breaks the structure and invalidates the setup.
Altcoin Market Structure Outlook | ETH/BTC Rotation AnalysisThis chart outlines a cyclical framework I'm using to anticipate a potential bottom in altcoins heading into Q4. Currently, ETH is outperforming BTC, and altcoins are following its momentum - though many continue to make lower lows relative to ETH.D but as long as eth rallies I see Alts keeping up.
Historically, we've seen altcoin capitulation phases follow a two-stage structure: an initial local bottom in June/July, followed by a final sweep or structural low into October (Q4), as observed in both 2023 and 2024. Given this repeating seasonal pattern, I expect ETH to potentially retrace against BTC in Q4 making a higher low, which could set the stage for altcoins to make a lower low and retest their key range lows — particularly near the 0.25 ETH/BTC level.
Should ETH maintain a higher low and resume trend afterward, it would likely mark a rotation point where capital begins flowing into higher-beta altcoins. Coupled with potential macro tailwinds like rate cuts or dovish policy pivots, this scenario could trigger a strong altcoin rally from Q4 into Q1.
This chart aims to visualize that rotational capital flow and position sizing opportunity across the cycle.
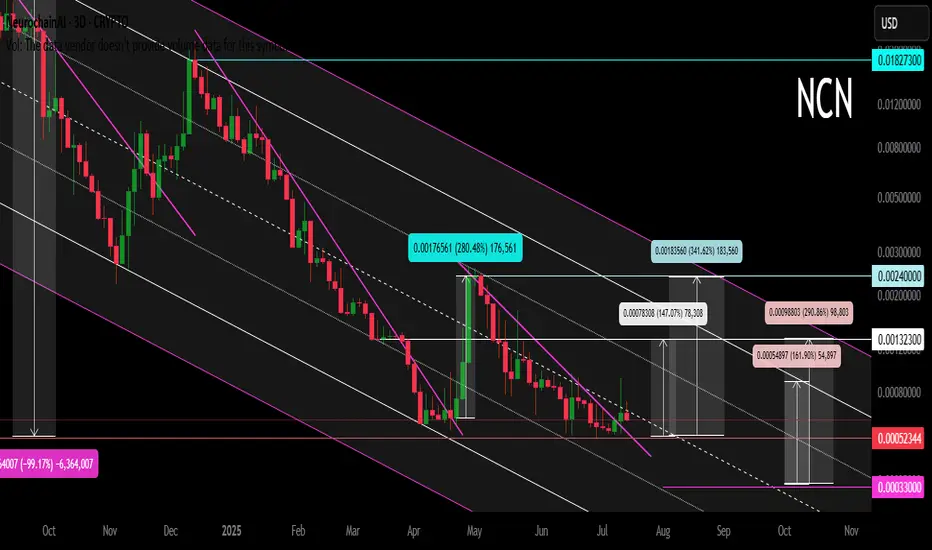
NCN (Neurochain AI) Main Trend 18 07 2025Logarithm. 3 days. Crypto project (imitation of utility) was made in autumn 2024 for local AI hype. Twitter 102 thousand subscribers. This is not enough... Reduction from the maximum pumping by -99%. It is rational to work according to the pump/dump strategy, in spot.
If a local alt season is launched, then I would recommend locally - medium urgently working with the % range (maximum) specified in the idea itself. This crypto imitation of usefulness is unlikely to survive until the big AI hype....
Currently, there are trades on 2 exchanges:
1) Gate
2) MEXC
For this group of assets as a whole. Collect assets where AI is at least somehow actually used (there are none of those), or are simply mentioned for hype (imitation of usefulness). Some assets will "die", most, if you hold them, will show a greater profit than assets of other groups.
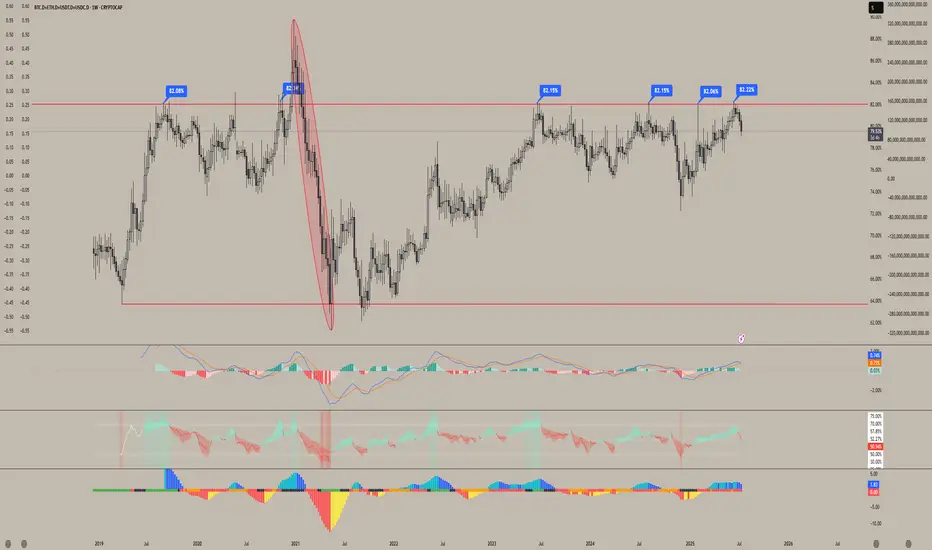
ETH relative to AltcoinsI fee like at this current point as we see altcoin pairs bleed against ETH and BTC while putting in lower lows while Eth puts in higher highs we will not see the altseason we are hoping for until altcoin pairs hit here range lows which I can see happen end of Q3 into the start of Q4 but until then they can still rise as ETH.D continues its rally but I feel until altcoins reach its range lows being the .25 lvl on (TOTAL3-USDT)/BTC we will not see that face melting rally we are looking for.

When will Altseason start?So with ETH.D sweeping its all time low I feel very confident that eth has made the low for this cycle as well as BTC.D retracing providing further confluence that this is the case and we will see eth start to outperform bitcoin but I begun to question where altcoins stand currently stand and when we will start to see them outperform both BTC and ETH as they currently bleed to them as Both ETH and BTC make higher lows while altcoin pairs are making lower lows. I feel like until we see a run above this trend line above the .82 lvl we will see altcoins bleed against ETH and BTC.
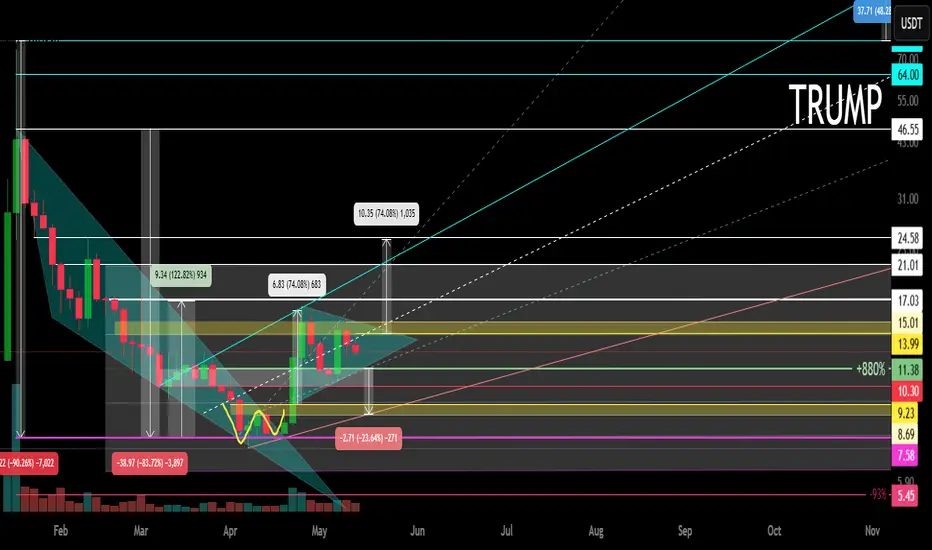
OFFICIAL TRUMP Main trend. 16 05 2025Logarithm. Time frame 3 days. After a super pump and a drive of "stupid money", a descending channel was formed on a natural dump. The price came out of it. Now a triangle is forming. The price is clamped. The reversal zones and percentages to the key support/resistance levels are shown extremely accurately according to TA.
If there is no aggressive exit in the medium term, then there will be consolidation and, as a consequence, the formation of a horizontal channel "sholtai / chattai", its key zones are shown.
Now, this "cryptocurrency" is now on 16 05 2025 in 41st place by capitalization.
Reductions from the price highs are about -90%.
From the liquid zone about -84%.
These are not the minimum values of the decline of such hype cryptocurrencies. Just take this into account in your money management. For clarity, the level zones and the % of potential decline if the trend breaks again are shown on the chart (pull the chart down).
Even with such a decline, the price is now at a huge profit. I am not speaking for the creators of the cryptocurrency, but for the first speculators and "investors" who may not have sold everything on the hype.
For the creators of the cryptocurrency, perhaps these are manipulators close to the Trump family, for them, any sale is super profit. But in order to sell, you need to maintain liquidity, and from time to time make interest in speculation and asset retention by investors, that is, do pumps and hype. Use this, and do not be greedy...
Levels and zones, pump/dump, which the price will "feel" are shown in advance. Click "play" on the chart and move the chart up. With a high degree of probability, the hype and pumping of the price of this cryptocurrency will be repeated, given the hype and the long term of the political figure whose name this cryptocurrency bears. Now it is a Trump dump, in the future it will become a Trump pump for some time.
Do not forget to sell on the next hype. If you understand that you are very greedy, and the news background affects you, then sell in parts, or use stop losses to protect profits.
There is no need to guess the minimums and maximums. It is important to know these zones, and have an acceptable average price, from the position of the trend, and its potential. It is regulated by the distributed entry volume (in advance) at potential reversal zones.
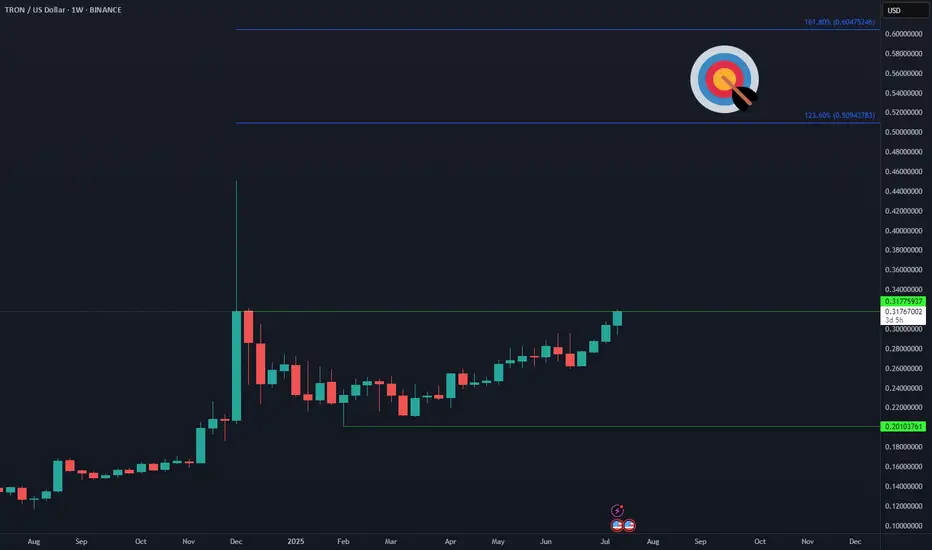
TRON TRX Eying New ATH📈 After 6 months of sideways accumulation, CRYPTOCAP:TRX is finally picking up momentum. A weekly close above $0.317 could trigger acceleration toward the next targets at $0.50–$0.60 🚀
MELANIA Main Trend. Memes with high hype and risk. July 17, 2025Main trend. Time frame 3 days (less is not necessary). Showed conditional levels (zones near them), and percentages of decrease from the maximum (note, I showed from the zone where the main retail of “affected investors” began to connect, that is, the maximum is much lower than on the chart).
Note that now a conditionally large volume “enters”, it is displayed on the price chart (this is important), a sideways squeeze has begun. Local impulse and rollback are now in the moment.
Also showed a large % (intentionally) for orientation, from minimum to maximum zones. On such hype assets, as a rule, medium-term - long-term holding (bought in the right zone) shows significant income.
All level zones are conditional, due to liquidity, but the price will most likely “play” after the breakdown of the downward trend in this range, another alt season (which many do not notice due to the slow breakdown of their opinions, news chaff, and inadequate goals). As for me, above these huge % (resistance zone, or up to 0.869, so as not to waste time), you should get rid of this meme, or its % from the previous position should already be minimal (5-10%).
There are hype zones, there are zones of potential gain (fading hype, interest, and a large % from the maximums). On such assets of "manual trading", where cryptocurrency has no value, it is always sold little by little (many do not understand this), but in order to sell, you sometimes need to make interest, and "instill hope" in previously deceived "investors" who want to get out at least at a loss (it is unlikely to happen). At the right time, 1-2 tweets - statements from the "powers that be" - are pumped up due to low liquidity by a huge percentage.
On such cryptocurrencies, you do not need to guess the “bottom” or maximums. Pricing is formed differently here, as there is no real supply/demand, utility, but only psychology and "hitting the jackpot" of gambling addicts. Be smarter. Diversify such assets, distribute the risk in advance. Make purchases/sales according to plan, without emotions.
When the price goes up, you think it will go much higher, but even if it does, you must sell a certain volume in certain planned zones, without any emotions or sense of lost profit.
Similarly, when the price goes down, people are driven by fear and refuse to buy, and these were probably the minimums of fear.
The average price of the set and reset is important. No minimums and maximums are needed. Be patient and consistent in your actions and plans.

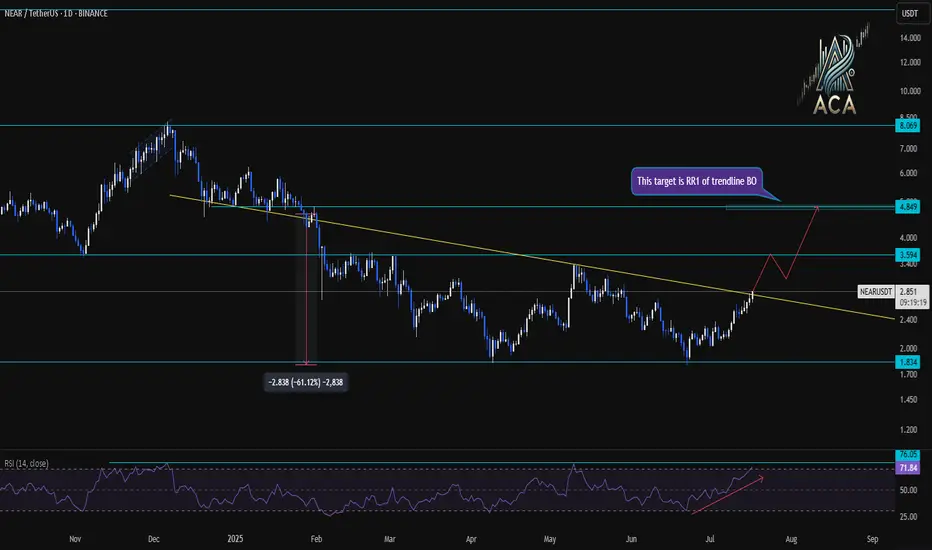
NEARUSDT Daily Chart Analysis|Strong Breakout & RSI ConfirmationNEARUSDT Daily Chart Analysis | Strong Breakout & RSI Confirmation
🔍 Let’s break down the latest NEAR/USDT daily chart, spotlighting critical resistance, target levels, and momentum signals.
⏳ Daily Overview
NEAR has confirmed a bullish breakout above its long-term descending trendline. This move comes with a surge in price and a strong daily candle—clear evidence of renewed bullish momentum.
📊 Momentum & RSI
RSI has surged to 76 (overbought zone), higher than the typical overbought level of 70. This spike reflects strong buying pressure, but also signals the possibility of near-term pullback or consolidation.
RSI-Momentum Convergence: The RSI uptrend is in lockstep with price action, confirming that bullish momentum is genuine and backed by increasing strength—not a divergence.
🔑 Key Levels
- First Resistance: $3.59—watch this closely as the next hurdle for bulls.
- Breakout Target: $4.85, which corresponds to the measured move (RR1) from the trendline breakout and aligns with the next horizontal resistance.
- Extension Target: $8.01 if momentum persists and price sustains above $4.85 in the coming weeks.
📌 Highlights
- Clear trendline breakout validated by strong RSI convergence.
- RSI has entered the overbought zone (76), backing momentum—watch for either breakout follow-through or brief cooling.
- Key levels: $3.59 (first resistance), $4.85 (breakout target).
🚨 Conclusion
Momentum is with the bulls after the breakout. Eyes on $3.59 as the near-term test; a clean move above opens up $4.85 and potentially $8.01 if momentum continues.