HolderStat┆SOLUSD above the $160 levelBINANCE:SOLUSDT has cleared key resistance at $159.78 after a series of consolidation patterns. The breakout has followed through into an ascending channel aiming at $185. Price remains structurally bullish with higher lows and strong recovery setups.
Altseason

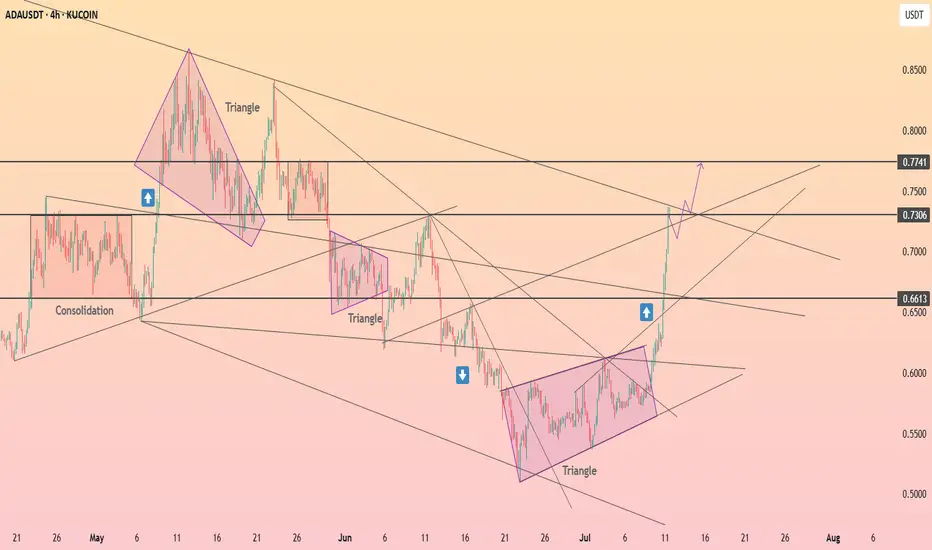
HolderStat┆ADAUSD seeks to $0.774KUCOIN:ADAUSDT recently broke out of a multi-week triangle formation on the 4H chart. The clean break above 0.66 has invalidated the previous downtrend and triggered a new leg higher. With ADA currently riding within an ascending channel, the path toward 0.73–0.75 remains open as momentum continues building.
$XRP All Tie High After Shallow Pullback?CRYPTOCAP:XRP had a fantastic week smashing all resistances. I am looking for a shallow pull back to test the High Volume Node support at $2.7 at the .236 Fibonacci retracement before continuing to challenge the all time high.
Wave (3) of a motif wave appears complete adding confluence to a shallow retracement for wave (4).
Daily RSI is extremely overbought.
Safe trading

$HBAR Weekly Pivot Time...In classic CRYPTOCAP:HBAR fashion what a powerful move this week! Moves like this leave me skeptical of continuation straight away as you often get a pretty decent pullback afterwards before the next leg up. However how many times have you seen a move like this that completely unwinds weeks later and goes lower?
Wave (3) looks truly underway after wave (2) tested the High Volume Node and 'Golden Pocket' 0.50.618 Fibonacci retracement as support on weekly bullish divergence from the RSI.
The weekly pivot is now resistance and it already proving itself. If price continues the all time high is next resistance and price has a weekly R5 pivot target of $1.2 while the Fibonacci extension targets have a minimum of $5.2..
Analysis is invalidated below $0.12
Safe trading

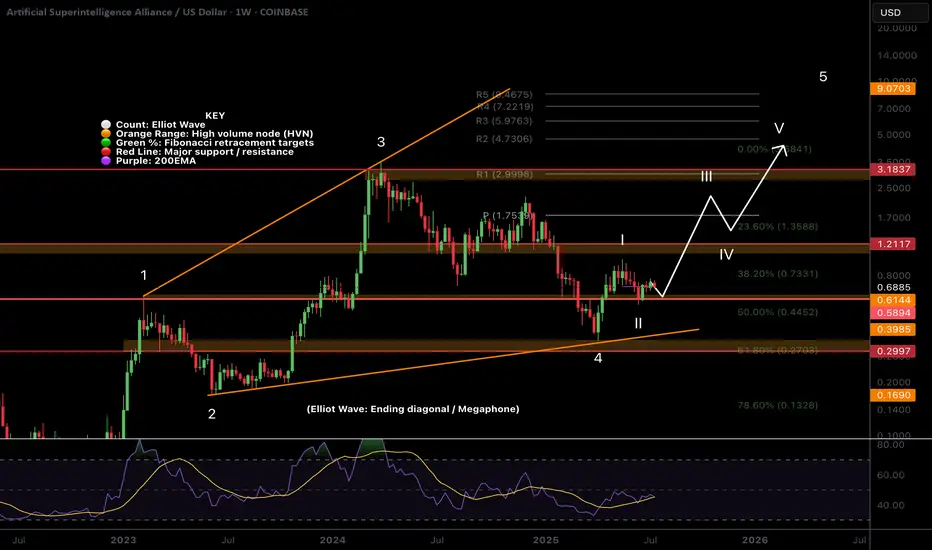
$FET Does Zooming out look better?NYSE:FET has been underperforming lately and the local chart looks trash so I wanted to zoom out to give us all some context on the larger picture which hasn't really changed.
Price appears to have completed wave II at the High Volume Node (HVN) support and 0.5- 0.618 'Golden Pocket' Fibonacci retracement and wave 3 is underway but finding local resistance.
Pivots are warped due to the strength of the move last year so wouldn't count them as reliable so focusing on support and resistance. The megaphone pattern is clear and the next area of resistance when FET starts moving is the $1.2
Weekly RSI is decreasing and is attempting to cross bearishly. If Bitcoin has a significant pullback I would expect new lows for FET at this rate. I have a neutral stance at this point.
Analysis is invalidated below $0.546
Safe trading
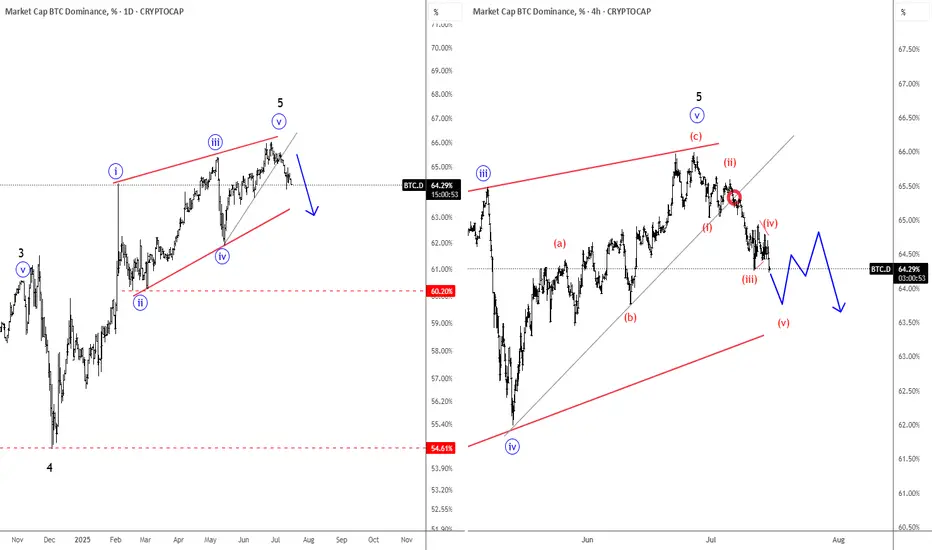
Bitcoin Dominance Found The Top; ALTcoin Dominance Stepping InHello Crypto traders! BTC.Dominance is falling in an impulsive fashion after we spotted the top within the wedge pattern. Now that is trading in wave (v) of a five-wave impulse from the highs, it just confirms a bearish reversal, which indicates that ALTcoin dominance is stepping in. And with still bullish Crypto market, we might be in the ALTseason.
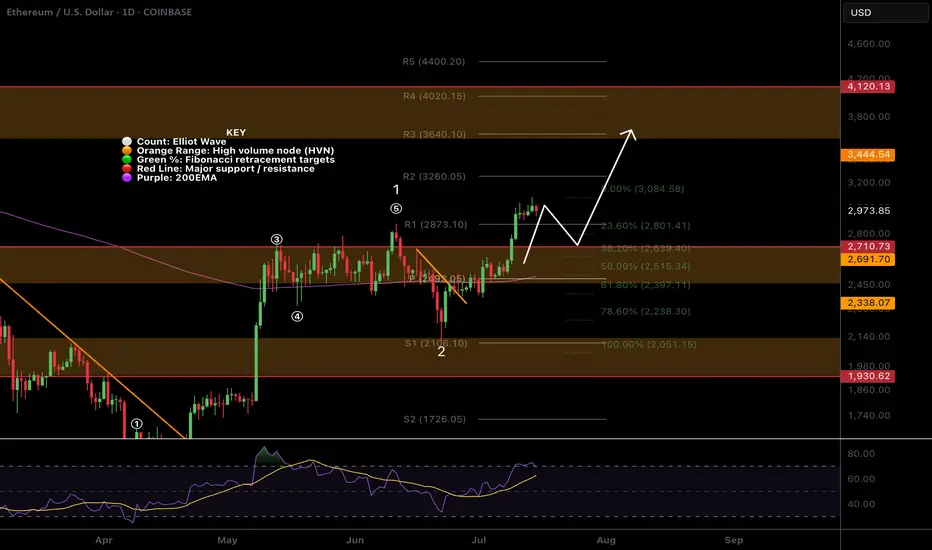
$ETH Pullback to $2630 Support?CRYPTOCAP:ETH has a great week pushing through resistance and making new local highs after testing the daily 200EMA and daily pivot as support.
Price is likely to retest the swing high and previous resistance as support around $2600-2700, also the .382 Fibonacci retracement.
RSI is printing daily bearish divergence in overbought from the wave (3) top to current as it did at the wave (5) top seeing large rejection. The retest of $2600 would reset RSI.
Price is ultimately set to test $3600 as the next resistance if the Elliot wave count is correct.
Analysis is invalidated below $2050
Safe trading
$AAVE Macro outlook Grinding the PathCRYPTOCAP:AAVE continues to grind higher poking above the swing high which was rejected to test the weekly pivot and .382 Fibonacci retracement as support successfully. This was a shallow wave 2 so I am expecting a big thrust up in wave 3. However, the alternative count could suggest a wave is only completing now with wave 2 actually being wave (4) of 1, this would be the case if price falls back below $171.
Weekly RSI is still bullish with plenty of room to rise ahead of it. It printed a weekly bullish divergence at the wave II low and major support high volume node.
AAVE is definitely one too watch this cycle.
Safe trading

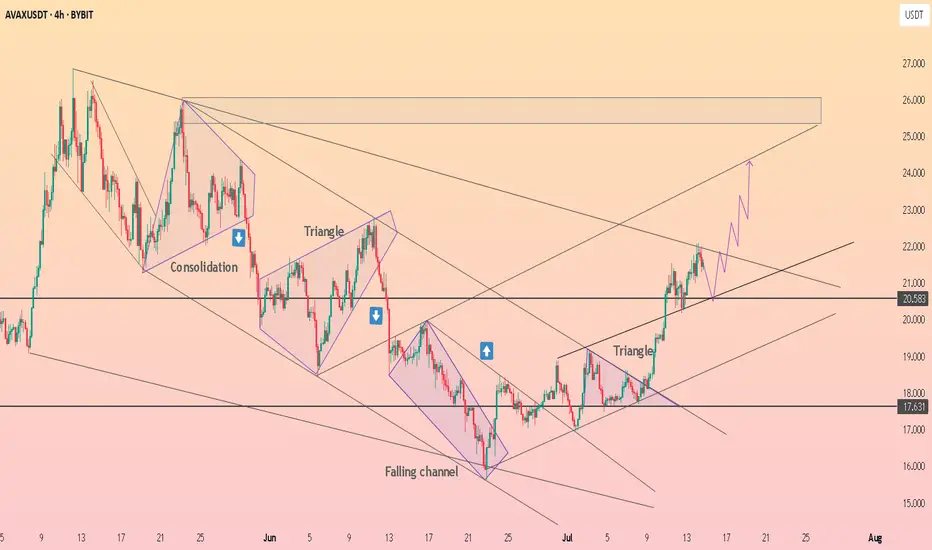
An 8.8:1 risk-to-reward trade setup for AVAX.A small pullback is likely at this point. This setup offers an 8.8:1 risk-to-reward ratio with a target of 50.
Entry at 20.8,
Stop loss at 17.50
Target at 50.

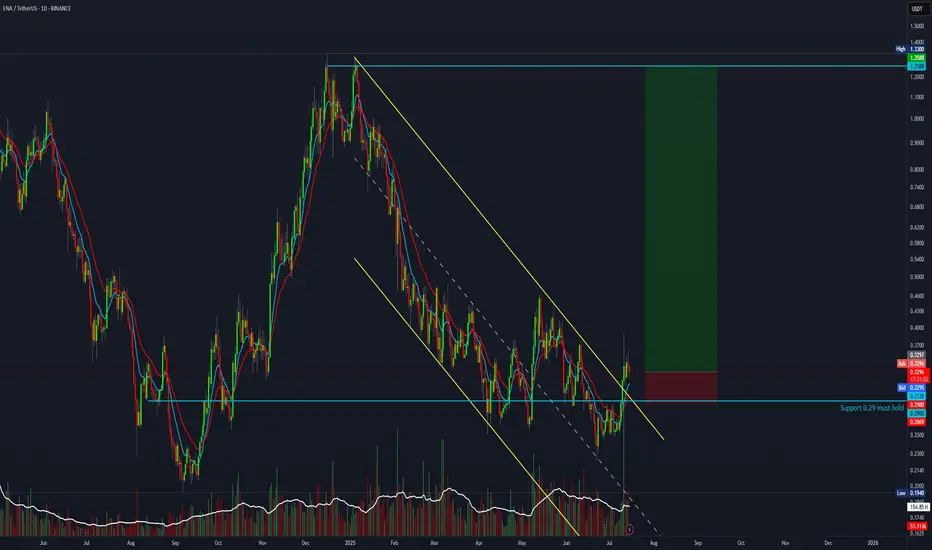
21:1 risk-to-reward trade setup for EthenaIs it time for the bulls to push it higher? This setup offers a 21:1 risk-to-reward ratio with a target of 1.25.
Entry 0.32
Stop loss 0.25
Target 1.25
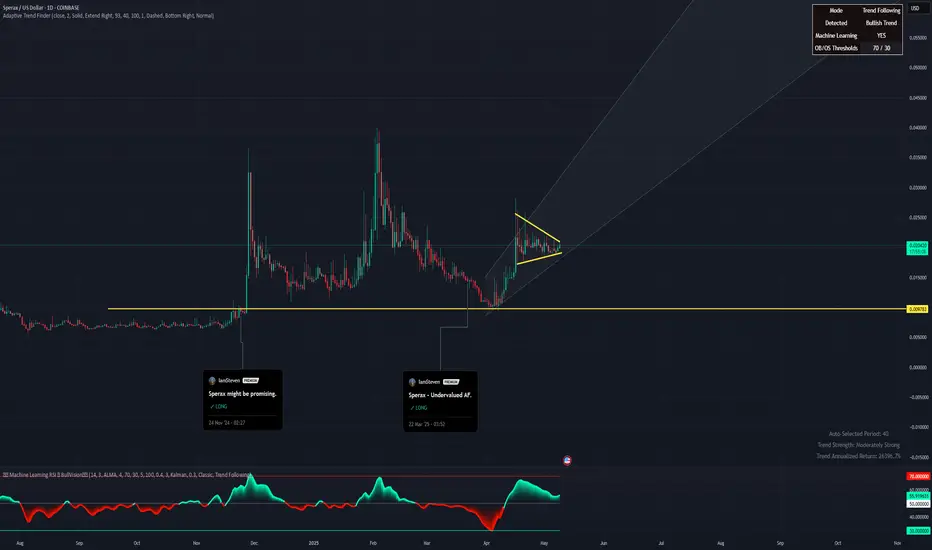
Sperax: Bullish pennant.Sperax is consolidating in a bullish pennant pattern after a strong recovery rally off the March lows. Price action has tightened between ascending support and descending resistance, forming a textbook continuation setup. Volume has decreased during this compression, which is often a precursor to explosive movement.
Fundamental Catalysts (Despite GENIUS Act Stalling):
Retail DeFi Narrative is Still Alive – While the GENIUS Act failed in the Senate, the momentum for regulatory clarity in the DeFi space continues. Future bills or executive actions could unlock capital flows to protocols like Sperax.
Deflationary Pressure —Over 13% of the total SPA supply has been burned, with more tokens locked and lost. The actual circulating supply is meaningfully lower than the total supply shown on aggregators.
SIP-70 has been passed , shifting SPA emissions from an automatic release model to a DAO-controlled emission schedule. This marks a significant milestone towards sustainable tokenomics and the preservation of long-term value.
Long-Term Accumulation – Wallet data and order books suggest that whales and long-term holders quietly accumulate during this sideways range.
Sperax remains a low-cap token with outsized potential in the next altseason if it secures even one meaningful partnership or fiat on-ramp.
HolderStat┆AVAXUSD retest of trend lineBYBIT:AVAXUSDT has climbed steadily through a falling channel breakout and now trades firmly above $20.50. With triangle breakouts behind it, the next likely zone is $24–$25. Price action is aligning with bullish continuation patterns.
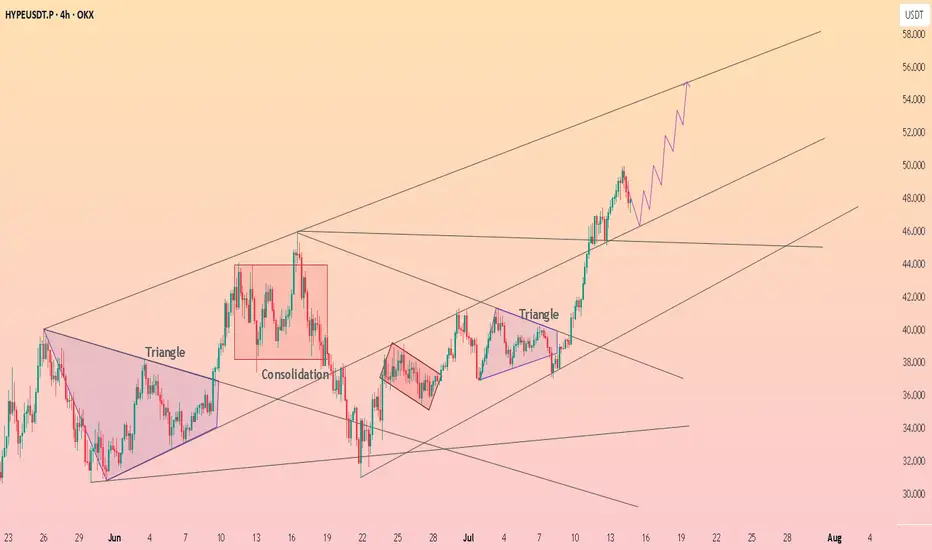
HolderStat┆HYPEUSD has consolidated above the trend line$OKX:HYPEUSDT surged after a breakout from a well-formed triangle and a bullish retest of prior resistance. The chart shows a textbook ascending channel with the price climbing from $38 toward the $56 upper range. If momentum remains, a breakout beyond the top boundary is likely.
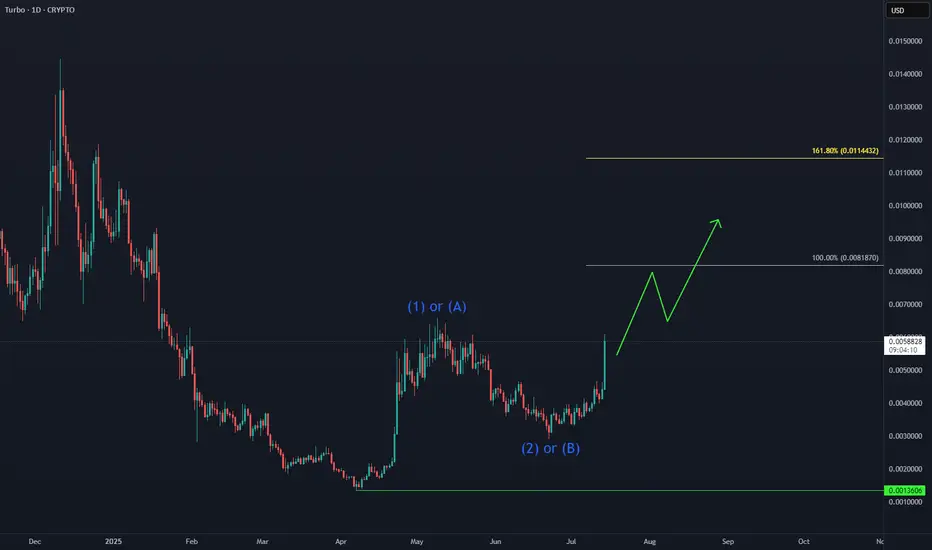
TURBO: Next Leg Higher in Progress📈 CRYPTO:TURBOUSD is building momentum after holding key support levels, with Elliott Wave projections pointing toward the equal legs target zone at $0.008–$0.011. The recent bullish structure suggests continuation, especially following its Binance US listing and strong community backing.
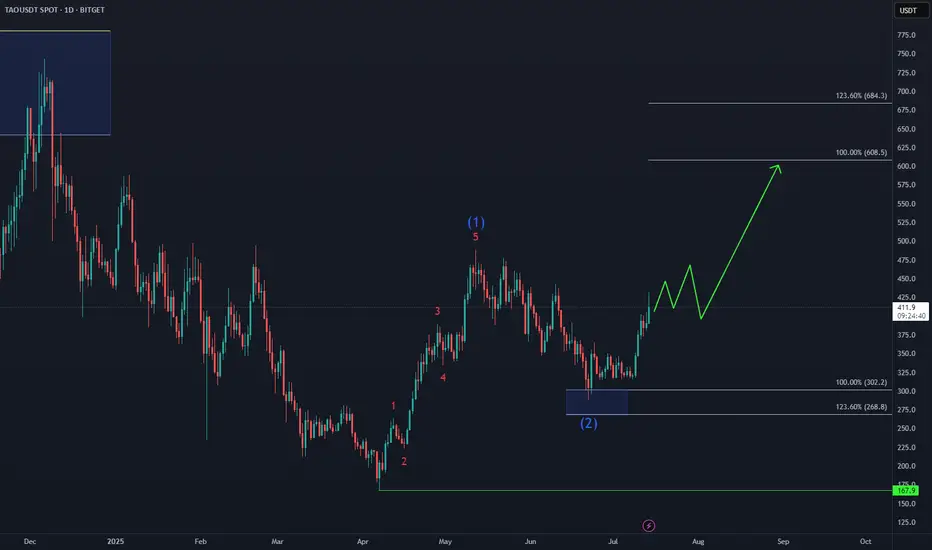
Bittensor TAO Eyes Next Upside Target📈 BINANCE:TAOUSD attracted strong demand in the Blue Box buying zone at $302–$214, triggering the next bullish leg.
Elliott Wave projections now point toward a move into the $608–$684 target area, supported by impulsive structure and rising momentum.
As long as price holds above the recent low, the bullish sequence remains intact.
BNB Aiming for New All-Time Highs📈 After breaking above the May peak, CRYPTOCAP:BNB has activated a bullish sequence, with the equal legs target zone projected at $782–$824. This aligns with Elliott Wave extensions and confirms strong momentum from the June lows.

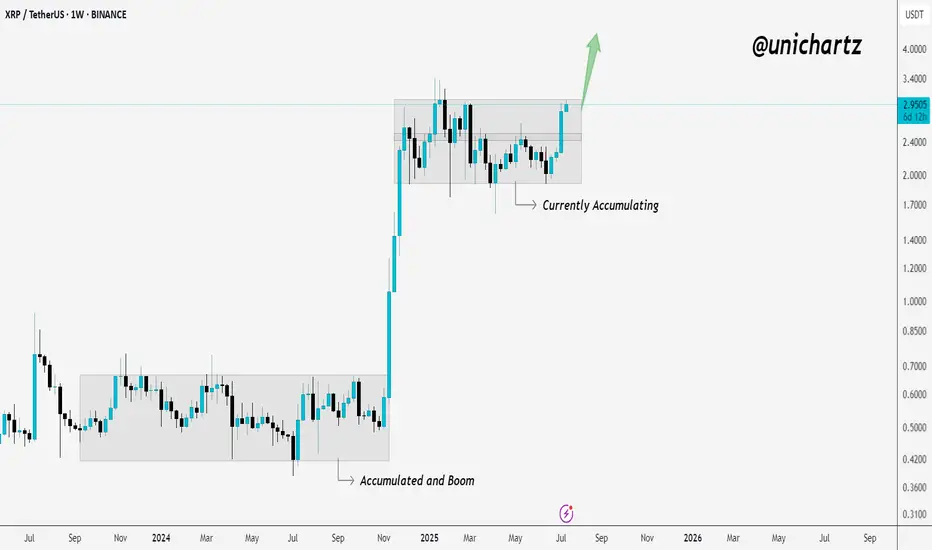
Accumulation Ending? XRP Showing Signs of BreakoutXRP is in the process of breaking out of its weekly accumulation range.
The last time we saw this kind of structure — it led to a massive move.
Now, price is pushing toward the top of the zone again… and momentum is picking up.
If it closes strong above this level, it could trigger the next big leg higher.
Stay alert — this could be the start of something big!
FET/USDT – Head & Shoulders Breakout!Hey Traders — if you're into high-conviction setups with real momentum, this one’s for you.
ONDO is trading inside a falling wedge on the daily chart — a classic bullish structure that often leads to explosive breakouts. 📈
FET just broke out of a classic inverse head & shoulders pattern — a strong bullish reversal structure! The breakout looks clean with a confirmed close above the neckline and volume starting to pick up.
💼 Entry: CMP ($0.75)
🎯 Targets: $0.85 / $0.95 / $1.09
🛑 Stop-loss: $0.705
📈 Risk-Reward: Favorable
🧠 Why it matters:
Clean breakout above resistance
Strong trend reversal structure
Potential for 40%+ move ahead.
💬 Are you in this breakout play or watching from the sidelines? Let’s talk below!
👉 Smash that LIKE and FOLLOW for more real-time setups!

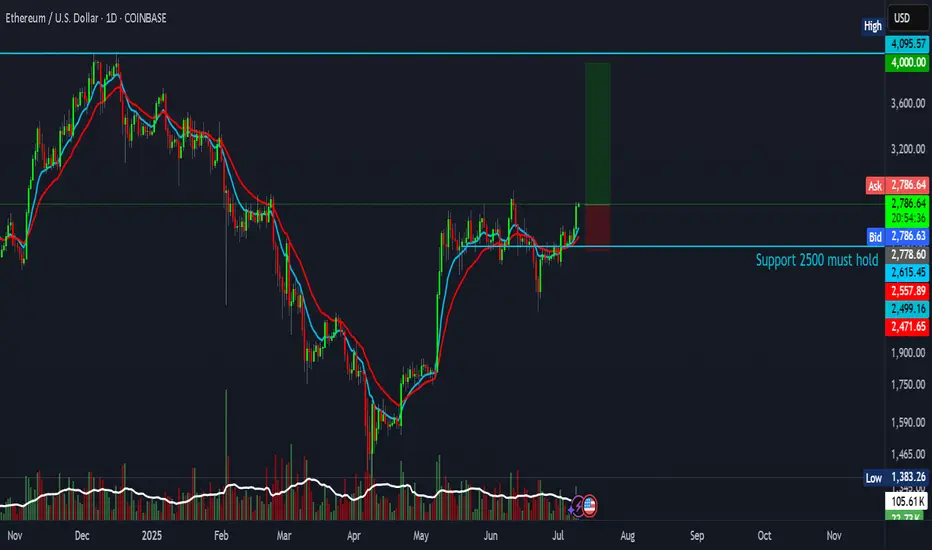
Ethereum trade setup with a 4:1 risk-reward ratioAnother attempt — and this one could be the real breakout.
This setup offers a 4:1 risk-reward ratio, targeting $4,000.
Entry: $2,780
Stop Loss: $2,471
Target: $4,000
Not financial advice.
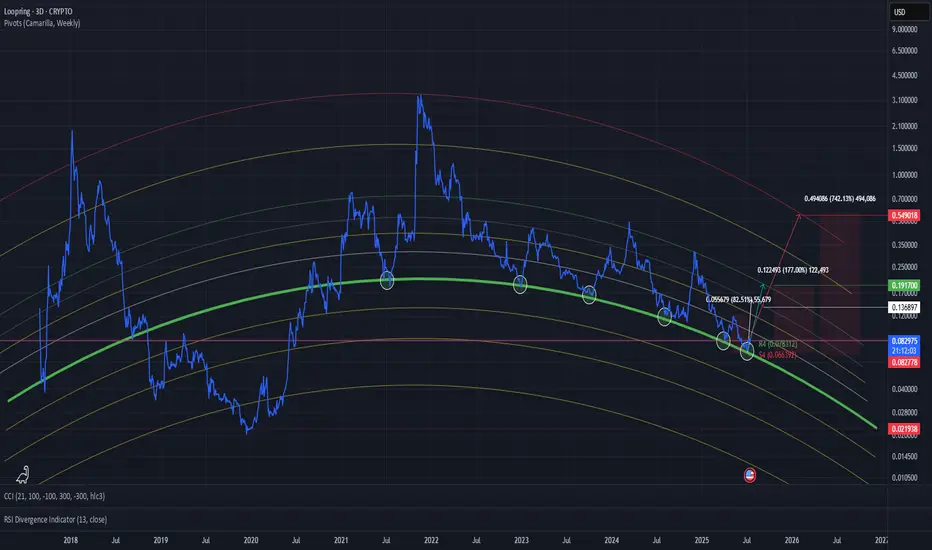
LRC/USDTI’m not sure if there’s a specific method of analysis for this, but it’s clear how precisely the coin reacts to these levels.
That’s why I dare to assume we won’t go any lower.
The green line has consistently acted as a strong support — almost like a trampoline that price bounces off.
All realistic and objective targets are already marked on the chart.
Additionally, the weekly Camarilla Pivot is showing significant strength right now, which adds further bullish confluence.
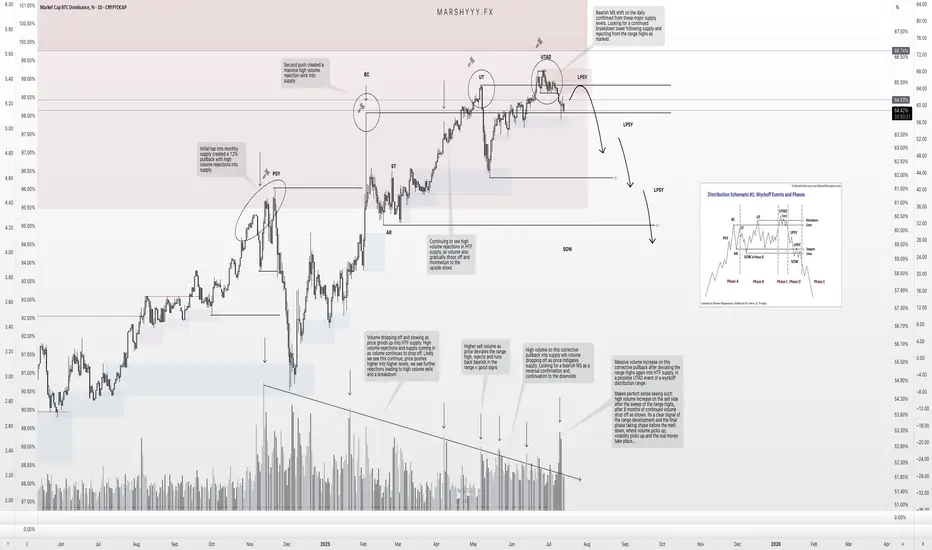
BTC.D – Distribution Confirmed. Is the Final Altseason Next?Over the past couple of months, I’ve been tracking the development of a potential high time frame (HTF) Wyckoff distribution range forming on BTC Dominance (BTC.D), and it’s now looking like that structure is starting to break down.
Back on June 14th, I noted that while we hadn’t confirmed a trend shift yet, BTC.D was showing strength and likely to push into the 65% region, with altcoin weakness to follow. The very next day, I shared my idea of a potential Wyckoff distribution forming — and since then, it’s followed that path almost perfectly.
🧠 What’s Happened Since?
✅ Sweep of the HTF range high at ~65%
✅ Second deviation of the highs
✅ Volume divergence into supply — declining volume + strong rejection candles
✅ Formation of a UTAD (Upthrust After Distribution)
✅ 1D bearish market structure break after the sweep
✅ Price now back inside the range
This is textbook distribution behaviour — even if it doesn’t follow the Wyckoff schematic to the letter, the key elements are present: deviation, volume drop-off, and structural breakdown.
🔮 What Comes Next?
BTC.D is currently holding inside a prior unmitigated daily demand, but given the structural shift, I’m expecting:
A pullback to 65–65.5% (daily supply + range high retest)
Then a continuation bearish, targeting:
🔸 49% (prior accumulation range high)
🔻 46% (FVG fill + range breakout retest)
These lower targets align with where I expect altcoins to top out — so as BTC.D breaks down, I expect capital to rotate hard into ETH and alts, triggering the final phase of altseason before the macro cycle top.
⚠️ Why This Matters
This distribution range has been developing since late 2024, and with BTC.D now showing bearish market structure, combined with:
- ETH.D flipping bullish
- OTHERS.D pushing higher
- Stablecoin dominance pairs breaking down
…we’re seeing confluence across the board for a risk-on altcoin environment.
I believe this is the setup that leads to the final euphoric altcoin rotation before the 4-year cycle top prints later this year.
📌 Watch for the retest. Watch for the rejection. The breakdown will be fast.
This is the window — time to stay sharp.
Let me know in the comments if you’ve been tracking this too, or drop your altcoin rotation picks.
— Marshy 🔥
1D:
3D:
1W:
1M:
PENGU = ETF Catalyst + Whale Accumulation = +30% More Upside?Today, on the weekend, I want to analyze the Pudgy Penguins project with the PENGU ( BINANCE:PENGUUSDT ) token from a fundamental and technical perspective .
Please stay with me.
Why did PENGU surge nearly 40% in just 48 hours? Here’s what’s driving it:
------------------------------------------
Fundamental Analysis:
1. ETF Momentum via Cboe:
On June 26, Cboe officially filed a 19b-4 form for a new ETF that includes Pudgy Penguins and PENGU as major components.
Although not yet approved, this single move has fueled strong institutional anticipation, similar to what happened with Bitcoin ETFs in early 2023.
The market often prices in future narratives — and this ETF storyline has been a powerful one.
2.Whale Accumulation Signals
According to Nansen data, large holders have increased their balances by 11.37%, and notable wallets linked to public figures by 7% over the last 30 days.
Such coordinated accumulation often precedes major price moves, and that pattern seems to be repeating here.
3.NFT Ecosystem Boost
The Pudgy Penguins NFT collection saw a 400%+ surge in sales volume.
This sharp increase in NFT activity has reignited attention toward the broader Pudgy ecosystem, which naturally benefits its native token, PENGU.
Risk Note:
The ETF is not yet approved — we're still in the hype phase.
Volatility remains high, and strong pullbacks are common in low-liquidity tokens like PENGU.
If whale activity continues and institutional narratives grow, the upside potential remains — but so does the downside risk.
------------------------------------------
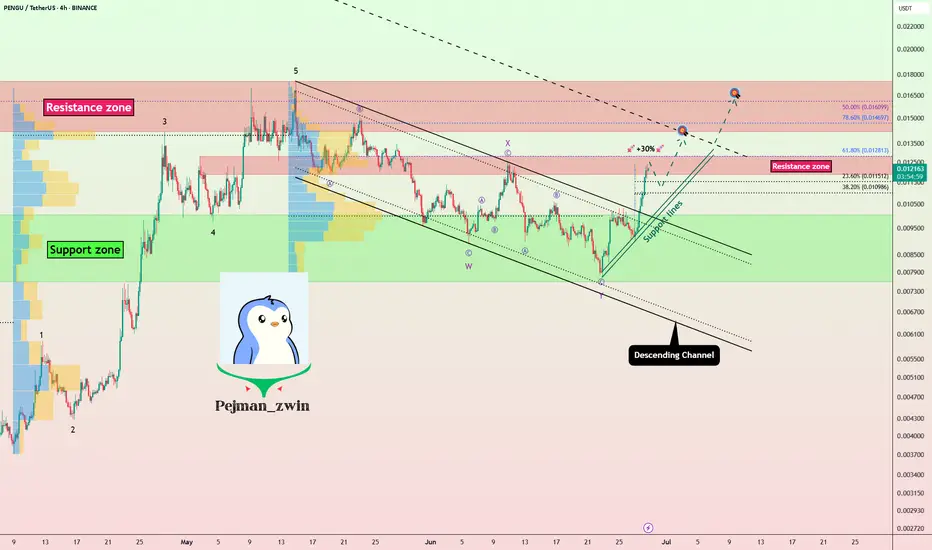
PENGU token started to rise from the Support zone($0.01-$0.0076) . One of the signs of a continuation of the uptrend was the break of the upper line of the descending channel .
Educational Note: One of the price targets after a channel break can be as wide as the width of the broken channel.
In terms of Elliott Wave theory , it seems that the PENGU token has completed the Double Three Correction(WXY) , and we can wait for the next impulsive waves .
I expect the PENGU token to attack the Resistance zone($0.0128-$0.0118) again, and if this zone is broken , it can increase to at least $0.0137(+30%) .
What is your idea about the Pudgy Penguins project?
Note: If the PENGU token drops below $0.01, we can expect a break of the Support zone($0.01-$0.0076).
Please respect each other's ideas and express them politely if you agree or disagree.
Pudgy Penguins Analyze (PENGUUSDT), 4-hour time frame.
Be sure to follow the updated ideas.
Do not forget to put a Stop loss for your positions (For every position you want to open).
Please follow your strategy and updates; this is just my Idea, and I will gladly see your ideas in this post.
Please do not forget the ✅' like '✅ button 🙏😊 & Share it with your friends; thanks, and Trade safe.
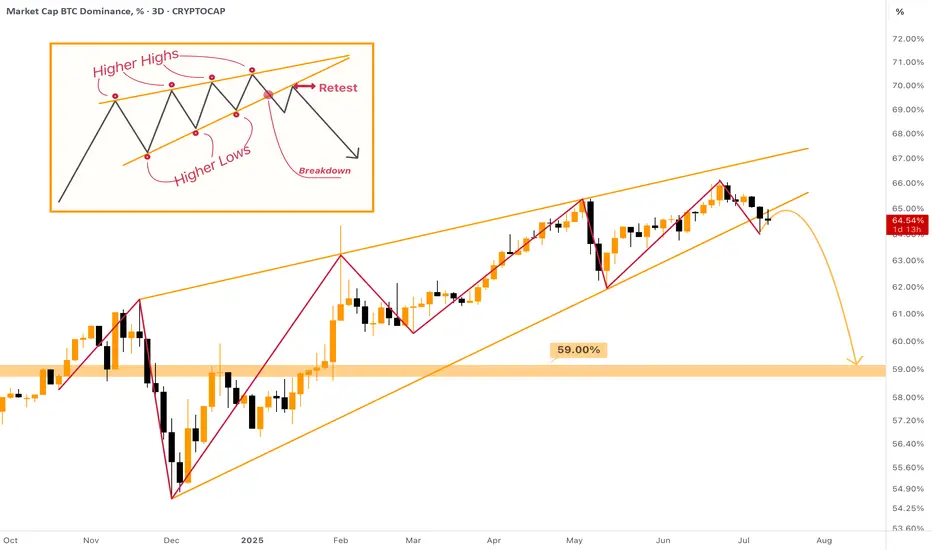
Rising Wedge on Bitcoin Dominance - [BROKEN DOWNWARDS] The MASSIVE Rising Wedge on Bitcoin Dominance was broken downwards during the past week, most likely the 1W candle will also close below the support of the wedge.
What does it mean? The dominance will dump from 64% to at least 59%. This move can already provide us with the huge Altcoin Season! After this there more likely be a small correction towards 60%, and then we can freely dump further towards 54% zone.
I expect not only small cap, but major altcoins to be sent to new highs as well. Mark my words & be prepared for the last opportunity of this bull cycle!