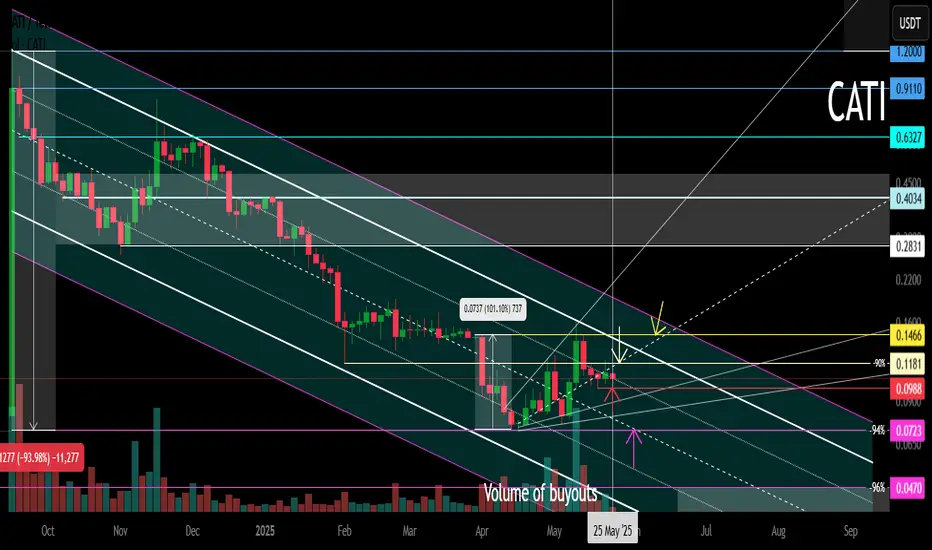
CATI Memcoin. Main (essentially secondary) trend. Channel. 25 05Logarithm. Time frame 3 days (less is not necessary). Decline from the maximum -94%. As a rule, altcoins (ticker name, legend, imitation of usefulness does not matter) of such liquidity decline in their secondary trend until its reversal by -95-98%.
But, at the moment, there is a significant increase in volume, this is a good sign, if the price goes beyond the resistance of the descending channel, then a trend expanding triangle will form, or as it is also called the Livermore cylinder (dynamic zones of support / resistance of the "participation" phase).
In order not to miss the reversal, if you are afraid to gain a position now, then work with orders for a breakthrough, that is, a trend break.
🟣For 2 months now, a sideways trend with a 100% step, the price is being pulled to the resistance of the descending channel.
Breakthrough of it — trend reversal.
Not a breakthrough , decline to the next "shelf".
Everything is quite simple and logical. All levels and zones of potential minimums and maximums are shown. Remember, the average price of the set and reset is important. The key resistance zone after the reversal, where you will need to dump most of the position, or everything, is highlighted in gray.
Altseason2025
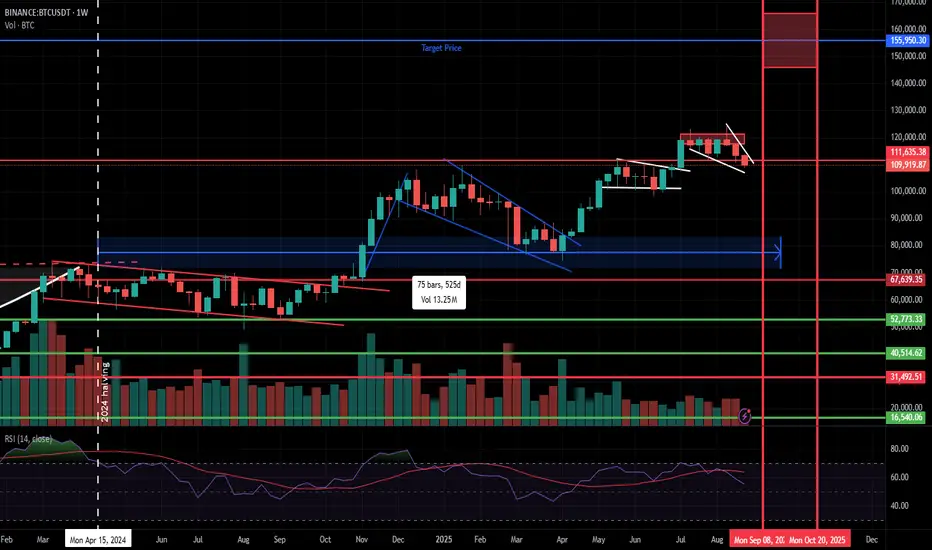
Is this the End of this Bull Cycle?BTC had a tremendous price gain in this current Bull run where as of writing; a YTD gain of 17.41% and YoY at 71.07%.
When the historical performance is considered in the past Bull runs, it can be observed that BTC has reached its ATH in each cycle within 510 to 550 days from the date of BTC halving.
2017 ATH : 526 days from July 9, 2016 halving
2021 ATH : 546 days from May 11, 2020 halving
Current Cycle (as of 26/08/2025): 493 days from April 20, 2024 halving
We are slowly reaching the region in time where BTC reaches its final ATH for the current cycle, marking the start of the bear run. Based on the historical behavior, this region lies within mid-September to end-October for this cycle . The major difference compared to other cycles is that we had a very late Altcoin season in this Bull run . This is mainly due to institutional adoption of BTC and ETH mainly with the introduction of ETFs (Exchange Traded Funds). 2021 Bull run had roughly a 314 day Altcoin season and if this cycle ends in the above region as expected, we will only see a standard Altcoin season only to somewhere between 80 to 110 days.
Also, during the same cycle as the Altcoin season started BTC.D (Bitcoin Dominance) fell from ~60% to ~46% within a span of 35 days and currently we can see the same action starting from the second week of August 2025. This further shows that there's a considerable portion of the altcoin season or the current Bull Cycle to remain intact at least until the BTC.D falls into mid 40%.
But with the current general market sentiment in the overall crypto market, with institutional adoption, oncoming of Solana and XRP ETFs, expected US rate cuts and a US president who is very positive on crypto and profiting well off from it, there is a possibility that this cycle might see an extension.
Even with all these positives, there is a considerable probability that we have already achieved the final ATH for this season. Most people are cautious on a recession with Trump tariffs, increasing US inflation, weakening labor market, possibility of an AI bubble breakout and high frequency of geo-political wars.
Also, the current price action momentum is in a weakening phase. The last two momentum bringing news were unable to maintain the price levels and break resistances. The CPI relief data on 12th August and Jerome Powell's hint on rate cuts at the annual economic policy symposium in Jackson Hole on 22nd August, both triggered a bullish price action which were unable to achieve consolidation at higher price levels. This further shows the uncertainty of the sentiment of the current market.
Current prices are heavily dominated by the derivatives market where OI (Open Interest) reached ATH for most crypto including BTC and SOL within this month. But the funding rates are not explosive unlike the euphoric states we've seen before, which confirms that the market is not over-leveraged as used to be in the past at this phase of the Bull Cycle.
In overall, we are at the last phase of the Bull run whether it gets played as expected or whether it gets extended by few months. Simply, this is the stage where people think BTC will never see 60,000 again.
Don't let delusion take over your strategy. Make sure you bags are ready to be booked into profits and with proper stop losses in place for sudden surprises.
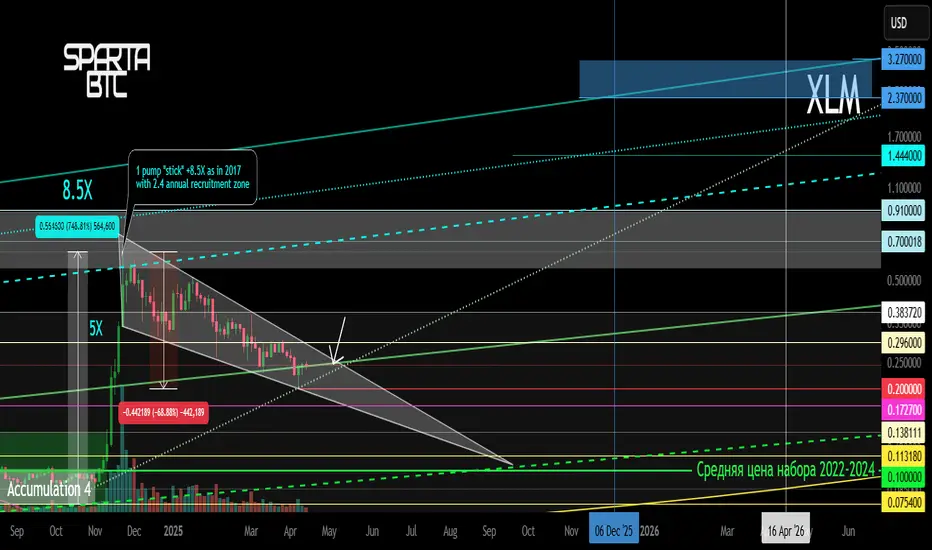
XLM/USDT Secondary trend. 14 04 2025Logarithm. Time frame 3 days. After a big pump "with a stick" (so that the "waiters" who want "a little cheaper" would not have time to buy) +8.5X from the accumulation zone of 2.4 years, now a descending wedge is forming on the rollback, similar to 2017. Breaking through its resistance (breaking the downward trend) - the second wave of price growth:
1) through consolidation and sideways movement (cutting the zone, dumping "in waves").
2) aggressive pump as in 2017 "with a stick" and entry into the main distribution zone (late autumn 2025)
The previous idea of the secondary trend was published on 14 01 2024 Exactly when the position was being collected in the horizontal channel in the 4 zones shown, as well as the reversal zone and the percentage of this first strong pump (under XRP).
XLM/USDT Secondary trend. 14 01 2024
XLM/USD Main trend. Timeframe 1 week. Channel. Publication in 2022.
Local wedge breakout zone.
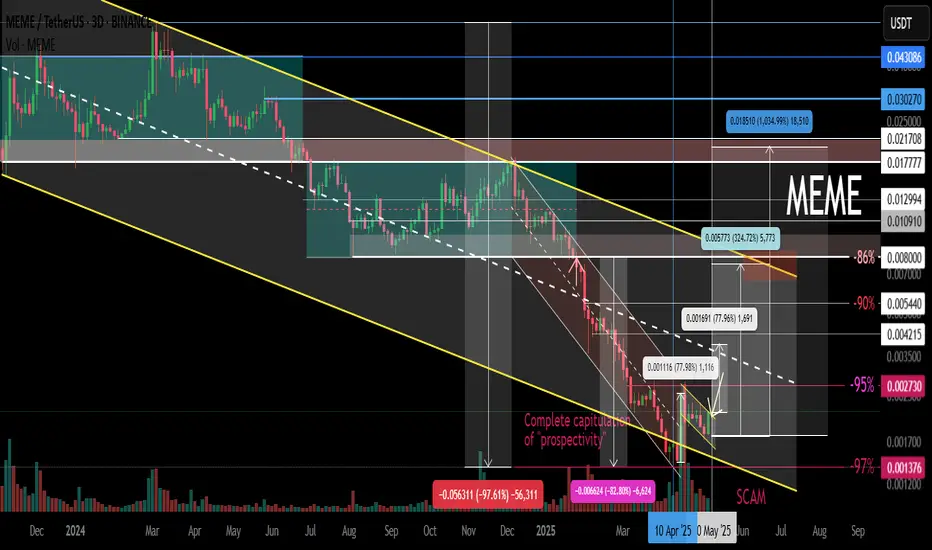
MEME Main trend -97% Channel. Reversal or scam zone.Logarithm. Time frame 3 days (less is not needed).
🟡 The price has reached a decline from the highs (not a listing squeeze) -97%. These are practically the maximums of declines after the hype for cryptocurrencies of such liquidity (96-98), after which there is only a complete scam. At the moment, there is a reaction from this zone (the lower zone of the main trend channel) (impulse buyback), and a rollback after it, which forms the canvas of a potential ascending flag. If there is a breakthrough, then locally - the implementation of the ascending flag.
⚠️🔼 These are high-risk cryptocurrencies of such liquidity (that's why such declines are big), but the percentage of price growth in them, for the same reasons (liquidity/volatility) is an order of magnitude greater in the case of their implementation. When working with such assets, observe money management.
🟣 Implementation of the flag's goals (essentially to the channel median) +80-100%
🟡 To the resistance of the descending channel of the main trend +325%
🔵 To potential highs (one of the previous consolidations) +1000-1300%.
Bitcoin, Ethereum Breakout: 401(k) funds & the next "Altseason"Bitcoin is up 10% in August, driven by strong ETF inflows and a game-changing executive order allowing 401(k) retirement funds to invest in cryptocurrencies, potentially bringing trillions of dollars into the sector.
Technically, Bitcoin and Ethereum are breaking out toward multi-year highs, with BTC leading and ETH close behind—setting the stage for a possible "altseason" if these levels hold and capital rotates into altcoins.
This content is not directed to residents of the EU or UK. Any opinions, news, research, analyses, prices or other information contained on this website is provided as general market commentary and does not constitute investment advice. ThinkMarkets will not accept liability for any loss or damage including, without limitation, to any loss of profit which may arise directly or indirectly from use of or reliance on such information.

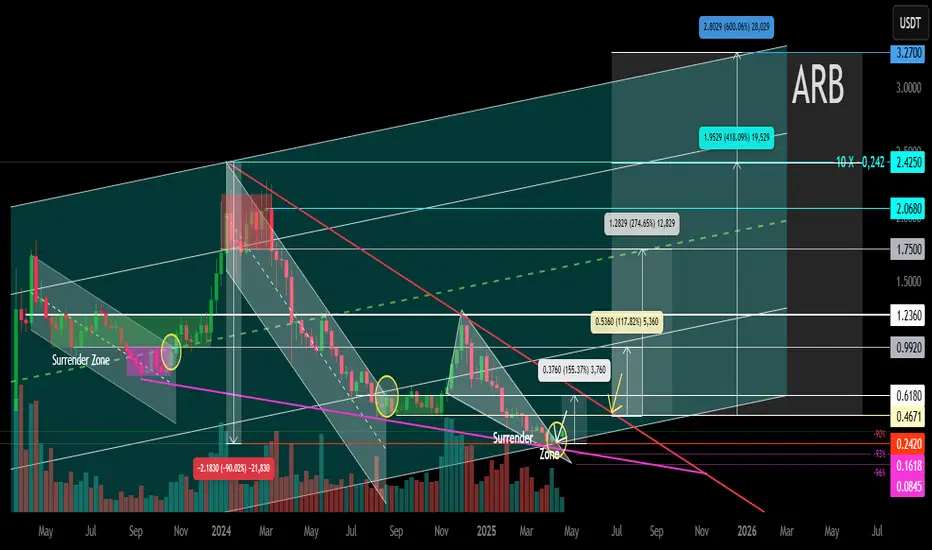
ARB Main Trend 24 04 2025Logarithm. Time frame 1 week.
Previously a very hyped coin, "killer" of something there...
Now - the dominant opinion is that this is a scam, a scam, "whales are selling now", and so on. It's funny to look at all this and how the opinion changes with the price. Crypto is a mess, there are no other words... That is, now is the time to take a closer look at the asset, and the start of the set.
If the price drops to lower values (shown on the chart), from the position of the trend, and potential percentages of the pump, the price is now acceptable, and the profit will be significant, but not "hamster". Set adequate goals, fix in parts as the trend develops, protect your profit. When there is an aggressive pump "with a stick", by a large %, - completely exit the asset, or protect the profit with a stop.
There is a small probability that an asset of such capitalization, and the unrealization of "buy a candy wrapper", will be knocked down in advance before the full 3rd alt season of this cycle, without distributing "prospects" on the "revival of faith".
⚠️ Now the decline from the maximum is -90% . For assets of such liquidity, these are not the lowest values, but perhaps the previous hype played a role in this. Work from the average price, or on a breakthrough and you will not care when the reversal occurs. The main thing is to distribute the entry and exit points after the purchase in advance, that is, distribute the risk and profit. And, after that, no longer be interested in the asset, or opinions, or fictitious positive / negative news to stimulate demand / supply of "stupid money". Do not get stuck in market noise and unnecessary opinions driven by fear or greed.
1️⃣ If this zone of minimums is held — for starters, the potential for a downward trend of the secondary trend (shown with a red line).
2️⃣ Then, when it is broken , — to the channel median (green dotted line).
🟣Local trend At the moment, a wedge-shaped formation has formed in it, there is an attempt to break through it and the price is clamped.
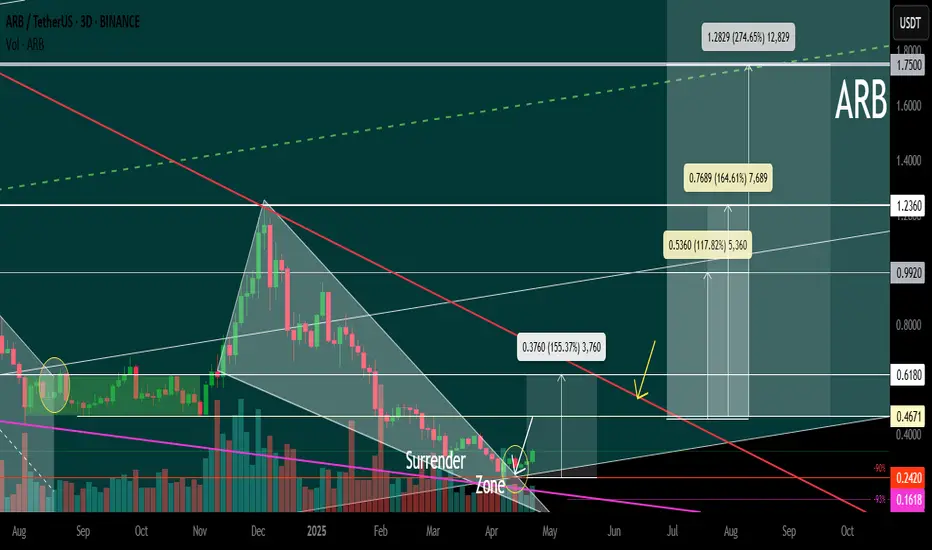
ARB Secondary trend. 24 04 2025Logarithm. Time frame 3 days (less is not necessary).
⚠️ Currently a decline from the maximum of -90% . For assets of such liquidity, these are not the lowest values, but perhaps the previous hype played a role in this. Work from the average price, or on a breakout , and you will not care when the reversal occurs. The main thing is to distribute the entry and exit points after the purchase in advance, that is, distribute the risk and profit. And, after that, no longer be interested in the asset, or opinions, or fictitious positive / negative news to stimulate demand / supply of “stupid money”. Do not get stuck in market noise and unnecessary, fear-driven or greed-driven opinions.
Main trend (the entire history of cryptocurrency trading), for clarity of pricing and the zone for work now, which is discussed.
ARB Main Trend 24 04 2025
🟣 Local trend. At the moment, a wedge-shaped formation has formed in it, there is an attempt to break through it and the price is clamped.
1️⃣ If this zone of minimums is held — for a start, the potential for a downward trend of the secondary trend (shown with a red line).
2️⃣ Then, when it is broken through , — to the channel median (green dotted line).
Bitcoin CME Closing Price: The Key to Next Week’s TrendIn this video I cover the CME closing price and go through a plan which includes a gap to the upside and a short squeeze before gravitating to the downside for lower targets .
I also give a bias for higher prices if the VAH is claimed .
This idea is modelled on the daily time frame and can play out over the course of the following week or more .
I also look at the Eth/Btc pair and the Btc dominance chart and marry whats happening on those charts with this idea .
When looking at BTC I use order flow software to further support my bias and the confluences I present in the chart.
If you have any questions then leave them below .
Support my work with a boost and Safe trading

When Altseason? Clues in other chart Ex) #1Hi guys.
So Its no secret bitcoin has been ripping.
We are at new all time highs, and in full on price discovery mode.
I recently posted an ongoing macro analysis on ADA (Cardano) supporting my theory that it is one of the better alts to be investing in for alt explosion.
I want to look elsewhere to see if i can find supporting evidence that its time to invest or trade altcoins.
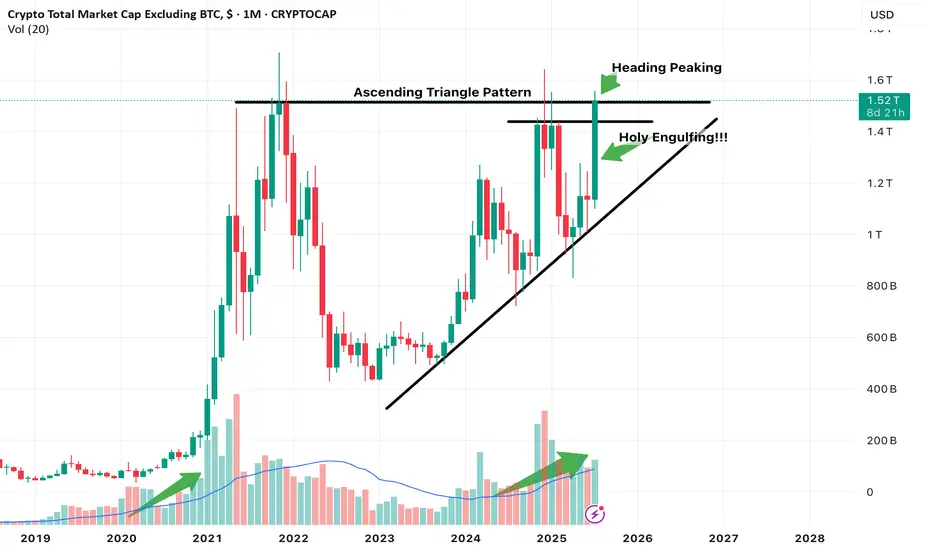
One chart that can be used is the Total Market Cap of Crypto excluding Bitcoin.
This chart showcases total altcoin market capitalization and its movements.
I believe certain Technical developments can really help us gauge at whats to come.
NOte this is on the 1 Month timeframe aka looking into Macro developments.
Just focusing on Candlestick action.
Notice we have been in this ascending channel trend, along with a potential Ascending triangle pattern development which if breakout occurs with confirmation can push Altcoin market cap higher indicating that liquidity is entering altcoins which indicates potential Uptrend.
The month of July so far is in position to print a massive engulfing Bullish candle, which is a great sign.
The upper part is also peaking its head above the Horizontal resistance line. Need to observe confirmation of this breakout. Look for it in smaller timeframes, ill look for it in the 3 day or 5 day.
We are also in position to print a higher high first time in a while.
Notice also Volume. We are seeing currently similar increasing volume as previous alt coin market cap expansion.
Keep an eye out on more posts to add to evidence that supports we are in the verge of potential altcoin season.
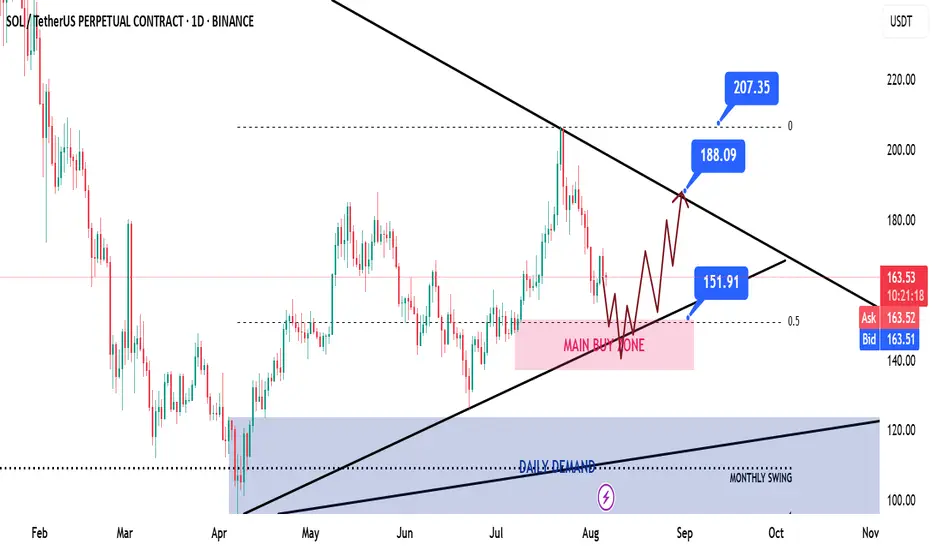
SOL | Solana Game Plan - Swing Long IdeaSOL | Solana Game Plan - Swing Long Idea
📊 Market Sentiment
Market sentiment remains bullish, supported by expectations of a 0.25% rate cut at the upcoming FOMC meeting. The weakening USD and rising risk appetite across global markets continue to favor crypto assets.
We’re currently seeing a minor retracement, primarily driven by the Nasdaq’s pullback — but the overall outlook for the crypto market remains bullish in the weeks ahead.
📈 Technical Analysis
Price was rejected from the HTF bearish trendline near $207 and is now retracing.
The retracement aligns with a HTF bullish trendline, which I believe could spark a strong move to the upside.
This area also aligns with the 0.5 Fibonacci retracement level (discount zone) and a HTF demand zone — forming a strong confluence for a potential bounce.
📌 Game Plan
I want to see price hit the HTF demand zone at $152 (purple box).
It should also tap the bullish trendline.
The zone aligns with the 0.5 Fibonacci level — my key discount area.
🎯 Setup Trigger
After these levels are tagged, I’ll be looking for a 4H bullish break of structure, which should also form a new 4H demand zone for confirmation.
📋 Trade Management
Stoploss: Below swing low of the 4H demand zone
Targets:
• TP1: $188
• TP2: $207
• TP3: $297
I’ll trail my stop to lock in profits aggressively as price moves in my favor.
💬 Like, follow, and comment if this breakdown supports your trading!
More setups and market insights coming soon — stay connected!
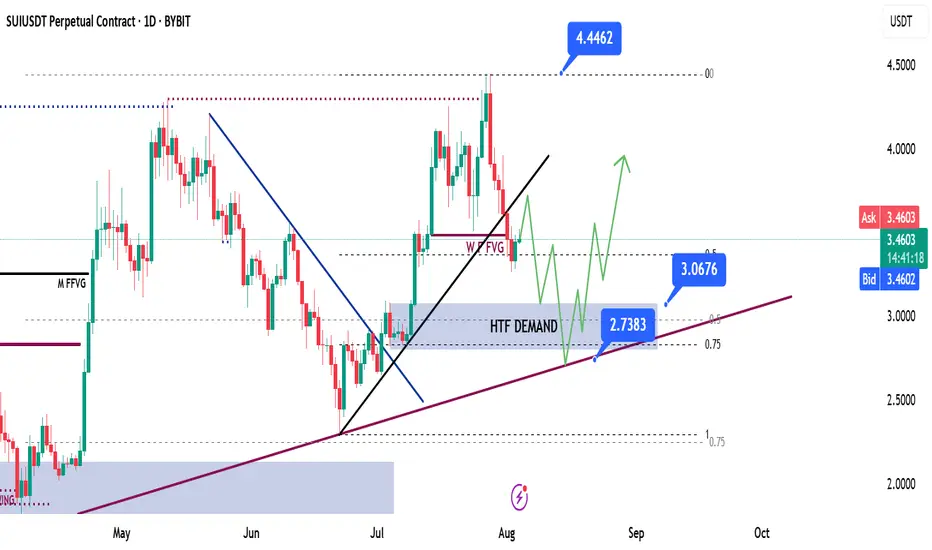
SUI | Sui Network - Swing Long Idea - Altcoin
📊 Market Sentiment
Market sentiment remains bullish, supported by expectations of a 0.25% rate cut at the upcoming FOMC meeting. The weakening USD and rising risk appetite across global markets are favoring crypto assets in particular.
📈 Technical Analysis
SUI recently gained bullish momentum, largely following Bitcoin's strength.
We’re now seeing a healthy retracement, which is expected after a strong move.
The break of the LTF bullish trendline suggests potential for a deeper pullback toward HTF confluence zones.
📌 Game Plan
I'm eyeing the HTF demand zone around $3.06, which aligns with the 0.5 Fibonacci retracement—a key discount zone.
Just below this, we also have a higher time frame bullish trendline, which could offer dynamic support.
These overlapping levels provide a strong confluence for a swing long idea.
🎯 Setup Trigger
I’ll wait for a 4H bullish break of structure and the formation of an LTF demand zone before entering.
📋 Trade Management
Stoploss: Below 4H demand swing low
Target: Up to $4.44
I’ll trail my stop to lock in profits aggressively along the way.
💬 Like, follow, and comment if this breakdown supports your trading!
More setups and market insights coming soon — stay connected!
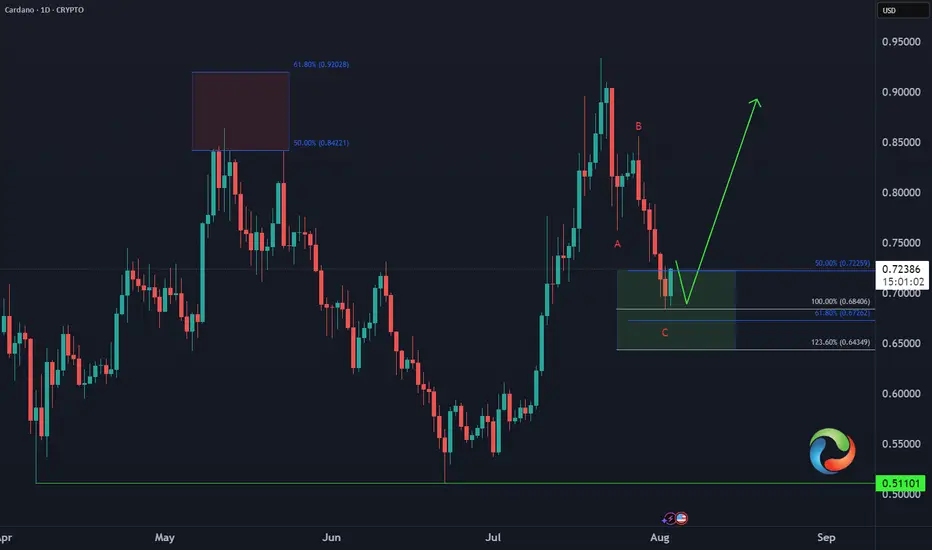
Cardano ADA Buying Opportunity📈 CRYPTO:ADAUSD has completed a 3-swing pullback against the June low and entered the extreme buy zone at $0.72–$0.64. While marginal new lows are still possible, this area aligns with Fibonacci confluence, making it a prime zone for a bullish reversal or at least a 3-wave bounce next week.
Solana SOL Extreme LevelsCRYPTO:SOLUSD Extreme Levels
50% - 61.8% Fib Ret ($166 - $156) ✅
Equal Legs area ( $164 - $145) ✅
Next Higher Target = $218 🎯

Ripple XRP Bullish Reversal📈 CRYPTO:XRPUSD dropped in 3 swings vs June low, now in buy zone $2.78–$2.47. Marginal lows still possible, but bounce expected next week from this extreme area.

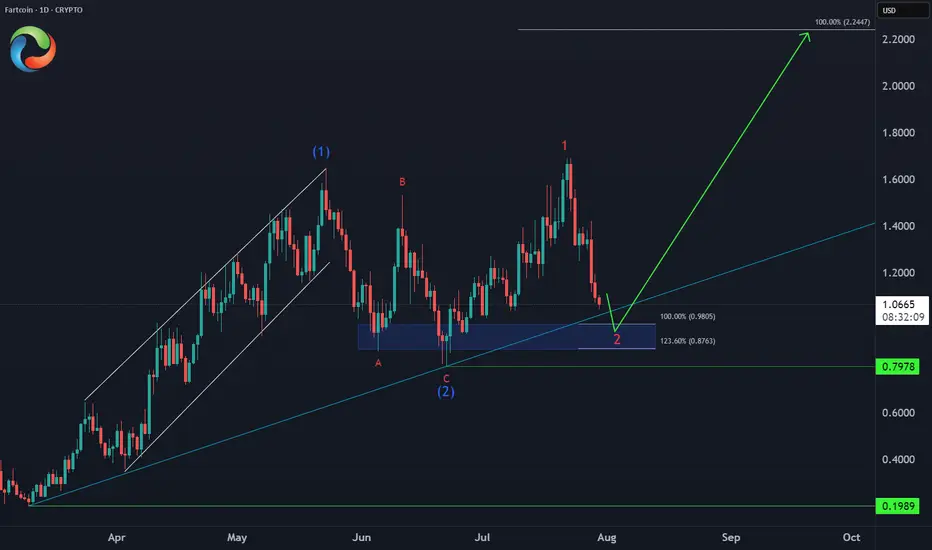
FARTCOIN Bullish Setup 📈 CRYPTO:FARTCOINUSD Entering an extreme buying area:
✅ Key support zone: $0.98-$0.87 (April trendline + equal legs)
⛔ Invalidation: $0.79
🎯 Target: $2.20 (124% upside)
This is how explosive meme setups look before liftoff.
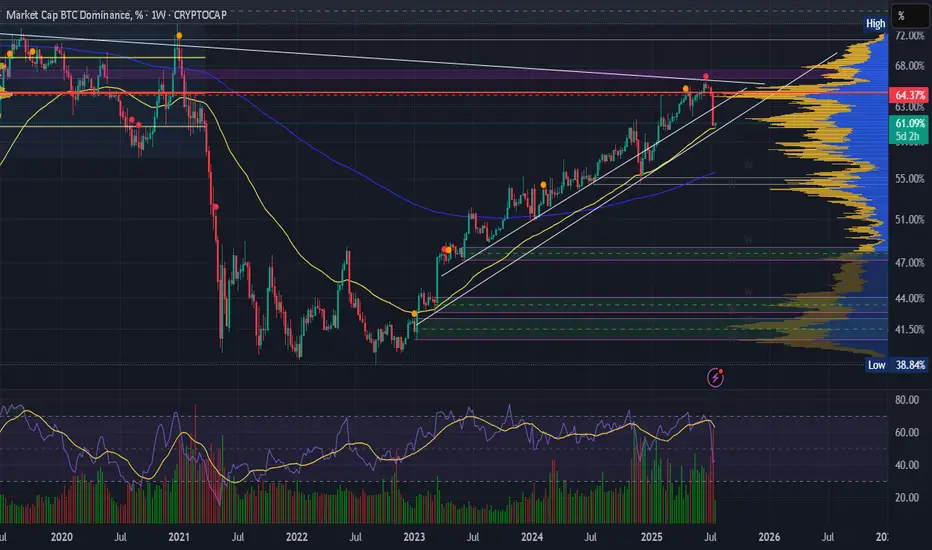
Bitcoin Dominance Topping Out? Bitcoin dominance ( CRYPTOCAP:BTC.D ) may be hitting a cycle top, signaling a potential major shift in capital rotation across the crypto markets.
Historically, when Bitcoin dominance peaks, we tend to see:
🔄 A rotation of capital into altcoins
🚀 Explosive rallies in ETH, SOL, and mid-cap alts
💰 Increased retail speculation and trading volume across DeFi and meme coins
Previous cycle tops in BTC dominance (e.g., 2017, 2021) preceded major altcoin seasons, with dominance falling sharply while total crypto market cap continued to grow.
⚠️ A rejection at key resistance (like the 200-week MA or golden fib levels) could confirm a reversal, hinting that altseason is around the corner.
💡 Keep an eye on:
ETH/BTC breakout potential
Total3 (crypto excluding BTC & ETH) trends
Risk-on sentiment and social metrics
Will history repeat? Or is this cycle different?
📈 Chart shows confluence of horizontal resistance, weakening RSI, and declining momentum on BTC.D.
Not financial advice. Always DYOR. Use proper risk management.

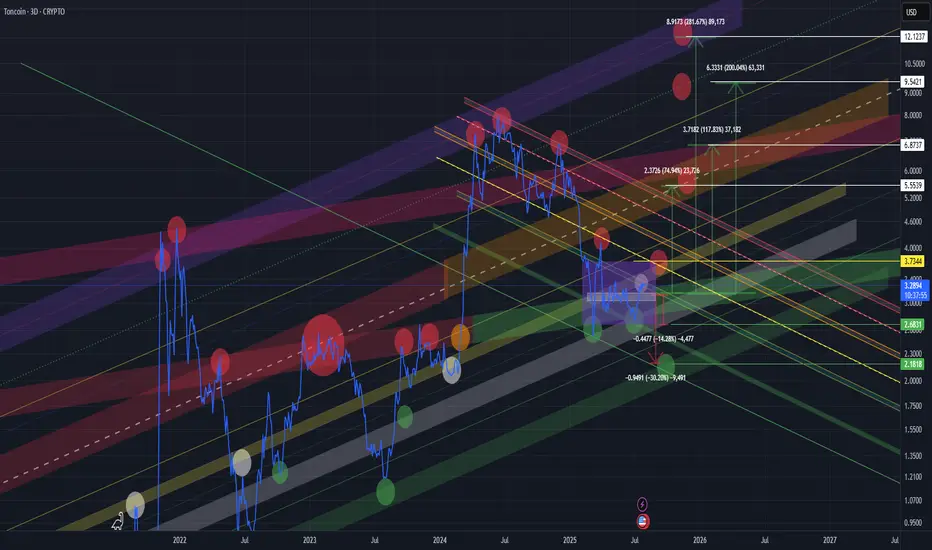
TONUSD TONUSDT TONCOIN mid- to long-termIn my view, we are still in the accumulation phase. The current price action and reactions at key levels suggest ongoing accumulation.
🔻 Bearish Scenarios:
In the short term, a retest of the lower boundary of the accumulation zone (purple box) is possible if the market weakens.
The worst-case scenario would be a move down to the lower green support zone, which has historically triggered strong bullish reactions. This is a critical demand area.
🔼 Bullish Scenarios:
A confirmed breakout and hold above the white line (within the purple box) would signal strength and a potential move higher.
We would then likely see a retest of the upper boundary of the accumulation zone.
A breakout and consolidation above the yellow line would open the door for a move toward the wider yellow channel, which could act as a final target zone
🚨 High-Risk Zone:
The yellow channel might represent the final phase of the current move.
From there, we could see either a sharp correction
Or, if trend strength and macro conditions allow, a continuation towards a new ATH (purple line).
📌 📌 📌 :
All marked lines and zones represent key support and resistance levels.
Price reaction at these areas will be crucial for decision-making.
As always, risk management and trend confirmation are essential.
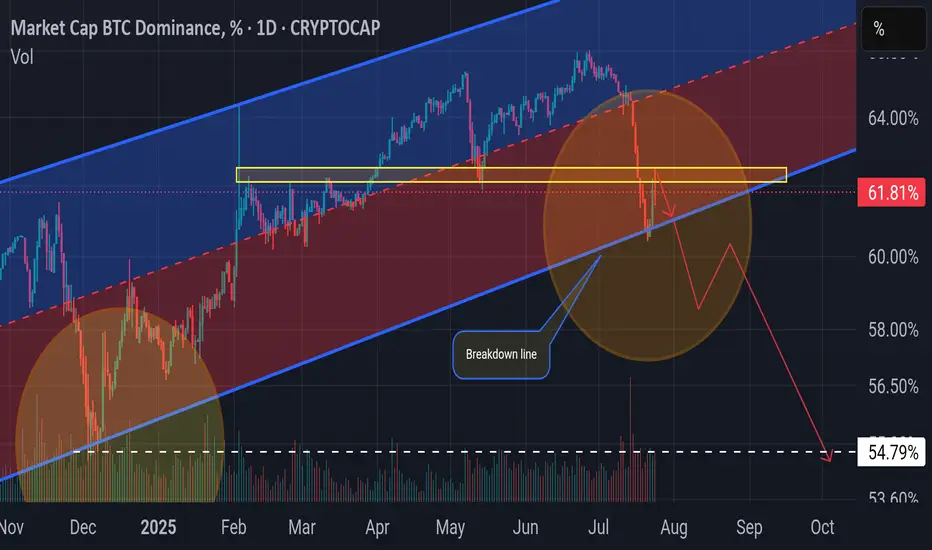
BTC.D The party begins 🚀 Altseason has kicked off. BTC.D's candle body already broke below the breakdown line briefly and is now bouncing slightly off the trendline — just a retest before another leg down. Once it breaks again, that’s when the real party starts 📈🎉.
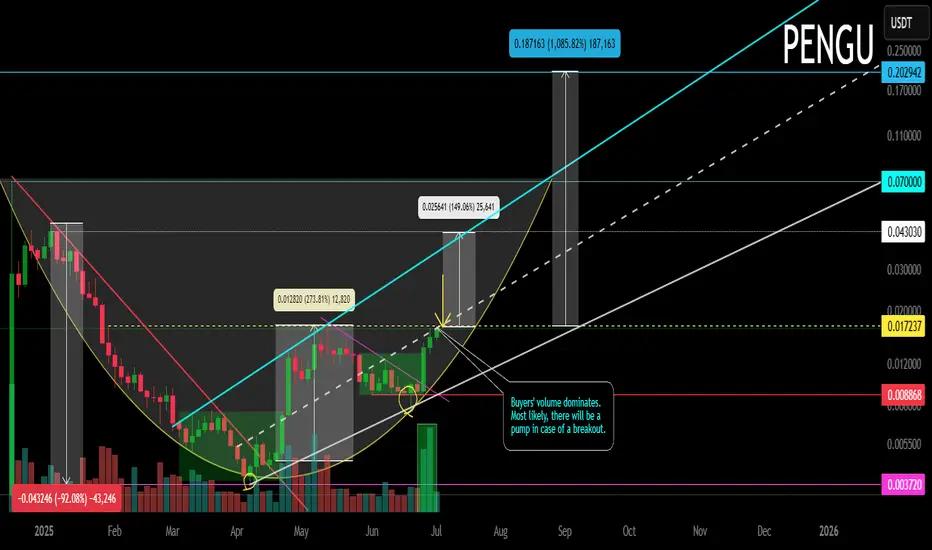
PENGU. Main trend. Trend reversal zone. 04 07 2025Logarithm. Main trend. Fresh cryptocurrency, which is being driven into hype.
Locally now. Price at the median of the bowl.
Buyer volume dominates. Most likely, there will be a large pump in case of a breakout.
The chart is somewhat reminiscent of the Bitcoin chart, the reversal zones of this secondary trend, after the first local wave of growth. The first local, significant target is shown.
There is a possibility of a helicopter, that is, to collect stops in both directions, and thereby dump passengers before a potential pump.
Such cryptocurrencies (low liquidity, monopoly over the price due to the concentration of cryptocurrency in “one hand”) at a good time "the hamster is not scared", will be pumped up conditionally, like Shiba Inu (SHIB), driving the hype (raising the price over and over again, and coming up with positive news) and 0.5 million Twitter subscribers (X). Medium-term — long-term level zones are shown on the chart.
Why Alts Dump Again?? Altseason cancel?After forming a minor rejection at both the trendline and support level, BTC dominance may need to retest the 62% level or higher following the recent sharp dump.

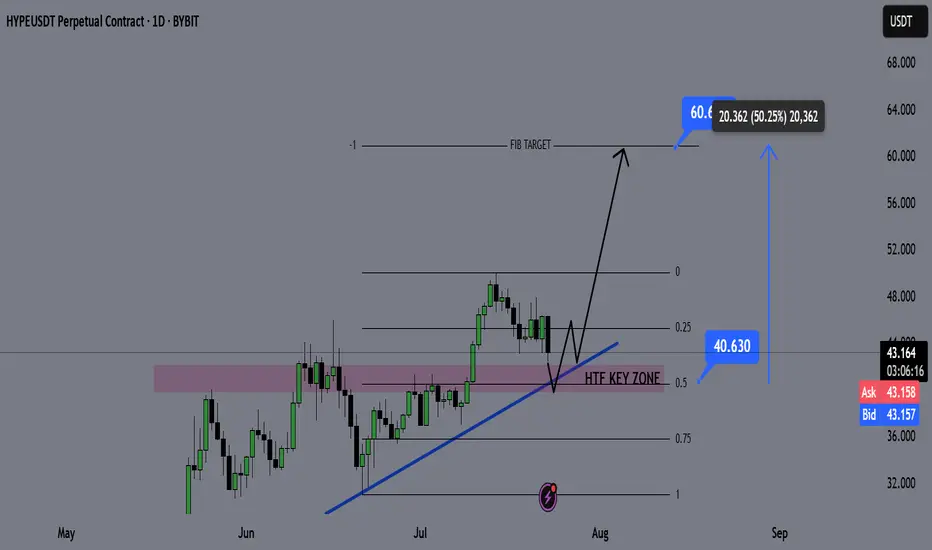
HYPE Swing Long Opportunity - Altcoin Season📌 Fundamental Sentiment:
The crypto market — alongside broader risk assets — continues to gain traction. This momentum is largely fueled by rising expectations of policy shifts in the U.S., with Trump intensifying pressure on Jerome Powell and advocating for aggressive rate cuts from the Fed.
📌 Technical Analysis:
HYPE is approaching a key HTF bullish trendline, and confluences are stacking up in the same region:
✅ HTF Demand Zone
✅ Equilibrium (EQ) of the HTF bullish trend
✅ Bullish Trendline Support
These three HTF confluences overlapping at the same price zone indicate a high-probability setup for a significant bounce and a possible swing long opportunity.
📌 Gameplan:
Price hits HTF bullish trendline
HTF demand zone gets tested
EQ level tapped → discount offered to buyers
📌 LTF Confirmation Criteria:
I’ll wait for:
A 1H swing break
A strong 4H rejection candle
These will confirm momentum shift. If confirmed, I’ll enter a swing long.
🎯 Target: $60
💰 Potential gain: ~+50%
❗ Stop-loss: Below the swing low that triggers the LTF confirmation
—
🔔 Follow for daily setups and weekly macro recaps
💬 Drop your chart or questions below!
BTC.D Bitcoin Dominance on a bigger timeframe support?
This is my first time posting an idea, therefore not an expert, I hope the graphs show right.
Seeing a weekly chart, I see another support across the levels of March 6th, Dec 2nd and the current level. Could this have been only a warm up for the altseason? Do we have to wait for the week of August 25th?
CRYPTOCAP:BTC.D
If you check the Weekly chart for TOTAL3ESBTC, the week of August 25th could provide another support at 0.255.
The exact point we are hitting now is the POC for the beginning of 2019 up to today.
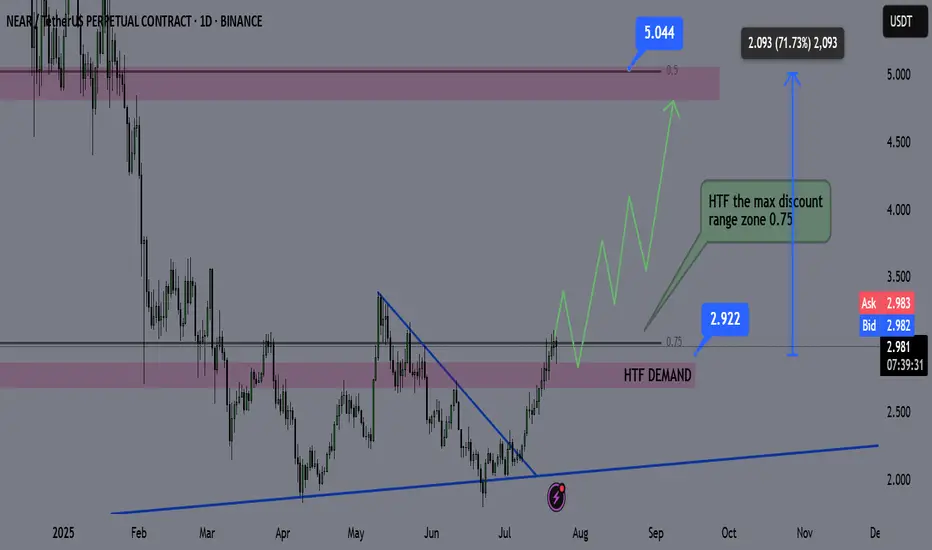
NEAR Swing Long Idea - Altseason 2025📌 Fundamental Sentiment:
The entire crypto market is rallying, alongside other risk assets. This is mainly driven by U.S. policy expectations — Trump is pressuring Powell to resign and aggressively pushing for rate cuts from the Federal Reserve.
📌 Technical Analysis:
NEAR has recently broken and closed above a significant HTF support/resistance level.
Additionally, we’re now trading inside the 0.75 Fibonacci retracement level of the HTF bullish trend — which I define as the maximum discounted zone.
For this setup, I’ll apply my Deep Range Theory (DRT):
If price dips below the 0.75 zone and accumulates there,
Then breaks above 0.75 after a period of consolidation,
→ It signals that price aims for the 0.5 level of the range and will likely run HTF liquidity for either reversal or re-accumulation before continuation.
📌 Gameplan:
✅ Break and close above HTF S/R
⏳ Waiting for break and daily close above 0.75
🔄 Retest to LTF demand (4H–1H)
📈 A bounce on LTF demand will trigger the long setup
📌 Trade Management:
This is a mid-term swing trade, as I’m following the HTF bullish trend.
🎯 Target: $5 — which is approximately a +70% move from current price.
❗Risk Management:
If price makes a daily close back below 0.75 after breaking and closing above, I will exit the trade to preserve capital.
I’ll also monitor macro sentiment closely. If there's a sharp bearish shift, I may consider an early exit before reaching the HTF target.
—
🔔 Follow the channel for daily trade ideas & weekly macro recaps.
💬 Drop a comment below if you have any questions or insights!