AMC MAIN RUN Scenario 2I've always thought that they would slowly let this unfold like a Tesla play. This pattern seems to be the most likely scenario that they could let it play out to. Guess we will have to wait and see.
AMC
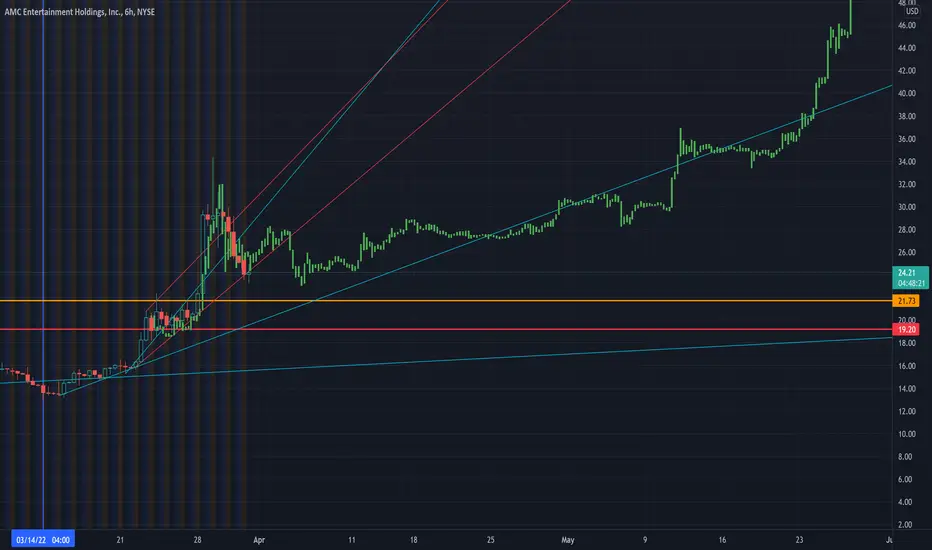
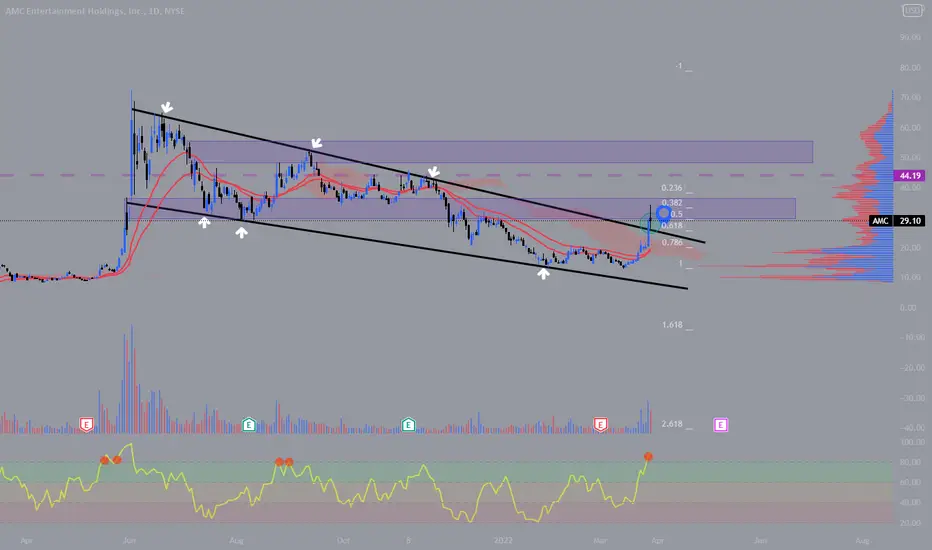
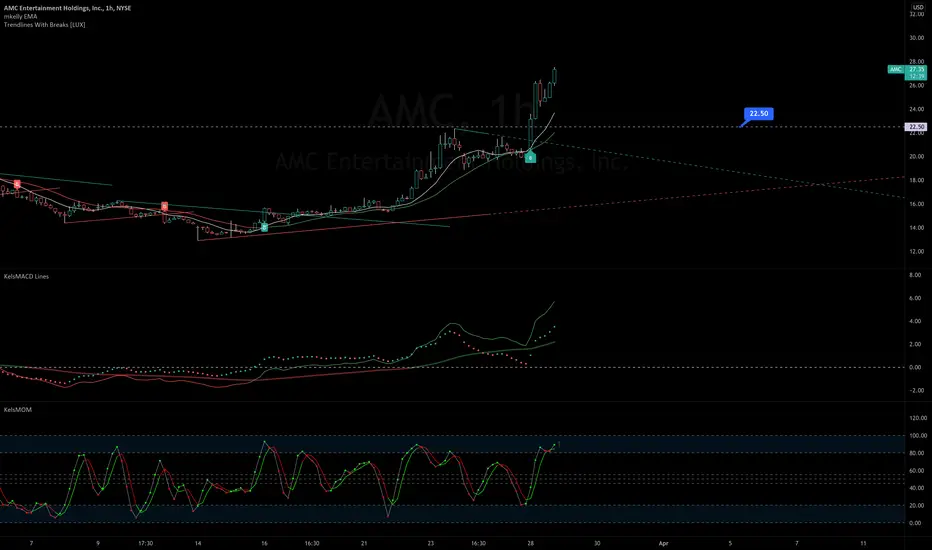
AMC - Building momentum but know your levels
Double bottom breakout in progress.
Price just bellow next supply zone..building energy for a big move.
I'd expect test of 29, with trendline in play.
pullback there and consolidation above 24 should set it for next leg up around 44.
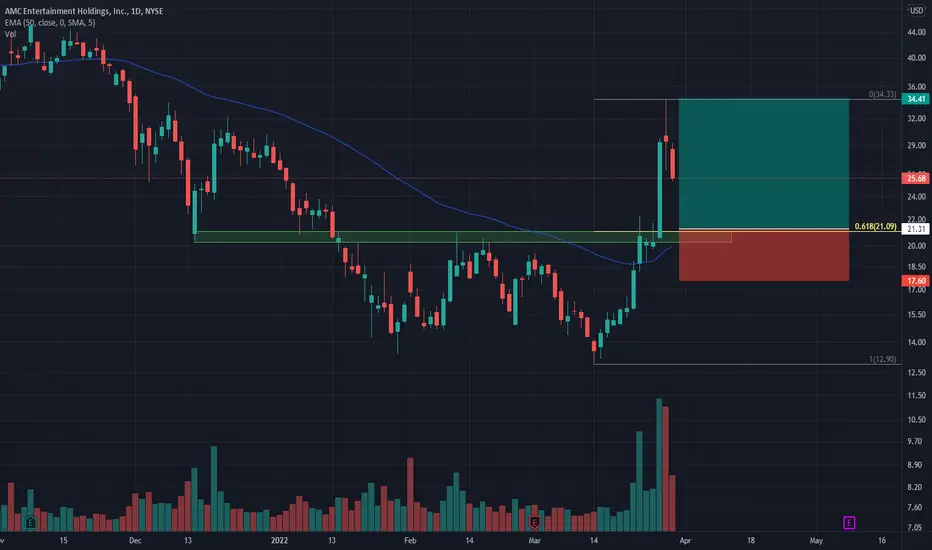
AMC Back to the Moon? AMC
Short Term - We look to Buy at 21.31 (stop at 17.60)
Preferred trade is to buy on dips. 50 1day EMA is at 20.00. We have a 61.8% Fibonacci pullback level of 21.09 from 12.90 to 34.41. Trading volume is increasing. Previous resistance, now becomes support at 21.00.
Our profit targets will be 34.41 and 43.15
Resistance: 30.00 / 35.00 / 40.00
Support: 21.00 / 15.00 / 10.00
Disclaimer – Saxo Bank Group. Please be reminded – you alone are responsible for your trading – both gains and losses. There is a very high degree of risk involved in trading. The technical analysis, like any and all indicators, strategies, columns, articles and other features accessible on/though this site (including those from Signal Centre) are for informational purposes only and should not be construed as investment advice by you. Such technical analysis are believed to be obtained from sources believed to be reliable, but not warrant their respective completeness or accuracy, or warrant any results from the use of the information. Your use of the technical analysis, as would also your use of any and all mentioned indicators, strategies, columns, articles and all other features, is entirely at your own risk and it is your sole responsibility to evaluate the accuracy, completeness and usefulness (including suitability) of the information. You should assess the risk of any trade with your financial adviser and make your own independent decision(s) regarding any tradable products which may be the subject matter of the technical analysis or any of the said indicators, strategies, columns, articles and all other features.
Please also be reminded that if despite the above, any of the said technical analysis (or any of the said indicators, strategies, columns, articles and other features accessible on/through this site) is found to be advisory or a recommendation; and not merely informational in nature, the same is in any event provided with the intention of being for general circulation and availability only. As such it is not intended to and does not form part of any offer or recommendation directed at you specifically, or have any regard to the investment objectives, financial situation or needs of yourself or any other specific person. Before committing to a trade or investment therefore, please seek advice from a financial or other professional adviser regarding the suitability of the product for you and (where available) read the relevant product offer/description documents, including the risk disclosures. If you do not wish to seek such financial advice, please still exercise your mind and consider carefully whether the product is suitable for you because you alone remain responsible for your trading – both gains and losses.
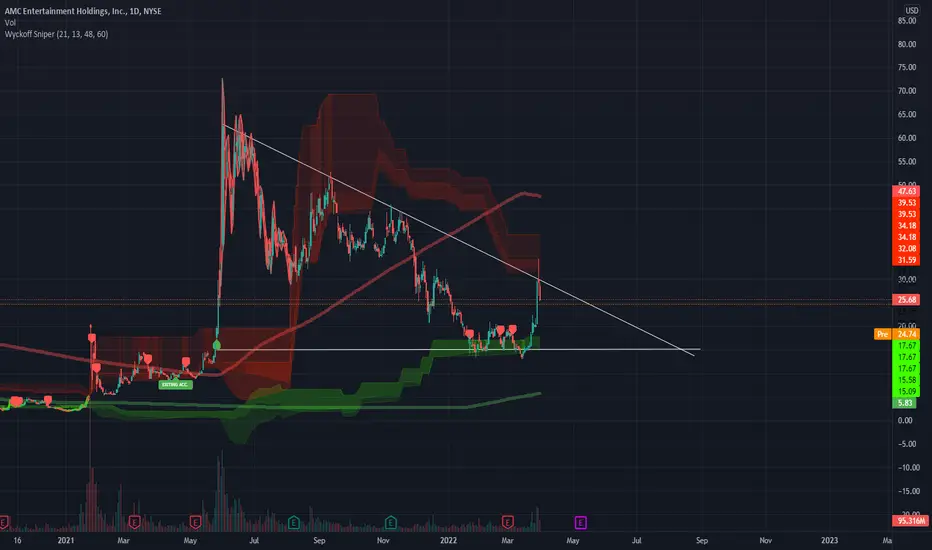
AMC Descending TriangleDescending triangles are normally seen to be bearish, but in AMC's case the fundamentals, current hype and the company,s recent investment in mining company HYMC leads me to believe this is a bullish scenario. We've fallen out of a 9 month falling wedge but we still haven't exited the triangle. My prediction is that this will happen between now and mid- to late July. Hang on to your hats.
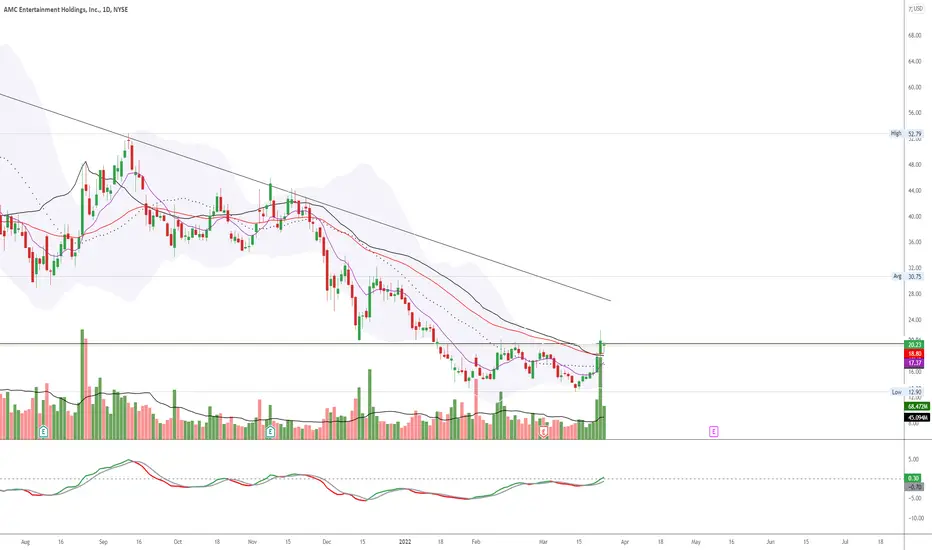
Amc Looking for higher lowI have no opinion of the company
the large green volume candle suggests higher prices but we need support above fib .618
Large volumes usually indicate exhaustion depending on their position in the chart or future things to come, and some times both
We need to hold support above 20ish and raw sideways.

AMC TREND ANALYSIS Its due for the massive gap up SQUEEZE ALERT
If AMC makes a massive rip up in the next week I am almost confident it will be similar to 2021
Not financial advice
AMC next leg up | Road to $100 a sharethis is what I believe the next leg could look like, I expect further sideways action as we hover above the daily 200 EMA. We could make another move up to $30 next week, again not financial advice just what I believe will happen next & wanted to share my thoughts. LFG APES

AMC Moon Phase Analysis MarketMoonLordNew Moon Friday, Bullish for the next two weeks for a MoonShot!

$AMC: Huge Rounded Bottom! (TARGET 47$)A huge rounded bottom has been spotted on AMC.
⭐Neckline Resistance (30$) The 30$ level is a huge level when it comes to options. 33.5k Volume and 21k Open Interest.
⭐Short term rejection (25.35-26.5$) 7.86 Fib (25.35$)
⭐This rounded bottom pattern is valid due to its touchpoints being supported by large buying-volume.
⭐Once 30$ Is broken we face resistance at 33-34$, 36-37$, 38$ 40.5$, 42$, 44$
⭐The weekly options remain bullish (35$, 20k Volume and 25k Open Interest) (40$ 26.4k Volume and 58k Open Interest)
⭐Weekly close above 30$ signifies continuation.
⭐A Green 9 has been spotted on the TD-Sequential, this is hinting for a retracement (Normally 1-4 Candles)
⭐Watch for a break of the neckline (30$) with large volume.
⭐The target of the rounded bottom is 47$.
*WARNING* This thread is not financial advice. I am not a financial advisor.

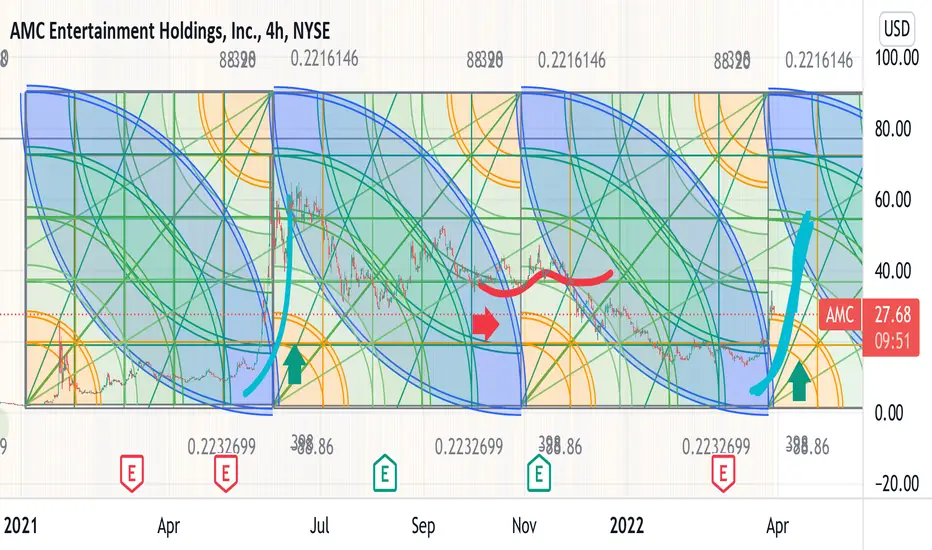
AMC Gann squares I made clones of the gan squares that I made from fitting a speed resistance fan from the set up of may/June and speculated $90 then down to January 2021 to $2. That I put a gann square in and cloned them. Side by side as if it were like a fractal or something. This held up to respect and if this charting is correct. This would have to be a jump off the gold rings to the blue bubbles
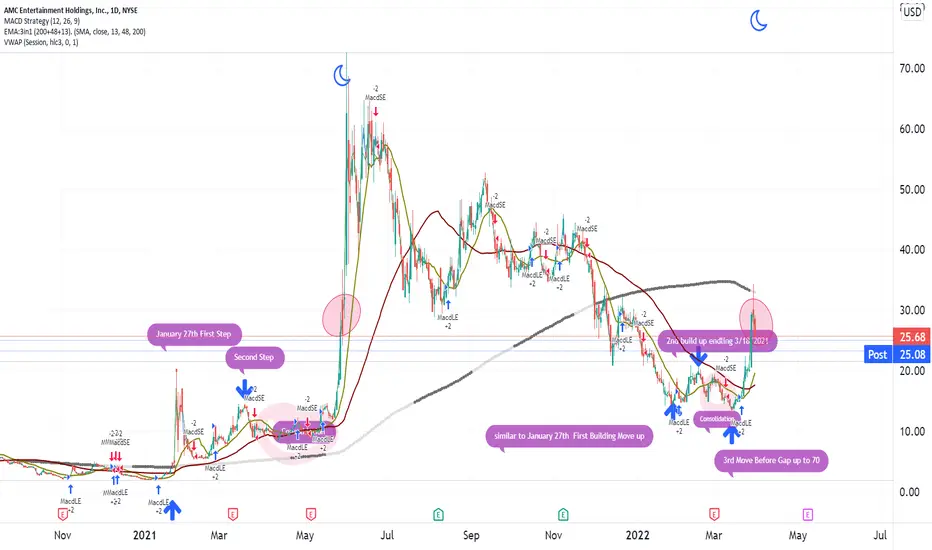
AMC MAIN RUN Scenario Looking for a run continuing Wednesday(30th) into Friday setting up Weekly Options. FOMO + Options creating GAMMA squeezes are what propels the stock into higher numbers. Possible scenario is that we see 70's early 1st week of April. Second week of April should bring the rain.....4-500 range. Watch the dip....you're a champ if you can stomach April... The month of May might change EVERYTHING.....You don't want to know what that number goes up to....worst case scenario is that they stall this going in to late June time frame. Seems like the bull runs are shorter cyclically and longer timing during the bearish runs. Either way, stock is either bullish, or extremely bullish... just depends on how much they want to free up and try to gain back control. There is some timing that everything. Not financial advice, just calling out a pattern from a previous run elsewhere.
I have seen another scenario where the timing of this drags out later in to the middle of the summer..... will post a new one should they deviate from this. Enjoy everyone!

$AMC: Massive Rally Incoming! (72$?)AMC broke out of a large bull flag. The price target of this pattern is 72$.
We have also broken out of the Ichimoku Cloud which is a sign of strength. This movement is confirmed by engulfing volume.
We have mounted the 20$ level with significant volume (.786 Fib) It is also a large VPVR node making it strong support.
We also mounted the .618 Fib at 25.7$ which has become strong support confirmed by the VPVR.
We have also retested the bull flag at 26,4$ which on micro time frames is the 7.86 Fib. This retest of the bull flag is a sign of strength because of the large buying volume that appeared at this level. We didn't even wick within the bull flag.
Currently we are facing resistance at the 0.5 Fib 29.5-30$ confirmed by the VPVR.
We also got resistance at the .382 Fib (33.41$)
Later on we have .236 Fib level resistance at 38.31$.
The MFI is on a strong uptrend, it looks healthy for continuation.
The volume is looking extremely bullish which makes all of the price action valid.
Options chain is also extremely bullish.
Check the related ideas for a micro-timeframe update.
*WARNING* This thread is not financial advice. I am not a financial advisor.
Thank you for reading.
AMC NYSE Black Mountain Analytical Team:
AMC 3 possible scenarios
Wait for the price reaction to the area and zone.
We will wait for the price reaction to the Resistance line and the static Resistance range. After the price reaction, we can enter.
We are currently monitoring it to catch it in the first price movements.
TREND LINE-Resistance area

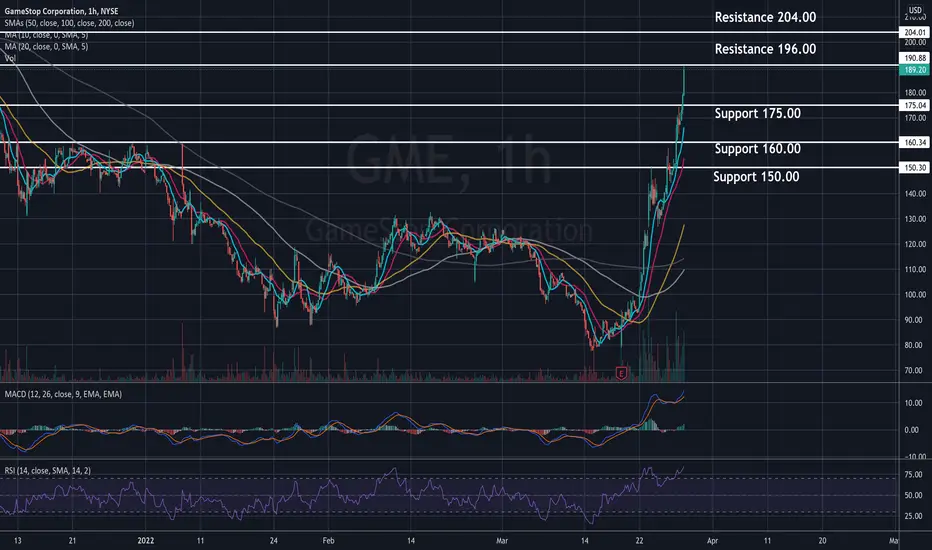
GME Price TargetsAnalysis done on hourly candles. The infamous Gamestop enjoyed its tenth consecutive day of a bullish rally to start off the week, placing its daily candle back above the 200 day moving average. This is a level that GME broke below in November of last year, and now that GME moved back above it you can use it as a support point. Going into tomorrow you’ll want the daily candle to open above the 200 day MA to be in the safest possible range. Looking at potential breakouts the stock will need to break the 196.00 resistance to potentially move to 200.00-205.00 next. Second price target is 220.00-225.00. This is a high risk position due to the nature of short squeeze plays.
AMC Next Price TargetsAnalysis done on daily candles. It was just less than a year ago that the infamous AMC short squeeze took place and markets were introduced to a phenomena called “meme stocks.” A group of savvy traders came together and found highly shorted companies and began spreading the word to buy them up in order to force bears to buy back position to close out. We saw this same scenario unfold in the last week from AMC and GME, with AMC up more than 100% this month alone. Looking at AMC’s current position it can potentially rally further to 33.00-35.00 and a second price target of 38.00-40.00 if it can maintain the 24.50 support. The higher the stock climbs, the more bears will be forced to buy back positions so watch for strong buying volume if trading the stock, but don’t forget to constantly take profits as it pushes higher. It can be in a matter of moments that buyers begin taking profits and the stock declines sharply.

AMC projection going into wave 2 of 5NYSE:AMC
I see a possible scenario of AMC creating an inverse head and shoulders where it fills the gap at 20ish and then starts wave 3 and 5.
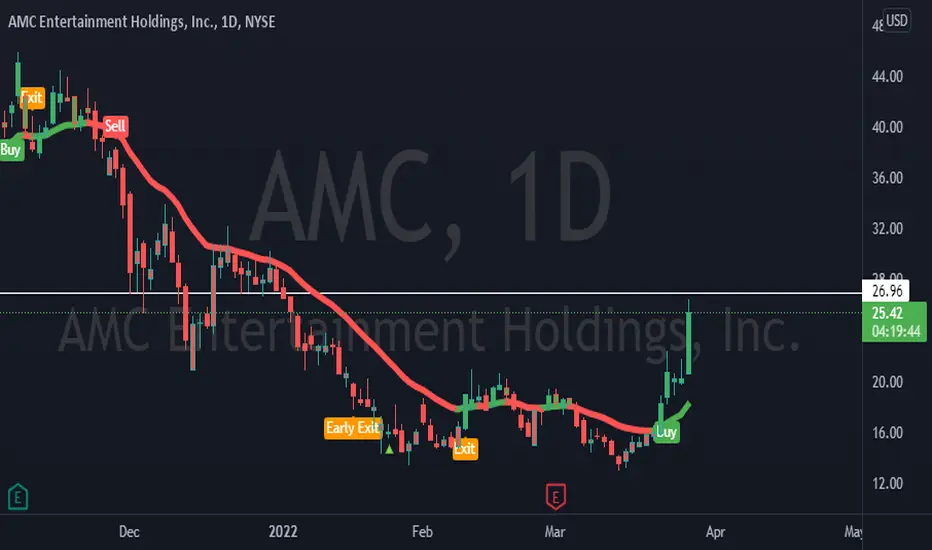
AMC Timeframe: Medium Term, Technical: Bullish <$31#AMC (Exited: Trendline, Entered: Bullish )
#Daily
#Technical Analysis
#crevixtrader

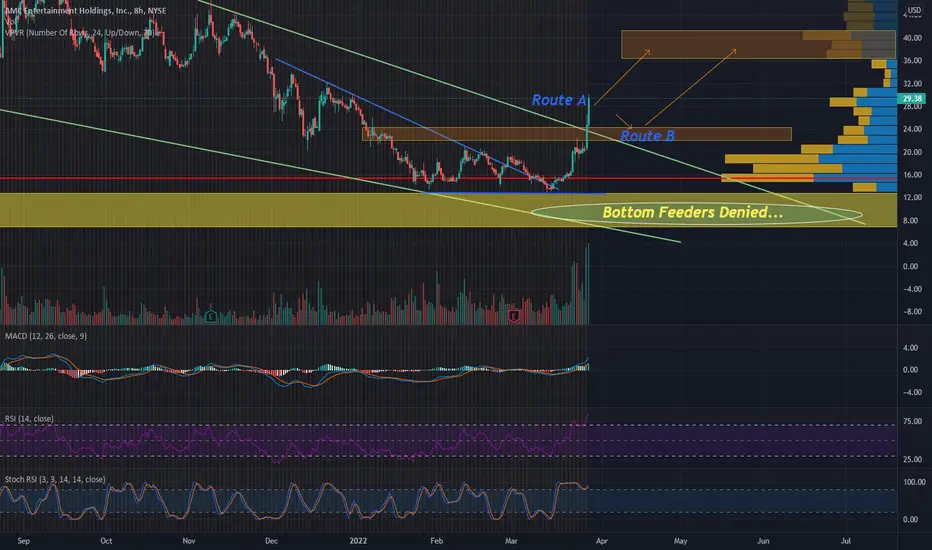
AMC - Interesting FormationsI regret not buying $12-13 AMC, I though perhaps there would be more buyers at $11-10 but boy was I wrong. What will happen now? Short squeeze asap (Route A)? Perhaps back test and then up (Route B)? Tough call, definitely seems bullish to me.
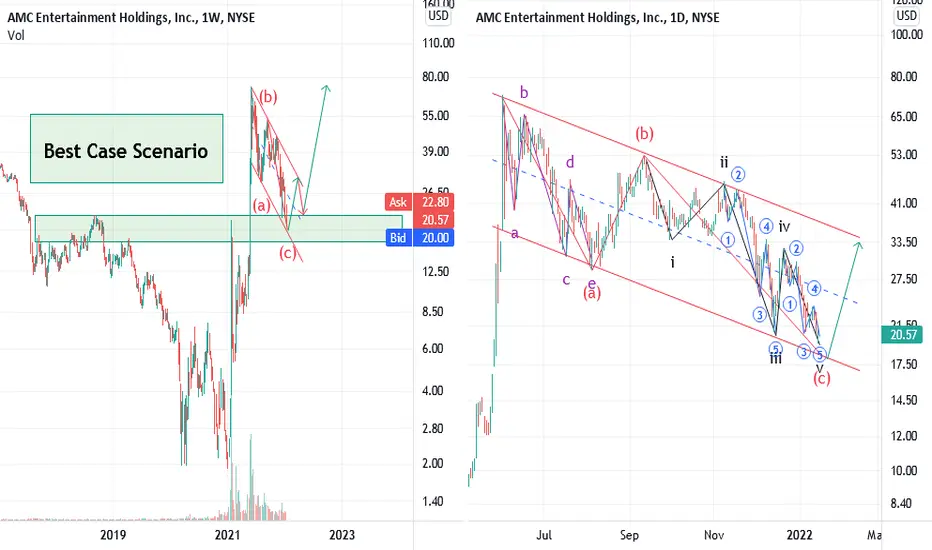
AMC, Major Update as promised on 4th Aug 2021 !(( Stopped out. Wave counting need a major update ! )) 4th Aug 2021
(( General trend is still down. There will be a considerable Up going counter trend correction . Then we will have another large down going wave . I will publish the update at appropriate time . )) 4th Aug 2021.
Above are my last two updates on the idea published on 15th July 2021 . We found a possible long setup (See related idea for detail), entered and stopped out and predicted the upcoming path accurately! We promised to publish our update in appropriate time and now its the time !
Weekly chart :
AMC's decline from ATH to current price can be beautifully charted inside a down going parallel channel in logarithmic scale. Decline shows an ABC form of correction which is almost completed while stock is reaching to strong support formed by the area of price action and different Fibonacci levels of different types . This area has been shown by a green box on the left side chart. Also ,Indicators in weekly and daily time frame are in oversold zone.
Daily chart:
We have a closer look to correction pattern shown on the weekly. Wave (a) can be decomposed to abcde components to form a leading diagonal . Wave (c) can be beautifully decomposed to 5 leg impulse down with wave iii and v to be 5 legs down themselves . As shown on the chart stock is completing its wave 5 in circle of v of (c) near the strong support.
Please note this is the best case scenario as emphasized on the weekly chart. It means there may be some alternative scenarios like this whole abc pattern being just wave A of and ABCDE triangle or next move up being just a connecting wave X or....( For different correcting forms possibilities see related idea published on TSLA if you are interested to get more details).
If this proposed best case scenario happens , It makes a new ATH and we can take the advantage of next considerable move up.
Good luck my friend.
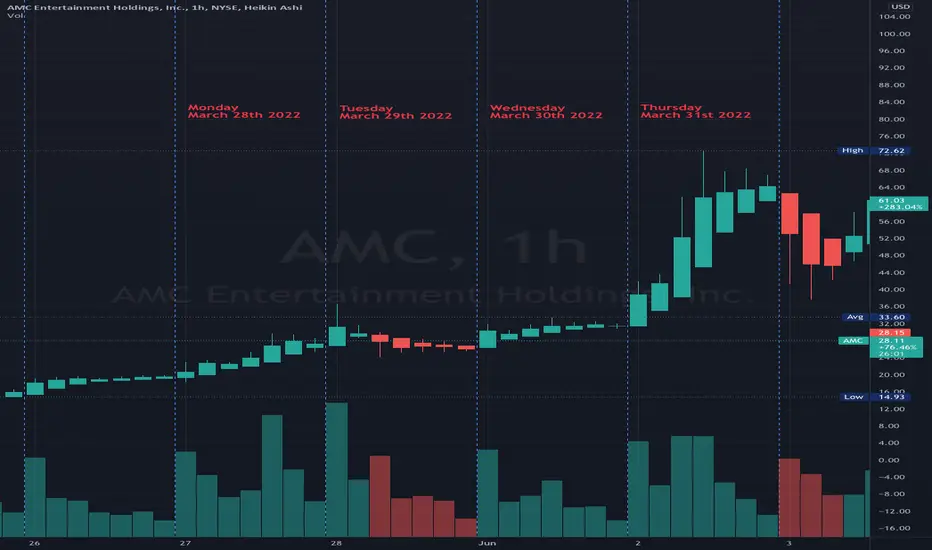
AMC Squeeze PredictionJust a quick chart comparing last year's run with this week's price action. If we are only looking at price action, one can assume we are in day 1 of 4 of a prior run-up cycle showing the top to be on Thursday March 31st 2022.
Not Financial Advice - Not a Financial Advisor - Entertainment Only
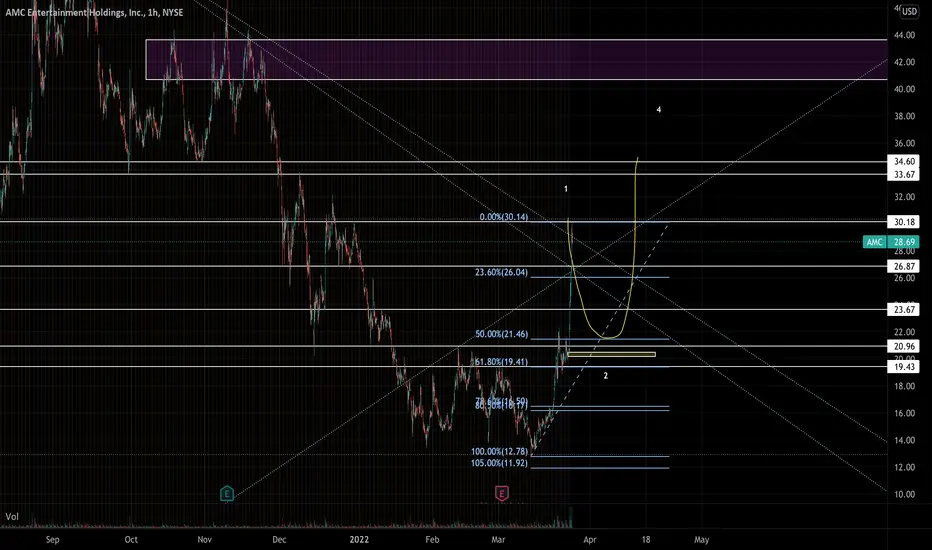
AMC Just Some CrayonAMC Entertainment has shown the bullish signal and the following points can be considered for the coming days.
1. 1st triangle has broken out and the current price at the time of writing this confirms.
2. Huge resistance at breakout point (1)
3. If it breaks out of point (1) and support zone established at point(2) then the price movement can be expected as per the chart.
4. Ichimoku cloud has crossed the leading span B as per today's movement and its out of cloud formation.
5. MACD line has crossed the signal line on a weekly chart.
6. RSI at 51 on a weekly chart.
Disclaimer: “The above is an idea only and not any kind of financial advice so please do your own DD (Due Diligence) before any kind of investment”.
If you like my TA & ideas!! Want to keep yourself updated with current market action,Please follow my profile for more analysis.
Thank You.

AMC take profit and do not hold$AMC the current Rally is nothing but just shorts covering their recent short positions which were initiated on January 01, 2022. Now there is no more move, and it's better to close your Positions in profit and take a safe exit.
AMC will go down from here.