#AMC - YOU TRIED, BLESS YOU ALL...Enjoy. For the record, i said back in Dec2020/Jan2021, that this wouldn't end well for the simpletons thinking social media terms like "diamond hands" and "hold the line" ever would have worked out, and thanks to Evergrande (3333.HK) and Inflation, its NOW time for those little slogans to REALLY get tested.
Lets see how "diamond" your hands are soon, when you're wife is blowing your neighbour for a can of beans.
as i said....Enjoy...
AMC

AMC calling out?my eyes see that AMC may be in a megaphone overall on the weekly. it's pushing hard this week at a support/resistance. if it can get above $20 and hold, i'm planning short term calls. learning to take what the market is giving me. what do you see.
WHAT I LEARNED ABOUT MEGAPHONES:
www.elearnmarkets.com
$AMC: Huge Potential of Upside!The market has been wild for the past couple of months. The economy is looking really bad which has caused the S&P 500 + other indices to retrace. This has brought selling-pressure to AMC causing it to trade in a large downtrend. Finally this downtrend has been broken. We made a quick push to get rejected by the 21$ level. This is a significant level for AMC due to the fact that we double bottomed at this level in December. The 21$ level is a large level of resistance confirmed by VPVR and selling volume. In addition we also had a green 9 (daily chart) on the TD-Sequential hinting for a retracement.
As of now AMC has made a deep retracement to the 7.86 FIb level. This level is a healthy long-term retracement. We have now confirmed a doubble bottom at this level. The VIX-Fix on the 4h chart indicates that we are at or near a bottom. Bullish Divergence is visible on the MFI which leads me to believe that AMC will have a retest of the 18$ level. The level of 18-20$ are large levels of resistance confirmed by the VPVR and the selling volume once reached. We also have a red 8 on the TD-Sequential on the 4h chart. The significance of the TD-Sequential on the 4h chart can be displayed while looking at previous trading days. Once a red 8-9 appears it indicates a bottom. The volume is also starting to pick up which is a good sign of reversal. For AMC to remain bullish we need to see a 4h close above 16.73 confirmed with good volume. We have to establish strong support at the 16$ level beacuse it is a large VPVR node. The EMA Ribbons are used as resistance at the 17-20$ level. When these are established as support AMC will look amazing.
AMC also has earnings in 5 days. This could get the stock price to increase significantly. The earnings are estimated to be positive which could be really bullish for AMC. If AMC beats earnings and the S&P 500 + other indices rise AMC will follow really well.
Looking at the options chain AMC will most likely be trading around 15.50-20$ this week. The most open interest is located at 20$ which is a good sign. Lower price targets are not in the cards for AMC by looking at the options chain. Most likely the week will close at or well above 16$.
*WARNING* This thread is not financial advice. I am not a financial advisor.
Thank you for reading.

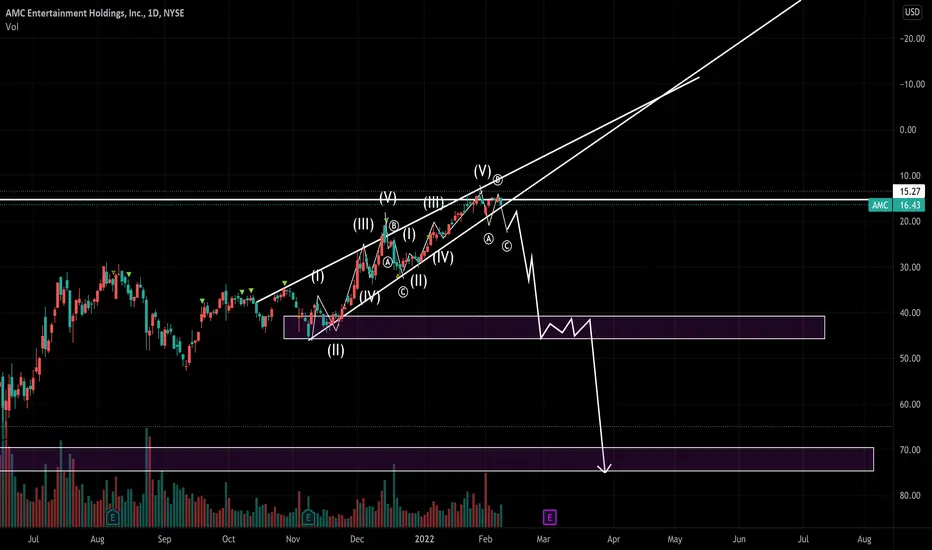
AMC - Nasty Double Top. All Eyes On SupportWhile NYSE:AMC broke out of 200EMA resistance earlier this month, things do not look good for longs currently.
We see a nasty double top on a strong resistance level, followed by a close below the recent upwards swing. We see both buyers and sellers trying their best to steer price levels to go either way, as seen from multiple dojis on a CRUCIAL support level. Whether or not this level turns into resistance, is anyone's guess.
Personally, I am looking to enter a short position once price falls through support and sets us up for a beautiful double top setup.
As with meme stocks, I would refrain from holding my position for a prolonged period of time in the event of an unlikely short squeeze.
Will be monitoring AMC closely today.
Happy trading

25$ END OF THE WEEKNothing has changed, Im still bullish on AMC. We got rejected of major resistance at 19.90 if we can break that and not come down then it will get interesting. 19.90 was tested over 1 year ago when we had our first squeeze.

AMC targeting $8 or breaking downtrend?AMC two different scenarios.
FIRST SCENARIO: WEDGE DOWN on 1 hour chart targeting $8.
SECOND SCENARIO: Braking downtrend and starting uptrend on 5 and 15 minutes chart. Also Cup and handle on the same timeframe chart.

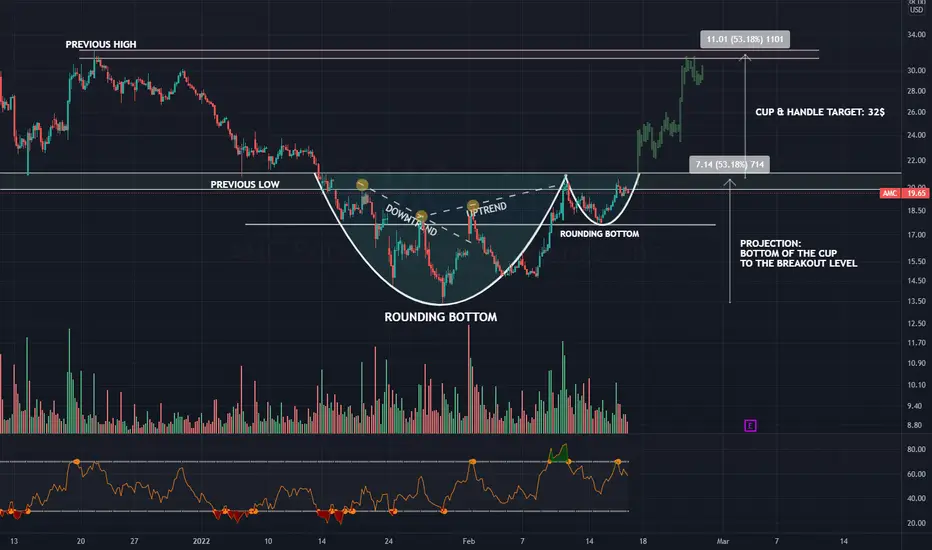
[WSB] AMC is moving in a Cup & Handel - Targeting 32$We're looking at the 1 hour chart for the AMC stock price and things look quite good after the recent drop in the whole stock market.
The previous downtrend was very intense and got extended by fear about inflation & the planned interest rate hikes throughout 2022.
We saw the market bottoming out about 3 weeks ago. While the whole market is retracing, we see different patterns emerging among the
many stocks we can trade. The AMC stock price is currently printing a Cup & Handle on the intraday chart.
We could've spotted the trendchange for the stock price with a "change of market structure", a very basic but powerful pattern (covered that in one of my videos extensively). The price is moving from lower highs to lower lows within a downtrend. As soon as we see a change of structure, the price will aim for higher highs and higher lows.
The circumstance is underlined by a rounding bottom, which forms the cup.
What we want to see is decreasing volume during the downtrend & increasing volume during the uptrend. This translates to the sellers being exhausted and the buyers being back in control.
The price is sitting right below a key level at 20$, which has been relevant for the past 5 years. We saw many support/resistance flips at this price level and the chances for breaking this level within the current upwards trend are pretty high. This price is the break-out level we're looking for.
During the past trading-days, we can observe the price being rejected at the 20$ mark multiple times. Still, buyers manage to push the price further in this direction - which increases the probability for the breakout. I'm also expecting this price level to be an important support during 2022.
When we're looking for a target projection for the Cup & Handle pattern, we measure the decrease in price from the breakout level to the bottom of the Cup (53.18%). We use the same size to project a target from the breakout level, which brings us to 32$. Coincidentally this price is also our previous high from December 2021 and the starting point for the downfall. We can expect some sell pressure there (traders breaking even or taking profit).
I'm expecting the price to aggressively move towards the 32$ level within the next 3 weeks. Those 3 weeks are leading to the earnings, which are expected to be better than the forecast. I don't think that this is priced in yet and especially short-term traders will join the train for short-term gains. This additional momentum, combined with the option market/ shorts being liquidated, will fuel the upcoming breakout.
Looking forward to it! I'll keep you guys updated.
AMCAnalysis done on hourly candles. A year ago around this time AMC was gearing up for one of the biggest short squeeze moves in its history, bringing its share value to a high of 72.00 at one point. Since then however, AMC has been on a consistent decline along with other short squeeze "meme" stocks like GME. Short squeezes occur when companies have a high number of investors / hedge funds selling their shares "short", in layman's terms this means they're borrowing to sell shares at a higher price and plan to buy them again at a lower price and keep the difference. AMC holders are still hoping for the day to come in which another short squeeze takes place, but the timing of when it will happen is nearly impossible to tell. AMC currently has a 22% short float, which makes it a solid contender for a squeeze. Looking at the company itself, AMC is not company that suggests any robust growth in the coming years. Their upcoming earnings may be boosted from Spiderman's astonishing box office numbers, but overall it's not one that's recommended for a long term investment. The short term may bring about a short squeeze if its breaks above key levels, especially if they get a strong earnings catalyst to boost them.

ANY MOMENT NOWAMC is Looking to breakout of the 21 dollar level. I believe a lot of volume will be back once we break it. Im thinking it will happen this week

AMC Entertainment bounced from the supportAfter a perfect touch of the strong support area:
AMC bounced back to the resistance.
The option market has mixed feeling about this area, slightly bullish though.
I think it`s a good consolidation range for accumulation.
Looking forward to read your opinion about it.

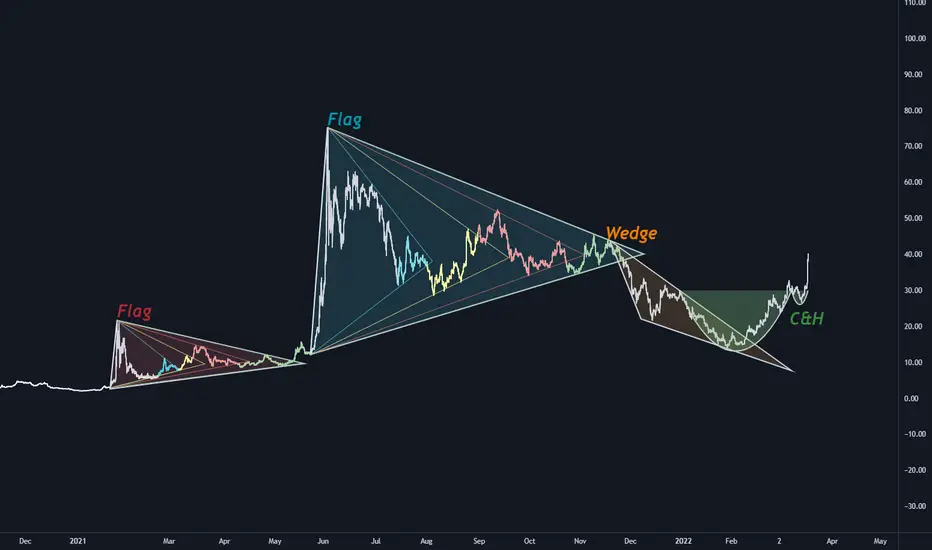
AMC - The Next Phase (Cup & Handle)A possible scenario using option expiration dates and delta hedging.
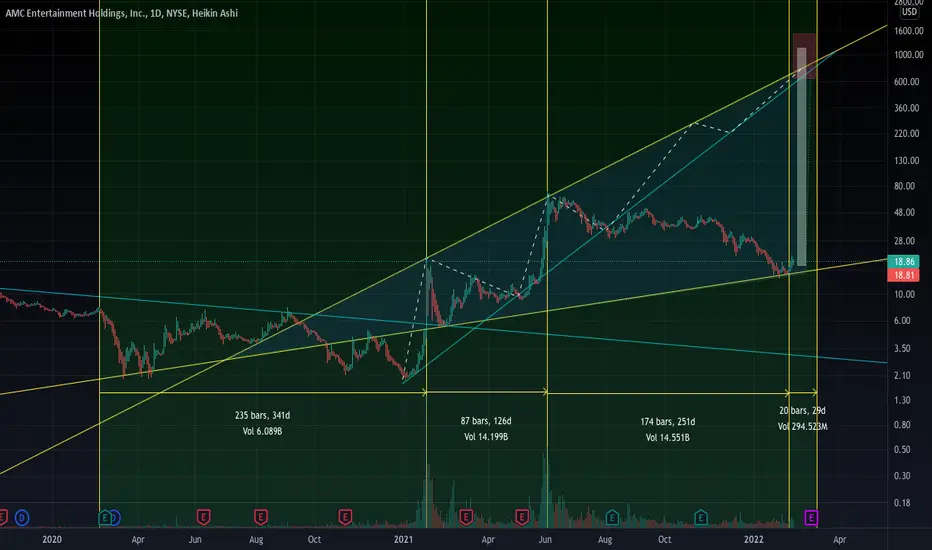
AMC SHORT SQUEEZE FINALLY OTW? If we take a look at the Jan-May cycle we can calculate the amount of days it took from the first squeeze to the second. So from Jan 27th - June 2nd was 87 trading days. In that cycle, the bottom happened a few days after the squeeze. The cycle we are in now from June 2nd - now, the bottom has been placed exactly 2 times of 87 so 174 trading days after. If you look at the volume for each cycle, you realize it took 87 days trading days to get 14 B in volume in the first cycle. Well in the second cycle it took 174 also the double amount of trading days. IMO the bottom is in for AMC I think some wild days are coming soon for memestocks.
Almost back to weekly support!! Not a Financial Advice !!
In the last post (linked below) I explained why it is important to regain the weekly uptrend.
I have seen crazy numbers about AMC. The exchange reported short interest sits above 20% for the past days, the utilization is almost 100% (all the shares that can be used to short the fook out of AMC are already burrowed out) and the earnings peek preview looks to be good,
I am pretty positive. I hope we can win against the hedgefooks

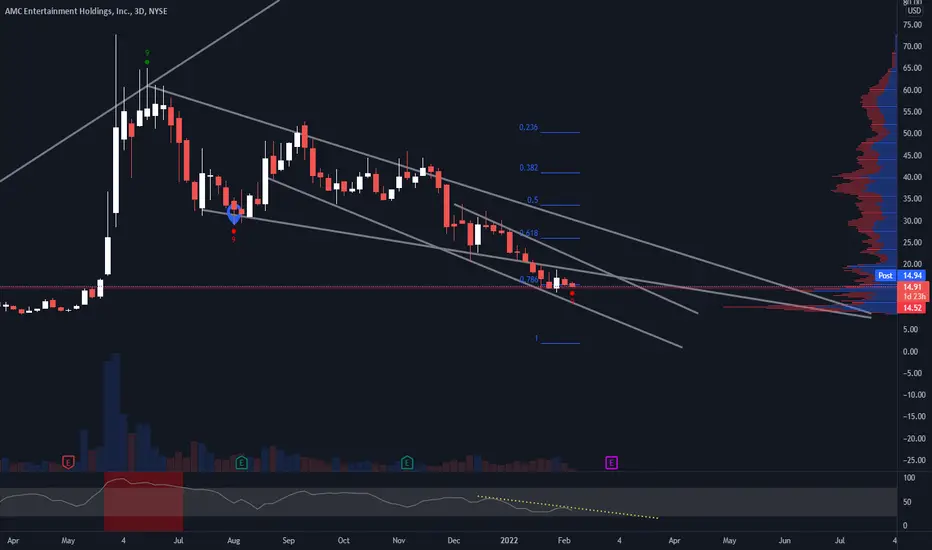
$AMC: 600% Gains Incoming!AMC has had a wild week. I managed to open a long position on 14.85$ which was basically the bottom of AMC. Since that we have broken this large descending wedge. This break is confirmed with a large amount of volume. This volume was significantly larger than previous trading days which is a good indication of bullish action.
As of now we are in the making of a Bullish TK-Cloud below the Ichimoku Cloud on the daily chart. Last time this happened was before the run-up of May 2021. This movement was around 600% from the TK-Cross. A confirmation of this TK-Cross is made when AMC closes a daily close above 20$. This needs to happen with 100M Volume + to be confirmed as a valid move. This will cause bullish calls to get ITM which will bring bullish price action to AMC.
We also managed to mount a strong support level at 18.2-18.4$ level. This level is supported by a massive VPVR node. This level was previously being held as strong resistance. This level has now turned into a support. On the micro time frames this level has been respected with significant volume. A break of this level will make AMC retrace to lower levels once again. Personally I have confidence in this level due to the fact that it has bounced the price throughout the day.
We are also overbought on almost all of the Micro time frames. This could cause AMC to retrace to the 7.86 Fib which is located at 17-17.2$. This would be a quick move which should bounce the price above the large VPVR node at 18.2.18.4$. This retracement could happen to cool down the MFI which has been increasing a lot.
One thing to be aware of is the emergency fed meeting on monday. This could cause the market to retrace which would make AMC follow the downrend. If the fed meeting is a "relief" for the investors the indices should be fine and bounce.
*WARNING* This thread is not financial advice. I am not a financial advisor.
Thank you for reading.

AMC TECHNICAL ANALYSIS - RIGGED GAMEIf we cannot break over $21, we will continue our descent down to the lower part of this descending triangle.

Important Buy Signal Flashing for AMC!Hey Traders,
As you can see on the Daily Chart of AMC. A Technical Indicated a BUY. Historically these Indicators work very well among stocks, crypto, and forex. Even in the past of AMC stock, the BUY signals were great for this. However there is a chance I am wrong and this keeps going down, maybe take this to start DCAing. AMC's target for the recovery is $50 (Fibonacci Golden Pocket). We can put in calls/ longs to be in massive profits!
Safe trading,
-Pulkanator

$AMC Upside - Slow GrindAMC starting to get "some" wind back in the sails. This could be based on "hype" from press releases and upcoming optimism on the earnings coming due with about 3 weeks.
AMC has been issuing a plethora of bonds, so that is something else to keep in mind when it comes to Coupon Payment Dates and Maturity Dates.
For me, AMC is boxed in between the $12 - 20.00 with a "next level" target of $22-$23. BUT there will need to be extreme bullish pressure to break-through those levels.
Overall, it appears AMC is going to take more "time and price" which may require the pace of the upside movements to take a slow stair stepping pattern.

Easy 80% move to the upsideI don't know if AMC will make a new high, although I think it will, still this is a nice trade as I believe it will retest the breakdown level and the 2015, 2017 high which is a nice 80% higher. Would set a stop at $17 range. GL friends. Please follow.

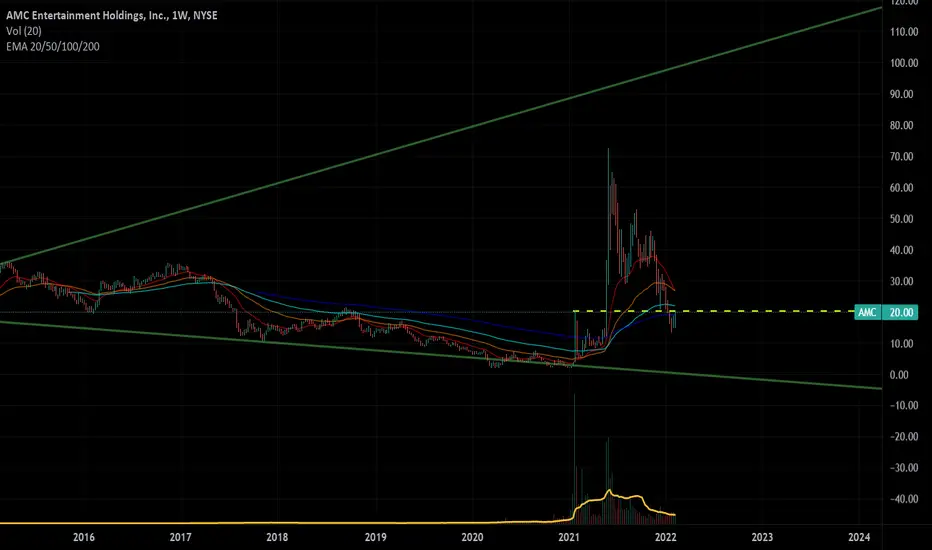
AMC targets, and chart upside down NYSE:AMC
amc looks like a distribution pattern when it is flipped around. Also elliot wave theory shows that it possibly has finished its correction and is ready to begin another impulse.
TARGET 1: 40
TARGET 2: 72
TARGET 3: 115
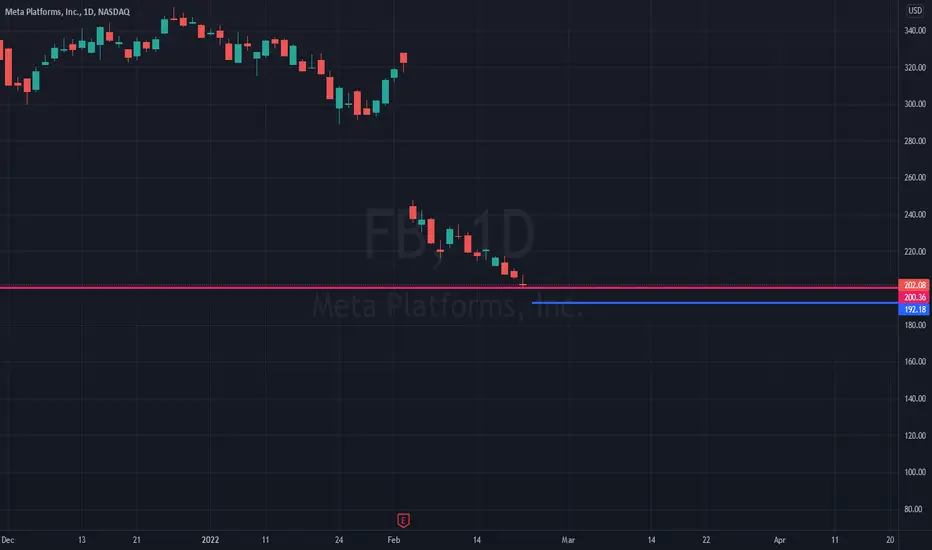
$AMC to the moon pt.2 ?? Is the ape army back?? LONG SetupI really like AMC here.
Came back beautifully to the 88 retrace of a major harmonic structure.
RSI looks like its ready to go, too
Easy risk management possible
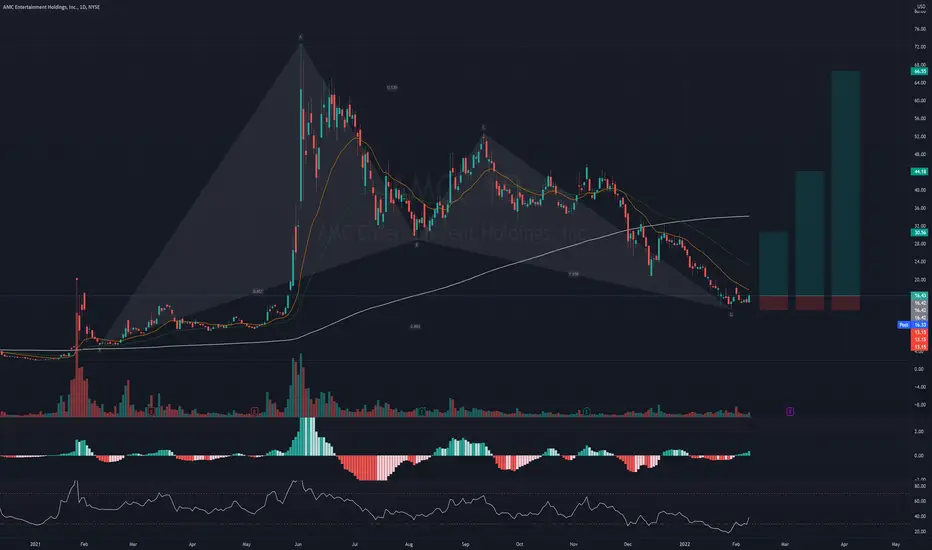
$AMC: Rocket Ready to Launch!On the 3D chart of AMC we are forming a red 9 on the TD-Sequential. This finishes in 2 trading days. We can wick below the 14$ level to grab more liquidity. Although buyers seem to appear at this level. This is supported by the large VPVR node that is located at 14.5-15$.
MFI is in a downtrend that has a tendency of breaking out. We are mounting the .786 Fib which is a sign of strength. A close below 14$ would be really bad and it is most likely not going to happen. For the upswing we need to see a clean break of the 18$ level. This is a large level of resistance confirmed by a trendline that consists of 11 touch points making it valid. We also have a negative channel building resistance at 20$ with 5 touch points making it a valid pattern. The 18-20$ level are large nodes on the VPVR which indicate that there is a lot of selling pressure to be found at these levels causing AMC to retrace. These levels are really important to reclaim for the reversal of AMC. A break above 20$ with a significant amount of volume will be a great sign of reversal.
Last time we had a red 9 on the TD-Sequential AMC had a rise of 80%. If this occurs once again the options activity will become crazy. A lot of bullish options will get in the money which will help AMC to break this insane downtrend and reverse. Most likely the pain on AMC is over. A lot of reversal signals are to be found in this chart. A break of 14$ is not a likely scenario.
We will have to check what the options look like mid-week to be able to predict the price of AMC. Options below 14.5$ have really low open interest and volume which is a good sign that AMC wont break this strong support level.
The only thing keeping us down is the overall market making large retracements which brings selling pressure to AMC. When the S&P 500 becomes stable and starts reversing AMC will follow.
*WARNING* This thread is not financial advice. I am not a financial advisor.
amc potential bull trendim not a complete AMC perma bull but for another short squeeze type scenario to play out, this isnt too bad of case to suggest may happen
