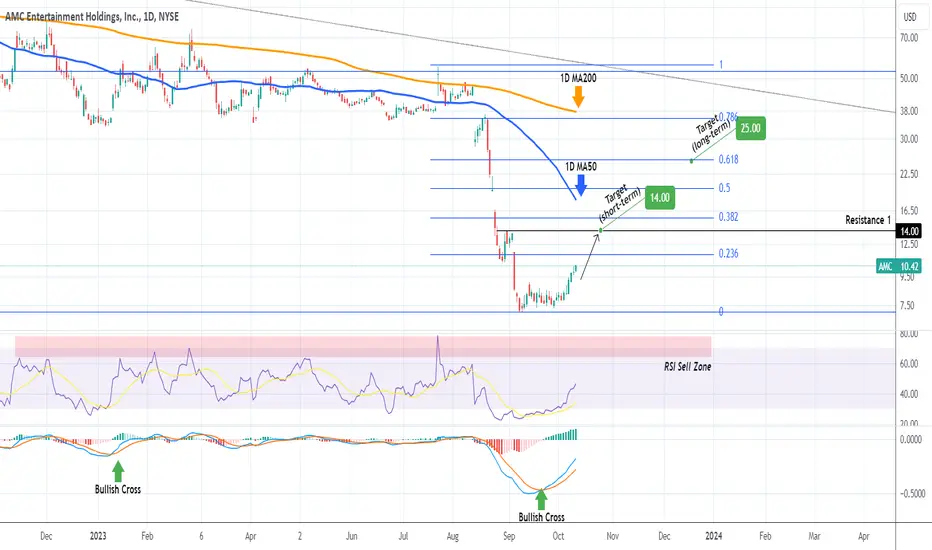
AMC Already up +30% since our buy call. Still hold?AMC Entertainment Holdings (AMC) went up yesterday +30% since our buy signal 2 weeks ago (September 26) as it rose from $8.14 to $10.52 (see chart below):
Our long-term target remains $25.00, which is under the long-term Resistance of the 1W MA50 but what to do on the shorter term? The 1D RSI just turned neutral at 46.37 while the 1D MACD is on a Bullish Cross but still under the 0.0 mark. Those two indicate that there is still more upside left to this 2-week rally, which was to be expected considering the previously oversold condition of the time-frame.
As a result, the short-term target is $14.00, which is exactly on the Resistance 1 level and where the 1D MA50 (blue trend-line) is headed to. Complimentary to that, the 1D RSI has a clear Resistance Zone for selling purposes. If it enters it before the price hits 14.00, we may consider taking the profit earlier.
-------------------------------------------------------------------------------
** Please LIKE 👍, FOLLOW ✅, SHARE 🙌 and COMMENT ✍ if you enjoy this idea! Also share your ideas and charts in the comments section below! This is best way to keep it relevant, support us, keep the content here free and allow the idea to reach as many people as possible. **
-------------------------------------------------------------------------------
💸💸💸💸💸💸
👇 👇 👇 👇 👇 👇
Amcsignals
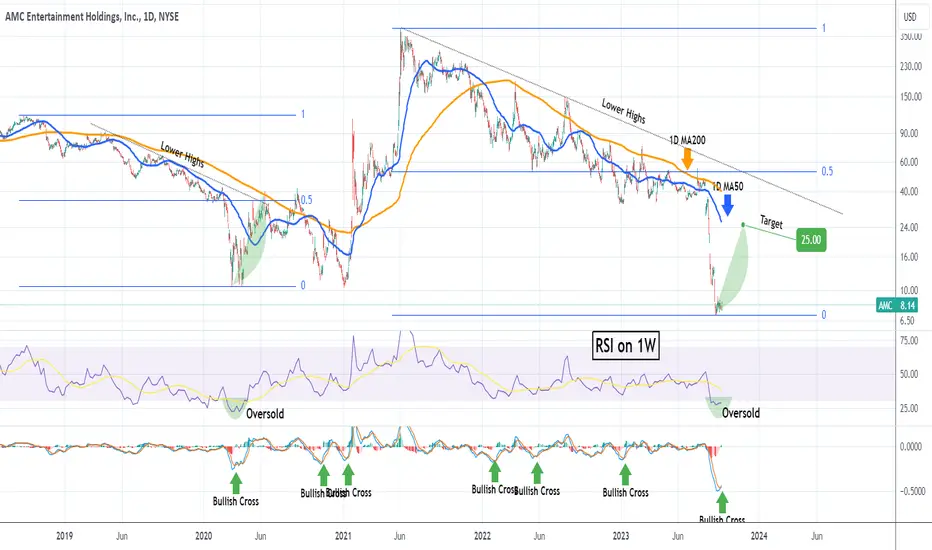
AMC Forming a bottom. Huge investment opportunity?AMC Entertainment Holdings (AMC) has been trading sideways for the past 2 weeks following this month's bottom after the August price drop. The 1D RSI turning flat in oversold territory while the 1D MACD just formed a Bullish Cross marginally above the -0.500 level, the deepest it has ever been historically.
The above setting is an early call of a long-term bottom formation. A similar pattern, Lower Highs price sell-off into an oversold RSI and Bullish Cross MACD can be seen on AMC's previous market low during March 2020. The price then recovered, hitting both the 1D MA50 and MA200, extending as high as the Lower Highs trend-line. As a result, we consider the current levels a sound investment, targeting at least $25.00 (projected contact with the 1D MA200).
-------------------------------------------------------------------------------
** Please LIKE 👍, FOLLOW ✅, SHARE 🙌 and COMMENT ✍ if you enjoy this idea! Also share your ideas and charts in the comments section below! **
-------------------------------------------------------------------------------
💸💸💸💸💸💸
👇 👇 👇 👇 👇 👇
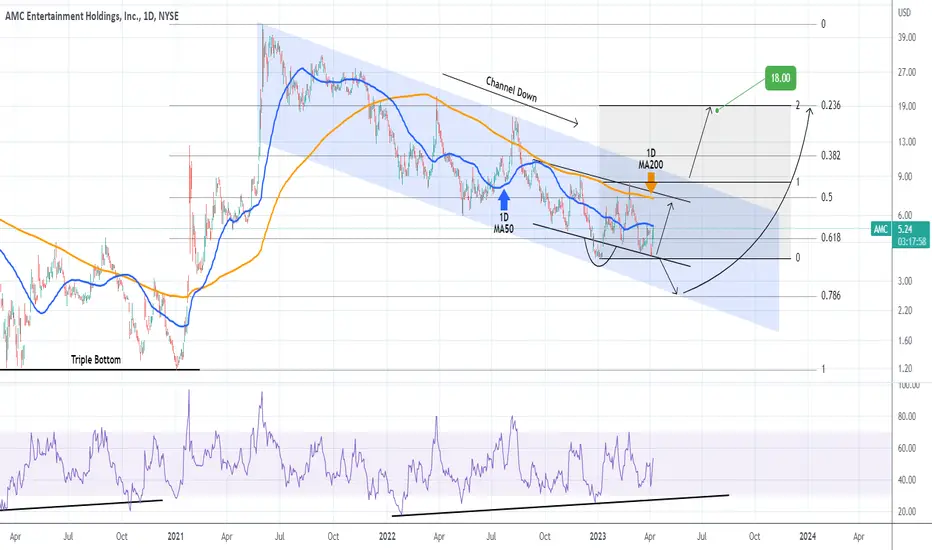
AMC has enormous upside. Target $18.00.AMC Entertainment Holdings (AMC) is testing its 1D MA50 (blue trend-line) today, on a potential completion of an Inverse Head and Shoulders (IH&S) pattern. The long-term pattern is a Channel Down, but the closer it gets to the 0.786 Fibonacci level, the closer to its exhaustion is, being almost a 2 year pattern. Our target is the 2.0 Fib extension of the IH&S at $18.00, which happens to be on the 0.236 Fib of the January 2021 Triple Bottom.
-------------------------------------------------------------------------------
** Please LIKE 👍, FOLLOW ✅, SHARE 🙌 and COMMENT ✍ if you enjoy this idea! Also share your ideas and charts in the comments section below! **
-------------------------------------------------------------------------------
💸💸💸💸💸💸
👇 👇 👇 👇 👇 👇