Semiconductors Finishing Consolidation for Next Move UpSemi's are ready to move after a long consolidation. This is a big signal for Nvidia that is likely to lead and significantly outperform.
Good luck!
AMD-MU

Is NVDA the catalyst for the market?NVDA just had a bearish crossover of the 20 & 50 MA (Daily chart)
Last time we saw this bearish moving average formation was in early August.
NVDA proceeded to fall sharply in the coming days.
All eyes on the market leader. All eyes on the QQQ.
Will the Q’s be the demise of SPY?
If Nvidia sees anymore weakness you can be sure it will have other semis following suit.
Risk to reward in the near term is clear.

Is NVDA done correcting? LONGNVDA shot up on earnings two months ago and more or less went sideways until
mid July when it trended up for a week and then reversed downward.
On the 2H chart, I have placed both a VWAP anchored to the earnings date as
well as a volume profile. Price is currently above the 0.5 Fib level as well
as at one standard deviation above the mean VWAP and above the POC line of
the volume profile. The mean VWAP and POC are confluent at about 422.
I suspect that it is at this level that volatility will be the highest and at where
buyers will step in to open a trade shares of NVDA that have been oversold
and are undervalued. Because of that, I will place NVDA on my watchlist for
a long trade when it trends down approaching 422. The stop loss will be
418 or about 1% while targeting the recent double top of 475 and so a zone of
horizontal resistance confluent with dynamic resistance in the red line of
two standard deviations above the mean VWAP. Confirmation of an upcoming
reversal is the histogram of the zero-lag MACD going red to green. NVDA has
had a great run this year (220%) and its heavy presence in the AI megatrend
bodes well for a good continuation.

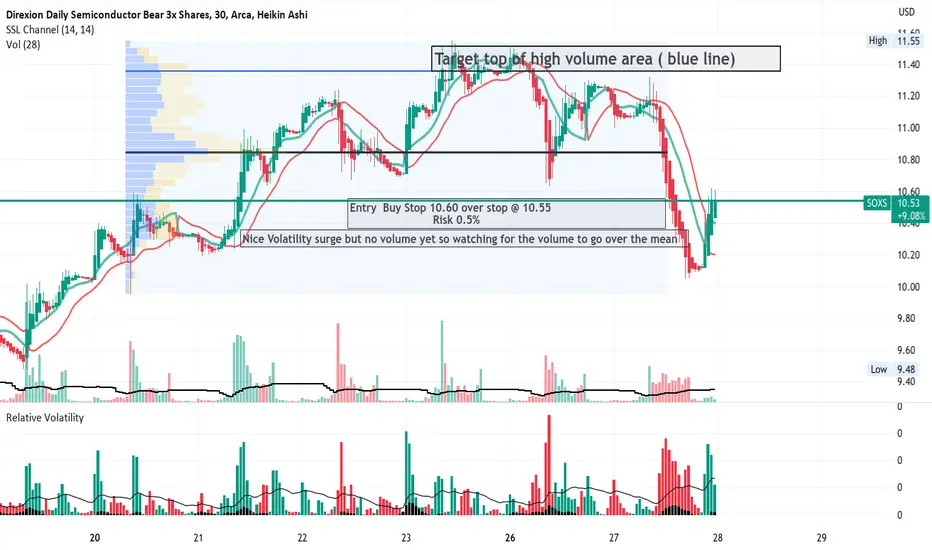
SOXS Bearish Leveraged semi-conductors ETFNVDA turned down today while SOXS rose a bit. On the 30 minute chart is shown to have
have been trending down but then reversed in the after-hours trading period albeit with
the low volumes typical of after-hours. The relative volatility indicator however showed
a dramatic reversal and will be beyond the moving average within the indicator.
Overall, I see this as a day trade for June 27th. I have marked out a tight stop loss to minimize
risk. This trade which I will enter in the premarket is expectant for 8-9% profit and so
a reward to risk of 15:1
PATH - Rising Volume Lifts PricesOn the 4H chart PATH was on a trend down in April. The strength momentum ( green band) was
in a narrow range. In May as can be seen on the indicators, both volume and more especially
volatility have increased significantly. The chart pattern is now that of an upward facing
megaphone reflecting the volatility. The strength momentum band is much wider. Price
is above the POC line of the volume profile reflecting a bullish dominance. Fundamentally,
PATH is a player is the exploding AI subsector. Cathie Wood is quietly accumulating shares for
her ETFs as are many other large portfolio investors. In summary, PATH appears to be
an excellent long setup. Sitting in the shadows of NVDA, MU, TSM and others whose focus is
hardware, PATH provides software and services it. Its path to hypergrowth and so price
appreciation appears to be abundantly clear.

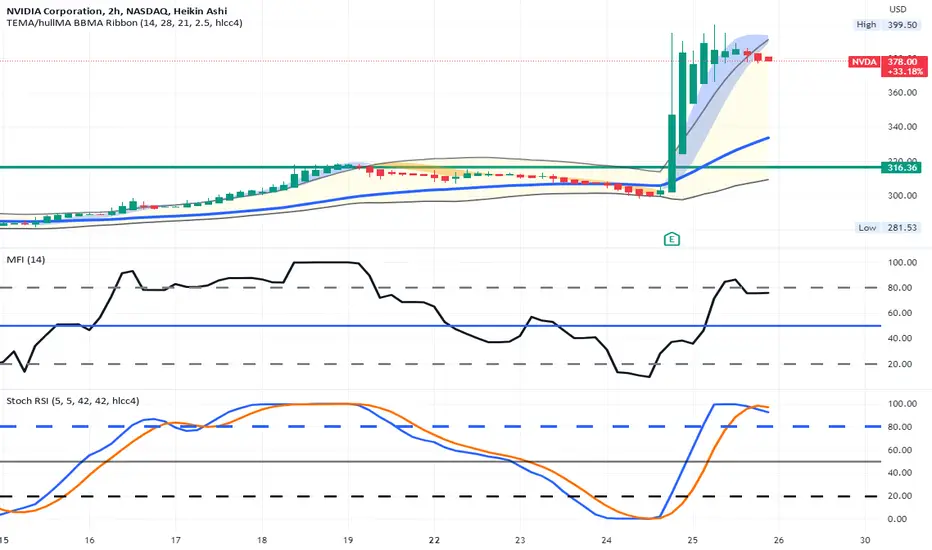
NVDA can it fall from the ceiling after EarningseOn the 2hr chart, NVDA popped from earnings over 20% putting with a PE Ratio sky high
on the promise of semiconductor heaven and AI ecstasy. Can it stay there ? Will it lead
other technology companies ( semiconductors / cloud services / AI et cetera) higher
as well ? Is it now overbought and looking at a glass ceiling? The indictors suggest a near-term
top, I think. ( Money Flow Index. Stochastic RSI ). Accordingly, I will buy put options
striking $ 400 for expiration 7/21 and be quick to take profits expecting NVDA to
equilibrate in less than a week. In th meanwhile, I will hdege by keeping my AMD
and MU call options open figuring that they will jump up as copy cats of this move.
I will cut them loose as soon as price action and a loss of volume suggest retracement as well.
I see buyers who got in late with high FOMO to be the lad sellers fueling the put options
into easy profit.
NVDA possible Breakdown before EarningsNASDAQ:NVDA
NVDA on the daily chart appears to have formed a flat top triangle
with the trendlines drawn onto the chart. Price appears to
be falling outside the ascending support line before upcoming
earnings. Will NVDA rise to regain support or breakdown further?

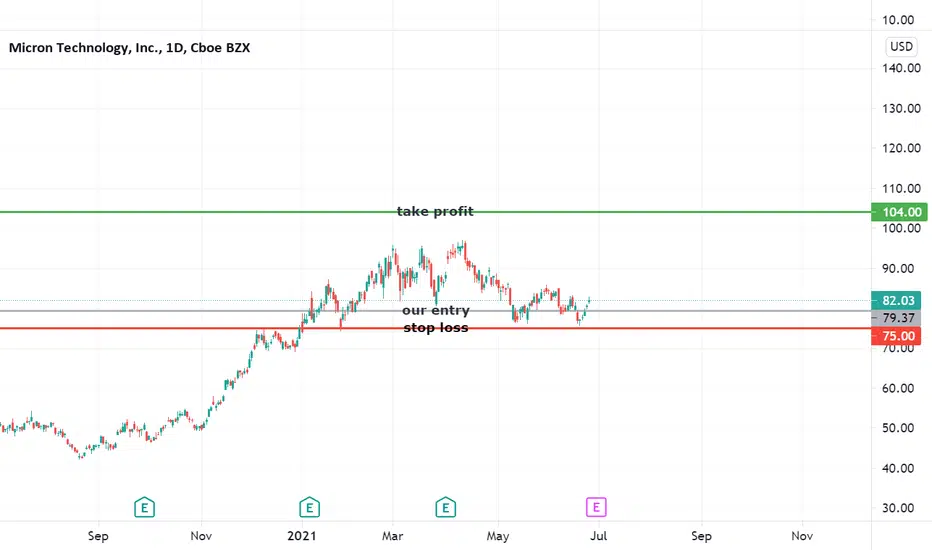
$MU June Update *This is not financial advice, so trade at your own risks*
*My team digs deep and finds stocks that are expected to perform well based off multiple confluences*
*Experienced traders understand the uphill battle in timing the market, so instead my team focuses mainly on risk management*
Recap: My team has been analyzing $MU for the past few months. After consolidating in the $74-84 range for the past few weeks we finally believe that $MU is ready to take its leap to go past $100. Investors should expect $MU to uptrend similarly along with other semiconductor companies in the near-future due to tech rebounding.
$MU is releasing their May quarter results on 6/30/21. My team remains just as confident as before in $MU and expect stock price action to benefit from this report.
My team entered $MU on 6/14/21 at $79.36 and still plan to take profit at $104.
Entry: $79.36
Take profit: $104
Stop loss: $75
If you want to see more, please like and follow us @SimplyShowMeTheMoney
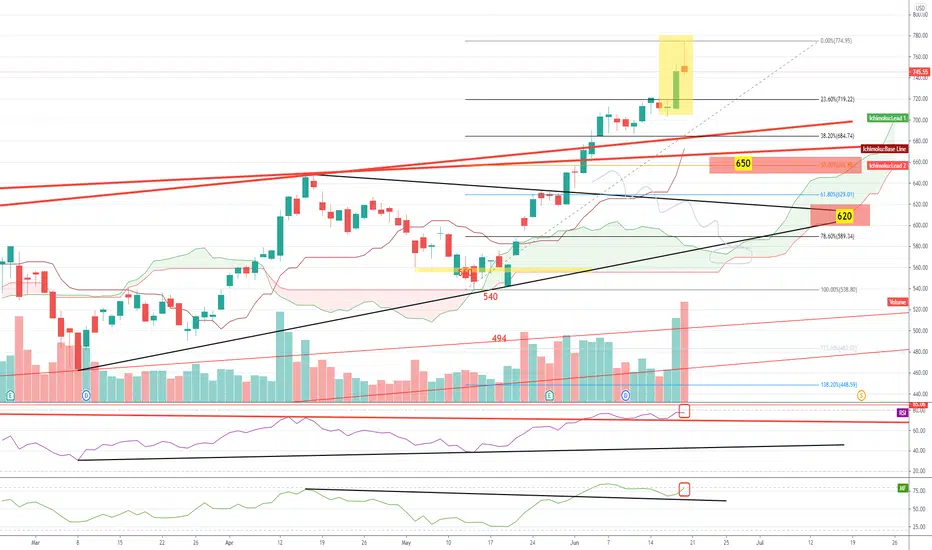
$NVDA Bearish candlesticks pattern targeting 650 620Shooting star or big doji its bearish pattern on daily candles - Bearish signal can be triggered below 720 - Overbought indicators - Expected Split at 20 Jul so its risky trade to short prior to the split process but technically its overbought and can be corrected to the level of previous major breakout levels. cancel short idea above ATH Only!


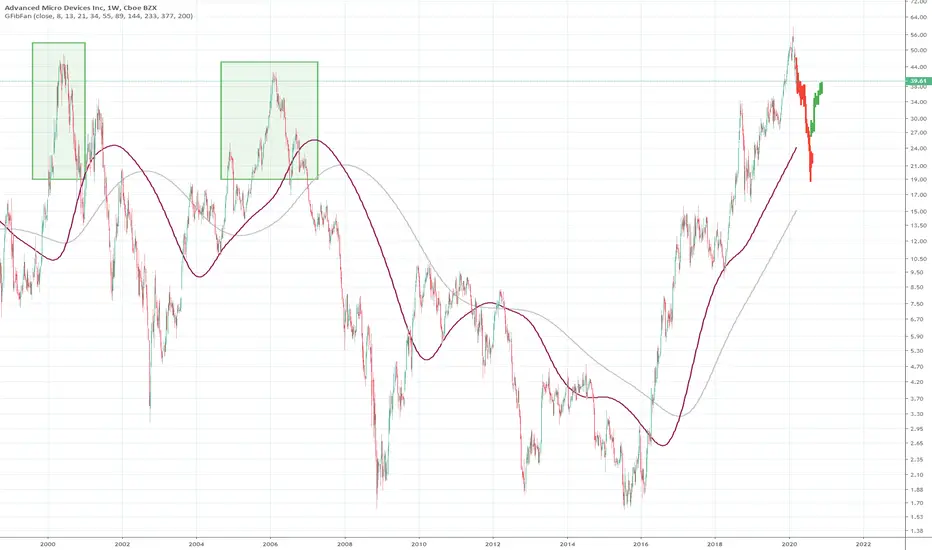
AMD fractalAMD one of the first stocks i traded, showing signs of a repeating H&S pattern, i likely return to the purple fib line before right shoulder is established, nice short. It goes against the momentum of the momemtum of the MA on the Monthly chart but i think a H&S squeeze can be fit in. Strong mirror resistance level at the top of the three peaks can be seen.
Midterm #RetraceDirectional Bias: Short
Price Target: 7140-7160
Good Entry: 7000-7020
Risk/Reward: Max Risk of 30 points/Potential Reward of 100-130 points
If target is reached on the idea titled "Some NQ Loving", it would present a good opportunity for a little retrace. Given how weak AAPL is, a gap fill type move isn't out of the question.

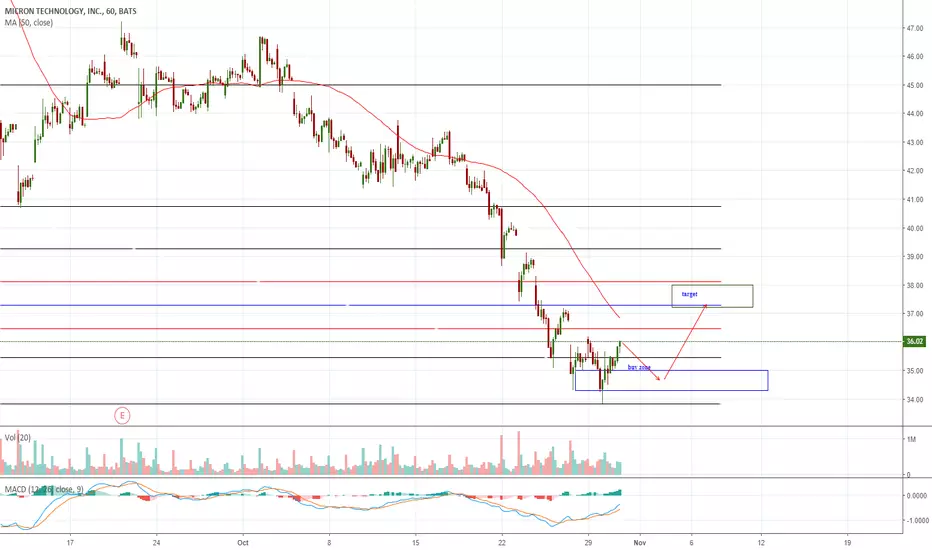
MU - Time to BounceDirectional Bias: Long
Price Target: 37-38
Good Entry: 34.3-35
Risk/Reward: Max Risk of $1 (trade idea invalidated below 34.3 15 min candle close)/ Potential Reward of $3+
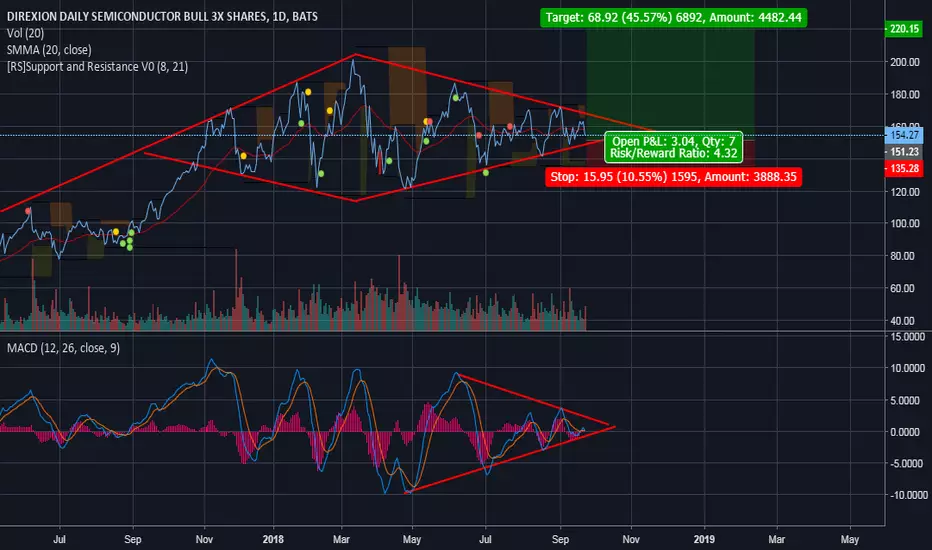
SOXL 50/50 Well A multi year flag? A big move is coming, My gut has been telling me to Buy TVIX or UVXY and DRV as my gut is bearish, no doubt SEMI's are not going anywhere, but the overall Bull market run tells me we are due for a shocker sometime soon, DRV soon looks to be profitable.
Micron Brief ($MU) For a brief overview and risk see:
drive.google.com
Micron has been a solid value play for the majority of the 2017 tech run and I think it's worth looking at the current standing and valuation as of current, should you choose to stay long tech into 2019.
Micron had a $2.5 EPS just 90 days ago with a PE of just over 8. MU reported FQ4 guidance Rev/EPS @ 8.2bn / $3.30 substantially higher than expected nearing 8bn / $3.1.
As expected, MU outperformed AMD with DRAM up 6%, "Hyperscale" applications up ~30% q/q and seems to be able to meed the N AND expectations of 45% y/y.
After looking at the current standing, I do feel like the is still room for MU to grow, at least into FQ2/FY19. Trading at 4.78x PE and 5.0x EV/FCF, the valuation isn't as overheated as the rest of the major tech plays - and is actually very appealing. Q3 is to turn MU net cash positive and there is to be a ~1bn buyback in September.
I also feel like CapEx and operational, investments are being implemented fruitfully with 'incremental cleanroom space' in Hiroshima, Japan, which will be available for production at the beginning of calendar year 2019 For FY2018, with expected capital expenditures to be in the upper end of previously guided range of $7.5 billion, plus or minus 5 percent.
-DRAM outlook is still looking good with 19% in DRAM shipments.
-64L Bit crossover completed one Q ahead of schedule.
i.magaimg.net
However, its important to consider the cyclical nature of semiconductors:
The DRAM and NAND Flash business is cyclical in nature with each cycle comprising of four phases:
- Increased demand, high profitability: Market is in under-supply with strong pricing and hence, high profitability. Profits are spent on capacity addition, with increase in supply after a period of 8-12 months.
- Oversupply and losses: Market is marked by oversupply and falling ASPs. Focus is on driving cost efficiencies.
- Continued oversupply, losses run deeper: Demand is pushed a little higher due to price elasticity. ASPs continue to fall and approach cash cost levels. CapEx is delayed and fabrication units are run at lower capacity.
- Supply correction, return to profitability: Reduced supply leads to correction and demand sufficiency. ASPs see correction or possible rebound while costs continue to decline. CapEx spending starts again.
The market was in the continued oversupply and losses phase till 2012, but entered the correction and profitability phase in 2013. The market is now in the supply correction phase, and the demand is both DRAM and NAND Flash is expected to outpace supply in the near future
Quoted SOTP valuation metrics put MU at $64 - 70 and street expectations near $80 with higher interval ranges nearing $90. I am staying long the stock but expectations remain low due to the possibility of the Chinese "market access liberalisation" policy, tariffs on Semi's and concerns regarding the flash/chips pricing structure and whether the major players have been inflating prices.
Tim Arcuri's comments are worth considering with a discount, however the probability of a large scale correction in memory is rather low, especially in the short run.
"chip memory is replacing disk in both clients and servers, and it has become cost-efficient for cloud."
I do think the street is correct on this one, however I would be pleasantly surprised if MU reached Stiful's Analyst's Targets at @ $106.
I may post a model later.
