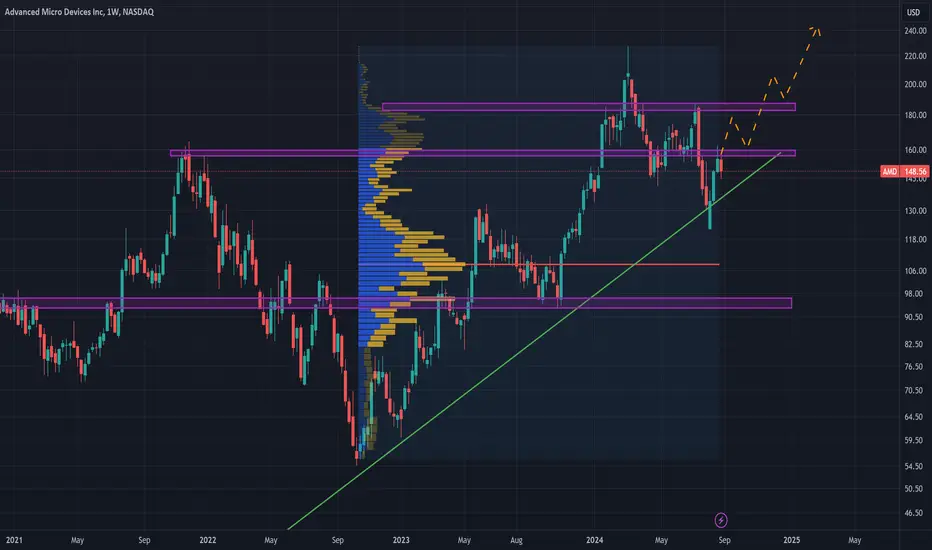
Technical Analysis on AMD (Advanced Micro Devices)Analyzing the historical performance of AMD , a key turning point is evident that marked the beginning of the current bullish phase—starting at the end of 2015. During this period, the stock held an important support level, followed by a decisive breakout of the bearish trendline.
On a daily timeframe, this breakout was accompanied by a gap up, known as a breakaway gap.
During the upward phase, the stock experienced pullbacks ranging from 40% to 60%. The most recent pullback, which began with a Shooting Star candle, was 45% and stopped precisely at a crucial Fibonacci level of 0.618.
Bullish Scenario:
To confirm a continuation of the bullish trend, AMD must first surpass the $160 area and then the $190 area, a range characterized by significant volumes.
Bearish Scenario:
If the stock fails to exceed these two levels, it could continue its retracement by breaking the ascending trendline. Two potential entry levels can be found in the POC area around $180 and the support area around $95.
AMD
Nvidia Stock Soars On Blowout GuidanceSoaring demand for the chips needed to train the latest wave of generative artificial intelligence systems such as ChatGPT led Nvidia to issue a revenue forecast far ahead of Wall Street expectations, prompting a surge in its stock price in after market trading.
The US chipmaker on Wednesday said it expected sales to reach 11bn dollar in the three months to the end of July, more than 50 per cent ahead of the 7.2bn dollar analysts had been expecting and confirming its position as the biggest short-term beneficiary of the AI race that has broken out in the technology industry.
The forecast fuelled a 27 per cent leap in Nvidia’s shares, which had already more than doubled since the start of the year, and lifted its stock market value to a record 960 bn dollar.
Jensen Huang, chief executive, said the company was “significantly increasing our supply to meet surging demand” for its entire family of data centre chips, including the H100, a product launched this year that was designed to handle the demands of so-called large language models such as OpenAI’s GPT4.
The race in the tech industry to develop larger AI models has led some customers to worry privately about a shortage of H100 chips, which only went on sale earlier this year. However, Nvidia’s $4.28bn in sales to data centre customers in its latest quarter topped even the most optimistic analysts’ forecasts, and the company said there had been strong sales of both the H100 and its A100 chips, based on its previous chip architecture.
Nvidia’s forecast noted a potential doubling of sales to data centre customers in three months, even though data centre sales were running at an annualised rate of $17bn in the opening quarter of this year. Growth is coming from customers across the board, Kress said, with consumer internet companies, cloud computing providers and enterprise customers all rushing to apply the generative AI to their businesses.
The bullish forecast came as Nvidia reported revenue and earnings in its latest quarter, to the end of April, had also topped forecasts, thanks to a jump in sales to data centre customers as demand for AI took off. Revenue reached $7.19bn, up 19 per cent from the preceding three months but down 13 per cent from the year before, as sales of chips for gaming systems dropped.
Earnings per share rose 22 per cent from a year before to 82 cents, or $1.09 on the pro forma basis Wall Street judges the company. The consensus view on Wall Street had been for revenue of $6.52bn and pro forma earnings of 92 cents a share.
now let's delve into the numbers. Nvidia's different business units did not all perform equally well during the quarter - which can be expected, of course. Nvidia's data center business grossed revenues of $4.3 billion during the first quarter, which represents a new record high. Data center demand is not very cyclical, and companies kept investing in new equipment despite a potential recession being on the horizon. This can be explained by the fact that data centers are mission critical for many companies, so they don't really have a lot of choice when it comes to allocating capital to this space. Strong data center sales also have been seen in the results of other chip companies such as Advanced Micro Devices (AMD). Both Nvidia and AMD also were able to benefit from the weak performance of their competitor Intel (INTC), as Intel has been losing market share in the data center space in recent quarters due to self-inflicted problems and an unconvincing product line-up.
Nvidia is a major graphic chip or GPU player and is thus heavily impacted by the performance of related end markets. This includes both cryptocurrency mining and gaming. While some cryptocurrencies can't be mined with GPUs economically, such as Bitcoin, others, such as Ethereum, can be mined with GPUs. Ethereum moved from a proof-of-work model to a proof-of-stake model in the fall of 2022, but some miners still use GPUs for Ethereum mining. Not surprisingly, Nvidia's sales to this end market depend on the price for cryptocurrencies - when cryptocurrencies are expensive, miners are more eager to acquire additional GPUs and they may also be willing to pay high prices for them. During times when cryptocurrencies are less expensive, mining is less profitable, and GPU demand from cryptocurrency miners wanes. This has had an impact on Nvidia's sales in the past and likely played a role in Nvidia's Q1 sales as well.
GPU sales have been under pressure in recent quarters due to lower demand by gamers as well. Many that like to play video games upgraded their hardware during the lockdown phase of the pandemic when staying at home meant that consumers had more time for video games. With many gamers having relatively new equipment, demand has declined in the recent past. At the same time, inflation pressures consumers' ability to spend on discretionary goods. On top of that, some consumers prefer to spend their money on experiences over things now as there are no lockdowns or travel restrictions in place any longer. All in all, this has resulted in a difficult macro environment for Nvidia's gaming business.
Combined, the headwinds for the gaming market and the cryptocurrency market explain why Nvidia's sales and profits kept declining during the most recent quarter, relative to the results the company was able to generate one year earlier. The strong performance in the data center space was not enough to offset the headwinds Nvidia experienced in other areas.
I personally going to take huge profit right now and wait for 250 $ levels

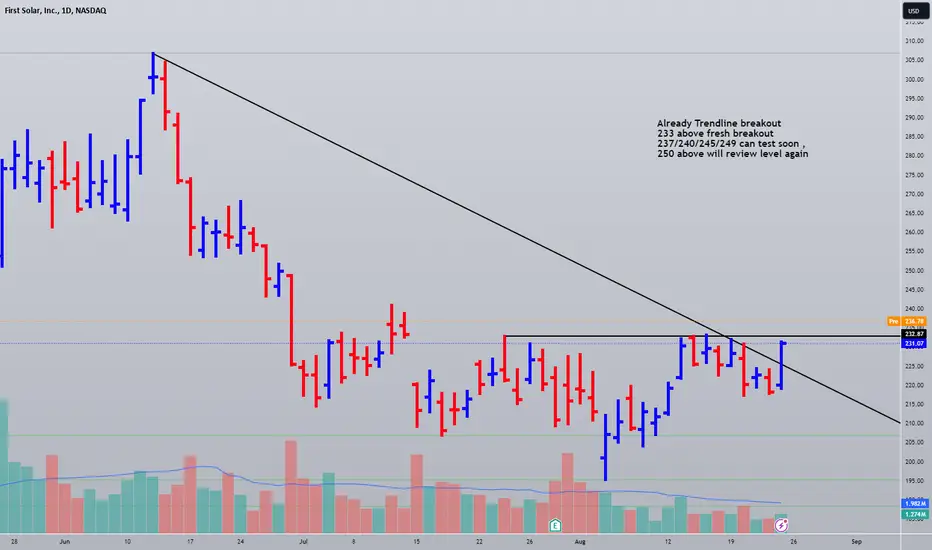
FSLR breakout , US StockAlready Trendline breakout
233 above fresh breakout
237/240/245/249 can test soon ,
250 above will review level again
AMD Shares Soared After NewsAMD Shares Soared After News of a Server Manufacturer Acquisition
Yesterday, it was announced that Analog Micro Devices (AMD) intends to acquire ZT Systems, a manufacturer of equipment for data centres, cloud computing, and artificial intelligence. The market responded positively, with investors believing this move could help AMD reduce Nvidia's substantial market share.
As shown by the AMD stock chart, the price jumped by 4.5% yesterday. What’s next?
On 30 July, we highlighted the support block formed by the $135 level and the long-term upward trendline (shown in yellow). Bears managed to push the price below this block during the overall market decline on 5 August, but only briefly.
Technical analysis of AMD’s stock chart today indicates that the price has firmly risen above this support block.
Moreover, the bulls demonstrated their ability to break through the median line of the descending channel (shown in red). This could suggest that the dominance bears have held since March 2024 is weakening.
Looking ahead, this may lead to a test of resistance at the upper boundary of the descending channel. This resistance is strengthened by a bearish gap above the $170 level.
According to forecasts from 30 Wall Street analysts surveyed by TipRanks, 24 recommend buying AMD shares. On average, they predict AMD’s price will reach $189.48 (about +22% from current levels) within the next 12 months. However, after evaluating the impact of the ZT Systems acquisition, these price forecasts may be revised upwards.
This article represents the opinion of the Companies operating under the FXOpen brand only. It is not to be construed as an offer, solicitation, or recommendation with respect to products and services provided by the Companies operating under the FXOpen brand, nor is it to be considered financial advice.
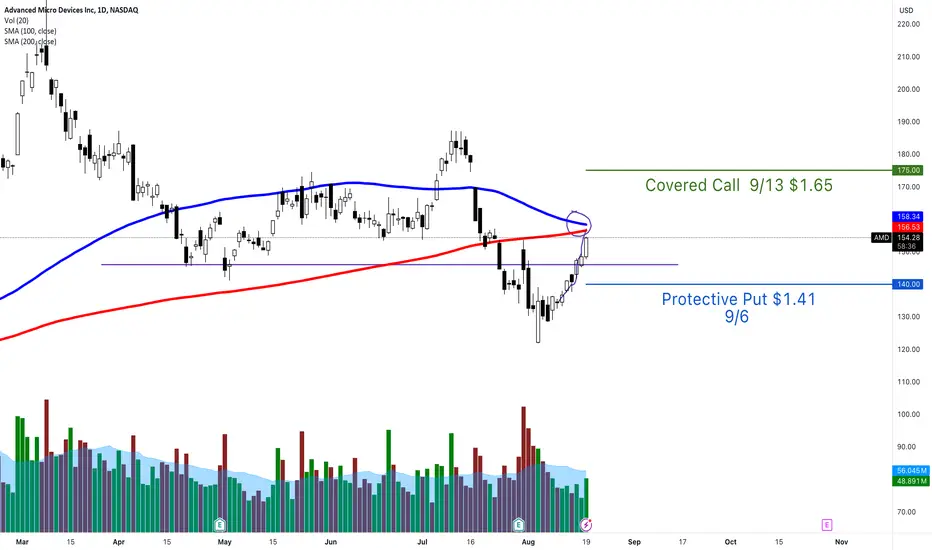
Collar on AMD I did a $150 put sale and got put shares. I rcvd $1.50 credit when I did it. I REALLY would love to sell AMD at $175
But I'll be okay owning the shares for a while. I will sell my puts for a profit if AMD sells off and buy more shares. I'll be fine sitting in AMD for a 6+ months to be profitable, although I don't believe I'll have to.. .
In a Deal Worth $4.9 Bln, AMD to Acquire Server Maker ZT SystemsAdvanced Micro Devices Inc. ( NASDAQ:AMD ), a key player in the semiconductor industry, is making significant strides in its ongoing quest to challenge Nvidia Corp.'s dominance in the AI and data center markets. In a bold move, NASDAQ:AMD has announced its acquisition of ZT Systems, a privately-held server maker based in Secaucus, New Jersey, in a cash and stock transaction valued at $4.9 billion. This strategic acquisition marks a critical step in AMD's expansion into data center technology and AI infrastructure, positioning the company to better compete in an increasingly AI-driven world.
A Strategic Acquisition to Bolster AI Capabilities
ZT Systems, a veteran in the server manufacturing industry, has built a reputation for designing and producing high-performance servers for large data centers. These servers are crucial for companies investing heavily in artificial intelligence (AI) capabilities. By acquiring ZT Systems, AMD is not just expanding its portfolio; it's significantly strengthening its Data Center Solutions Business Group. This move aligns with AMD's broader strategy to enhance its AI systems and challenge Nvidia's market leadership.
Lisa Su, AMD's CEO, emphasized the importance of this acquisition, stating, "Our acquisition of ZT Systems is the next major step in our long-term AI strategy to deliver leadership training and inferencing solutions that can be rapidly deployed at scale across cloud and enterprise customers." Su's comments reflect AMD's commitment to expanding its AI capabilities, which have become increasingly vital as AI adoption accelerates across industries.
Aiming to Rival Nvidia's Dominance
Nvidia, the undisputed leader in the data center market, has built its success on offering a comprehensive suite of AI-related products, including chips, networking, servers, software, and services. AMD's acquisition of ZT Systems is a strategic move to close the gap and offer a more competitive suite of products that can meet the growing demands of AI computing.
NASDAQ:AMD has already invested over $1 billion in the past year to expand its reach in the AI market, and the acquisition of ZT Systems is expected to further accelerate this momentum. AMD's new MI range of accelerator chips is projected to generate over $4.5 billion in revenue this year, making it the most formidable challenger to Nvidia in the AI processor market. However, Nvidia's dominance remains unchallenged, with analysts predicting the company will generate $100 billion in data center revenue this fiscal year.
Strengthening AMD's AI Ecosystem
ZT Systems brings to NASDAQ:AMD a wealth of expertise in AI systems design, which includes not only silicon but also software and systems. This acquisition will enable NASDAQ:AMD to offer a more integrated and efficient AI infrastructure, which is essential as AI systems become more complex and demanding. The ability to design end-to-end data center solutions that are optimized for AI workloads will be a key differentiator for NASDAQ:AMD in the competitive AI market.
Moreover, ZT Systems' CEO Frank Zhang and President Doug Huang will play pivotal roles in integrating the company into AMD's operations. Zhang will lead AMD's manufacturing business, while Huang will oversee design and customer enablement teams. Both executives will report to AMD's executive vice president and general manager, Forrest Norrod, ensuring a seamless integration of ZT Systems into AMD's Data Center Solutions Business Group.
A Vision for the Future
The acquisition of ZT Systems is expected to close in the first half of 2025, and its impact on AMD's AI strategy will likely be felt for years to come. With this acquisition, NASDAQ:AMD is positioning itself as a more formidable competitor to Nvidia, particularly in the rapidly growing AI market. The combination of AMD's high-performance Instinct AI accelerator, EPYC CPU, and networking product portfolios with ZT Systems' industry-leading data center systems expertise will enable AMD to deliver end-to-end data center AI infrastructure at scale.
Technical Outlook
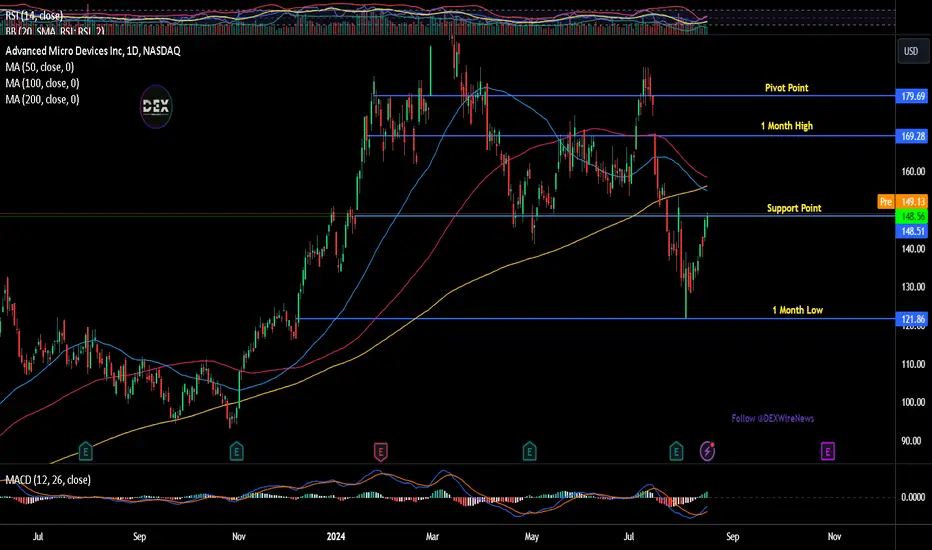
Advanced Micro Devices (NASDAQ: NASDAQ:AMD ) stock has risen 2.56% in Monday's premarket trading. After a bearish pattern, a strong bullish reversal on August 5 validated a shift in trend. AMD's acquisition deal is expected to drive growth in AI stocks, with strong buy ratings from tradingview.com and stockanalysis.com. The RSI stands at 52.92, indicating potential for further growth. However, traders should exercise caution, as AMD is currently trading below its 50, 100, and 200-day moving averages.
As the AI revolution continues to reshape industries, AMD's strategic acquisition of ZT Systems signals its commitment to being at the forefront of this transformation. By bolstering its AI infrastructure capabilities, AMD is not only challenging Nvidia's dominance but also paving the way for a more competitive and innovative future in AI computing.
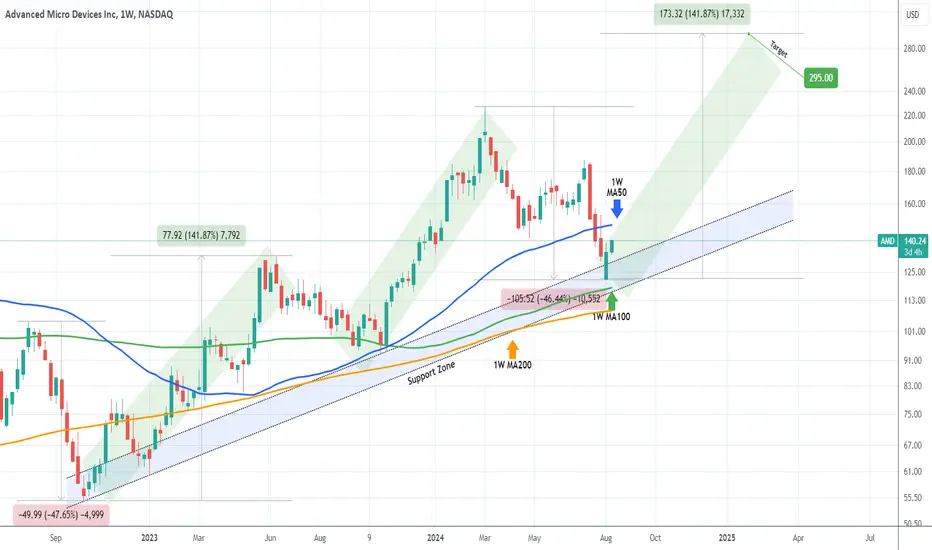
AMD Road to $295 has begun.The Advanced Micro Devices (AMD) is on the 2nd straight weekly bounce following the August 05 bottom. This is so far the strongest 2-week bullish reversal since November 06 2023, which was the previous bottom/ Higher Low on the 2-year Support Zone.
It is no coincidence that this rebound took place just before hitting the 1W MA100 (green trend-line). So far we have had two Bullish Legs arising from this Support Zone structure and currently we are expecting the 3rd.
Since the decline following the March 2024 High has been around -47%, similar to the September 2023 one, we expect the Bullish Leg to be equally strong. As a result, our new long-term Target is $295.00.
-------------------------------------------------------------------------------
** Please LIKE 👍, FOLLOW ✅, SHARE 🙌 and COMMENT ✍ if you enjoy this idea! Also share your ideas and charts in the comments section below! This is best way to keep it relevant, support us, keep the content here free and allow the idea to reach as many people as possible. **
-------------------------------------------------------------------------------
💸💸💸💸💸💸
👇 👇 👇 👇 👇 👇
ADVANCED MICRO DEVICES - Ready for a reversal?NASDAQ:AMD is retesting a significant horizontal structure and we might see a bullish reversal soon, considering that AMD already created a correction of -45% over the past couple of months.
Click chart above to see detailed analysis
AMD is clearly one of these "AI" hype stocks which is now coming back to normal levels after also NVIDIA and other tech stocks are correcting a bit. AMD has been trading in a rising channel formation since the "Covid" crash back in 2020. With the recent break and retest, we could definitely see a bullish reversal soon.
Levels to watch: $120
Keep your long term vision,
Philip - BasicTrading

Intel Corporation (INTC) Stock: A Investment Opportunity ?Intel Corporation's recent earnings report has raised some concerns, but there are several reasons to remain optimistic about INTC stock.
Despite a challenging Q2, Intel is strategically shifting production to its high-volume plant in Ireland, positioning itself for long-term gains.
The company's focus on cutting-edge chip manufacturing and AI advancements highlights its commitment to innovation.
Moreover, Intel's diverse portfolio, including the promising Gaudi AI products, provides a solid foundation for future growth.
With strategic cost-cutting measures and a strong financial position, Intel is poised to rebound and deliver value to its investors.

SPX 5600 BY FALL 2024 ?SP:SPX
Economic Resilience: Despite various challenges, the U.S. economy has shown remarkable resilience. If this trend continues, it could support higher stock prices.
Normalization of Interest Rates: The Federal Reserve’s normalization of interest rates, rather than aggressive tightening, could create a favorable environment for equities. If inflation continues to fall closer to the Fed’s 2% target, it might only require modest rate cuts.
Consumer Spending Power: Consumers have maintained strong purchasing power, supported by high job security and a robust labor market. This continued consumption can drive corporate earnings higher.
Big Tech Leadership: Big Tech companies have consistently delivered strong earnings and have been a significant driver of the S&P 500’s performance. Their growth prospects, particularly in areas like AI, remain strong.
Earnings Growth: Analysts project solid earnings growth for the S&P 500, with estimates suggesting a significant increase in earnings per share (EPS) for 2024.
Valuation Multiples: The valuation multiples for Big Tech and other sectors are seen as reasonable given their growth prospects. This supports higher price targets for the index.
Historical Trends: Historical performance patterns, especially in presidential election years, suggest that the S&P 500 could see gains.

$AAPL Consolidating below the 50DMAHugging the 50 DMA,Large Range. We are in the Fair Value Gap overnight as a write this. Ironically, I have circled
Calls above $209.25 for a Move to the 50D at $213.27
Puts below $205.30 for a retest of Mondays open. 200DMA possible

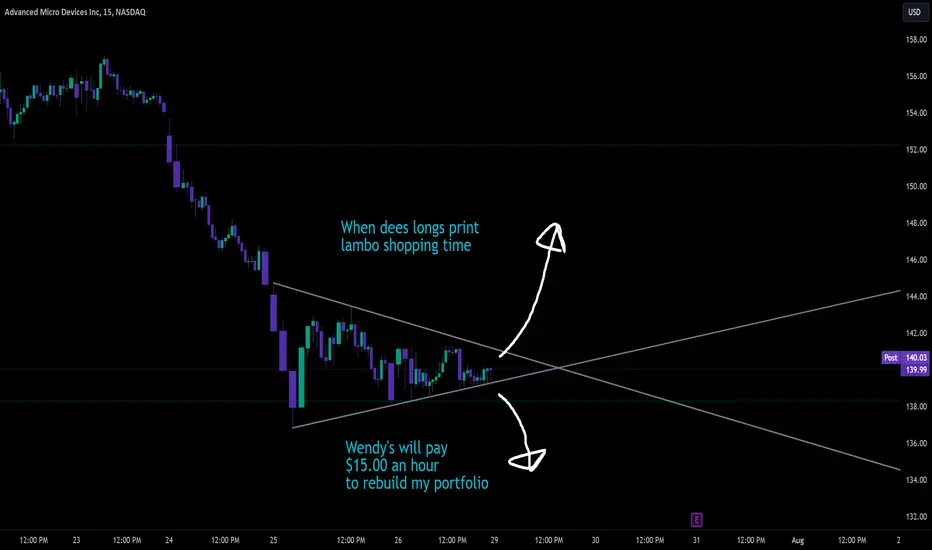
AMD Wendy's SetupStock has dropped almost 40% from it's ATH into a pennant into earnings. Short sellers would be insane not to cover on any good news or if sentiment just stops getting worse. Tech as a whole looks due for a bounce, AMD was a bottom indicator in 2023, could do it again in 2024.
Upside price targets are 155, if through then 200
Stop loss = breakdown of the pennant
$SPY Sharp Decline?! $503 Target, $493 possible 8/21, then $520Thats right folks. Your's truly with another quick thought on where I think we're headed, and FAST!! Assuming we repeat the First Half of 2022, I want to say that the next 10 days will produce a dump and a bounce. Do be careful if you're long this market. All signs point to a flash crash to $493 and then a mean bounce to retest $520. Don't forget, cash is a position. I like to keep things simple with my charts for the most part. ATM, I am looking at the 10D chart. I like the 10D chart because it has hidden divergences on RSI that prove extremely useful. As the days go on, it will get easier. Those that doubt will always learn the Hard way. Paytience will always prevail. After $520 bounce, I would assume a slow bleed to $480 into the election for a new low, followed by an Election Rally back to $530 before we come back crashing down. All of this will come with time and I'm writing it down so you can see my thought process. Everything takes time.
Drop to $503-$494
Hard Bounce to $520
Slow Bleed to $480, Previous ATH Winter 22'
Bounce to $530 for a Retest of Previous Support should we break. Good Luck out there

ARM, Eyeing a bounce short termLooking at the ARM chart on the daily, we have multiple factors that indicate a probable short term bounce. We have bottoming tail on the daily, We've just kissed a long term trendline, we are at the 200 SMA and EMA, The RSI is at 30. We've had two weeks of relentless selling and we are now down 41% from the highs. Eyes we be looking for a short term bounce.

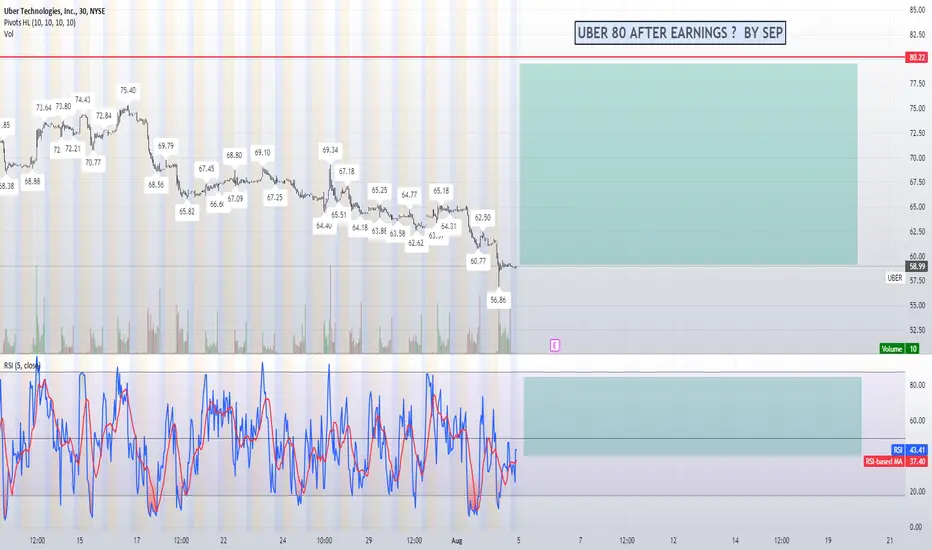
UBER 80 Afrer earnings ? NYSE:UBER
Uber Technologies Inc. Stock Surges to $75-$80 Range Following Strong Earnings Report
Uber Technologies Inc. (NYSE: UBER) has seen a significant boost in its stock price, reaching the $75-$80 range after the release of its latest earnings report. The ride-sharing giant reported impressive financial results for Q2 2024, with total revenue hitting $10.13 billion. This marks a notable year-over-year growth of 15%, showcasing Uber’s ability to expand its market presence and drive revenue despite challenging economic conditions.
The company’s strong performance was driven by increased demand for its ride-sharing and delivery services, as well as strategic investments in new technologies and markets. Uber’s net loss widened to $654 million, but the market responded positively to the revenue growth and future potential1. This optimism among investors has propelled the stock to new heights, reinforcing confidence in Uber’s long-term growth strategy.
As Uber continues to innovate and expand its service offerings, the future looks bright for this industry leader. Investors and market watchers will be closely monitoring how Uber leverages its current momentum to drive further growth and shareholder value.
CAFE CITY STUDIO & NY RUNS GLOBAL INC. NYC
AMD surpasses expectations and raises AI chip sales for 2024Advanced Micro Devices (AMD) reported impressive quarterly results, beating analysts' expectations and raising its revenue forecast for artificial intelligence (AI) chips through 2024. According to the company's projections, demand for AI chips will outstrip supply through 2025, indicating a sustainable growth trajectory for AMD's key business segments.
For Q3 2024, AMD forecasts revenue of 6.7 billion USD, which aligns with LSEG analysts' average estimate of 6.61 billion USD. This projection is supported by the recovery of the PC market, which is experiencing a resurgence after a significant downturn. Integrating new artificial intelligence features is expected to boost consumer demand further.
In the data centre segment, AMD's largest division, revenue in Q2 rose 115% to 2.8 billion USD, exceeding expectations of 2.79 billion USD. Notably, quarterly revenue from artificial intelligence chips in this segment surpassed the 1 billion USD mark for the first time. Overall, AMD's revenue in the second quarter grew by 9% to 5.8 billion USD, exceeding the forecasted 5.72 billion USD.
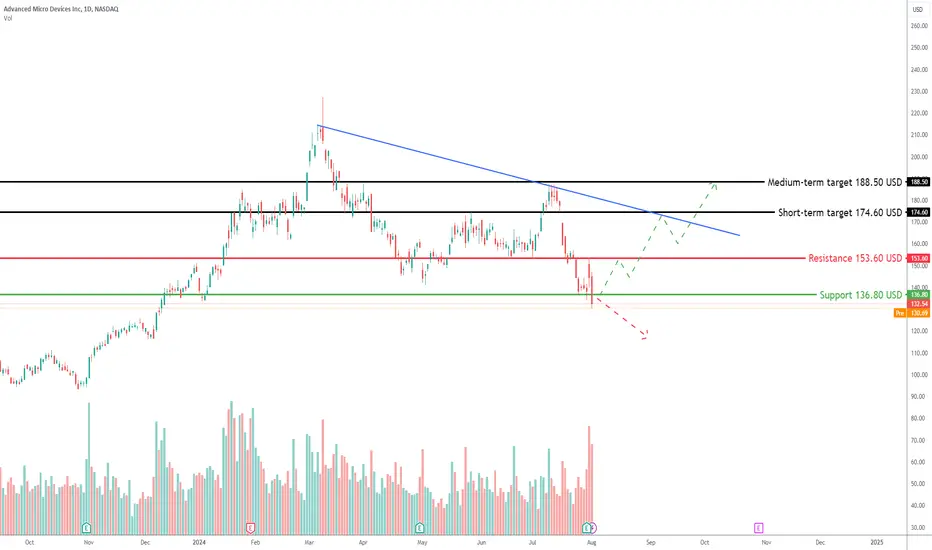
Technical analysis of Advanced Micro Devices (NASDAQ: AMD)
Exploring potential trading opportunities based on AMD's stock performance:
Timeframe : Daily (D1)
Current trend : the stock is in a downtrend, but recent strong earnings and positive forecasts may catalyse a shift to an uptrend
Resistance level : 153.60 USD
Support level : previously at 138.60 USD, which has now been breached
Potential downtrend target : if the downtrend persists, the downside target could be at 117.50 USD
Short-term target : if the trend reverses and the stock returns above the previous support level, a short-term target could be 174.60 USD
Medium-term target : with sustained positive momentum, the stock price might aim for 188.50 USD
Investors and traders should keep a close eye on AMD, especially as the company capitalises on the growing demand for artificial intelligence chips and benefits from the recovery of the PC market. AMD's strategic focus on artificial intelligence and data centres sets it apart from its competitors, which may further boost the stock.
—
Ideas and other content presented on this page should not be considered as guidance for trading or an investment advice. RoboMarkets bears no responsibility for trading results based on trading opinions described in these analytical reviews.
The material presented and the information contained herein is for information purposes only and in no way should be considered as the provision of investment advice for the purposes of Investment Firms Law L. 87(I)/2017 of the Republic of Cyprus or any other form of personal advice or recommendation, which relates to certain types of transactions with certain types of financial instruments.
Risk Warning: CFDs are complex instruments and come with a high risk of losing money rapidly due to leverage. 65.68% of retail investor accounts lose money when trading CFDs with this provider. You should consider whether you understand how CFDs work and whether you can afford to take the high risk of losing your money.
AMD Skyrockets Over 9%, Nvidia Rises: What’s Driving the Surge?Overview
Advanced Micro Devices, Inc. (NASDAQ: NASDAQ:AMD ) saw its shares soar over 9% in premarket trading on Wednesday, following an impressive second-quarter earnings report that exceeded expectations. The strong performance has also positively impacted rival Nvidia (NASDAQ: NVDA), which experienced a rise in its stock price. Here’s a detailed look at what’s happening and why AMD is grabbing headlines.
Record-Breaking Q2 Performance
NASDAQ:AMD ’s second-quarter results were stellar, with revenue and earnings surpassing Wall Street's expectations. The highlight was a record surge in data center revenue, which soared to $2.8 billion, marking a 115% year-over-year increase and a 21% sequential growth. This surge was driven by high demand for AMD's Instinct, EPYC, and Ryzen processors.
CEO's Optimism
Lisa Su, AMD's CEO, expressed confidence in the company’s trajectory, stating, “Our AI business continued accelerating and we are well positioned to deliver strong revenue growth in the second half of the year led by demand for Instinct, EPYC, and Ryzen processors.” This positive outlook has further fueled investor confidence.
Strong AI Business Growth
A significant contributor to AMD's success has been its AI business. On the earnings call, Su mentioned that leading cloud and enterprise providers expanded the availability of Instinct MI300X solutions, and quarterly revenue for MI300 exceeded $1 billion for the first time. This milestone underscores the robust demand for AMD’s AI and data center products.
Impact on Rivals and Sector-Wide Rally
The positive sentiment generated by AMD's strong quarterly results has extended to other semiconductor companies, particularly Nvidia. Nvidia shares rose 5.40% to $109.40 in premarket trading, buoyed by the anticipation of its upcoming earnings report on August 28. Qualcomm also experienced gains, as AMD’s success provided a boost to the overall sector.
Geopolitical and Sector-Wide Factors
The semiconductor sector received additional uplift from reports suggesting potentially less severe U.S. export restrictions on China. According to news sources, new U.S. chip export restrictions might exclude allies like the Netherlands, Japan, and South Korea, which alleviated some concerns in the market. This news, combined with positive earnings, contributed to the rally in semiconductor stocks.
Global Semiconductor Rally
Shares of global semiconductor firms rallied on Wednesday, boosted by the strong earnings in the sector and favorable geopolitical developments. Samsung’s shares rose significantly after a notable jump in operating profit, and ASML also saw gains following the Reuters report on U.S. export restrictions.
AMD Stock Performance
NASDAQ:AMD stock, which had been down over 6% year-to-date, climbed 9.40% to $151.45 in premarket trading. If these gains hold, NASDAQ:AMD could erase its year-to-date losses. This strong market reaction reflects the confidence investors have in AMD’s growth trajectory and its ability to capitalize on the burgeoning demand for AI and data center technologies.
Conclusion
AMD's exceptional second-quarter performance, driven by record data center revenue and robust growth in its AI business, has significantly boosted its stock price and positively impacted the broader semiconductor sector. The appointment of CEO Lisa Su and the company’s strategic focus on high-demand areas like AI and data centers have positioned NASDAQ:AMD for continued success. As the semiconductor industry navigates geopolitical challenges and market fluctuations, AMD's strong fundamentals and growth prospects make it a standout player.

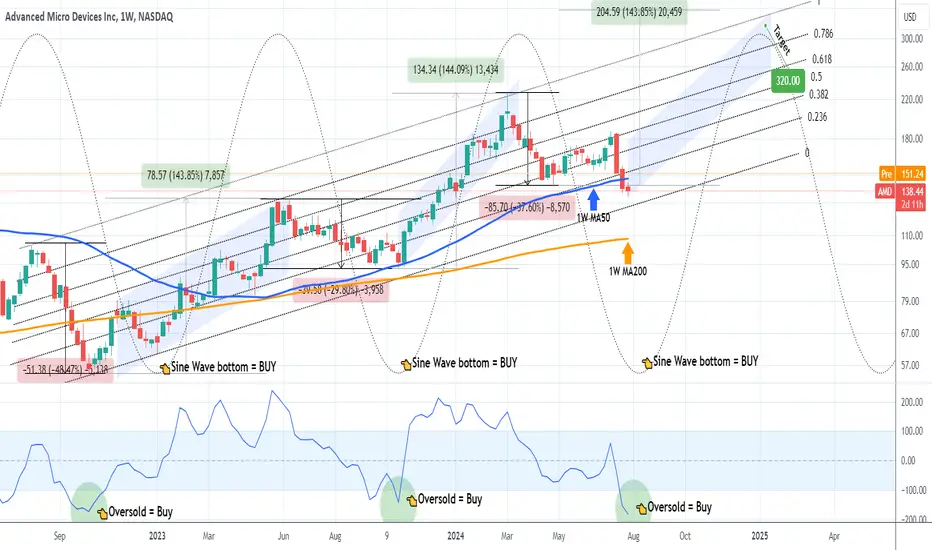
AMD Final Flush completed. Next High above $300.The Advanced Micro Devices (AMD) have most likely bottomed on this week's 1W candle as after breaking last week below the 1W MA50 (blue trend-line), their earnings report last night came out better than expected and the opening is expected considerably higher.
Technically, the stock has almost touched the bottom (Higher Lows trend-line) of the 2-year Channel Up that started on August 01 2022. This can be a similar Higher Low to the last one on the week of October 23 2023. As you can see, that Low was priced while the 1W CCI was Oversold (below -100.00), similar to today. The Channel's first Low was again on an oversold 1W CCI on the week of October 10 2022.
As the same time, we are as close to the bottom of the Sine Wave as possible, which again, as you see, has marked the last two Higher Lows of the long-term Channel Up.
We don't expect any more divergencies from what a typical Channel Up would suggest, and that is the start of a new Bullish Leg, its 3rd so far. If the next Higher High is exactly at the top of the Sine Wave, then we can expect it in early January 2025. The previous two Higher Highs were priced after +144% rallies from the Lows, so it is possible to see $345.00 if this symmetry continues to hold. A 300 - 320 Target Zone though is in our view more suited for a Higher High.
-------------------------------------------------------------------------------
** Please LIKE 👍, FOLLOW ✅, SHARE 🙌 and COMMENT ✍ if you enjoy this idea! Also share your ideas and charts in the comments section below! This is best way to keep it relevant, support us, keep the content here free and allow the idea to reach as many people as possible. **
-------------------------------------------------------------------------------
💸💸💸💸💸💸
👇 👇 👇 👇 👇 👇
Analysis of AMD Share Price Ahead of Today's ReportAnalysis of AMD Share Price Ahead of Today's Report
The earnings season is in full swing: over 200 companies in the S&P 500 index (SPX 500 mini on FXOpen) have reported their current cycle results, with average earnings up 6.5% year-on-year and revenue growth of 4.1%, according to a client note from Oppenheimer Asset Management published on Monday.
This week, investors are awaiting reports from mega-cap companies, including Apple (AAPL), Microsoft (MSFT), Facebook (META), and Amazon.com (AMZN). Among other major brands are Intel (INTC), Boeing (BA), Pfizer (PFE), Exxon Mobil (XOM), as well as chipmaker AMD, whose second-quarter earnings report will be released today after the close of the main trading session.
Analysts expect AMD's earnings per share to rise from $0.62 to $0.68.
What does the AMD chart indicate?
Despite the S&P 500 index (SPX 500 mini on FXOpen) rising approximately 15% in 2024, AMD's share price remains near its January start price.
Technical analysis of AMD's share chart shows that the price was in an uptrend (shown in blue) in the first half of 2024, but the trend turned downwards (shown in red) after the price exceeded the psychological level of $200.
Today, AMD's share price is near a support block formed by:
→ the long-term trend line (shown in orange);
→ the lower boundary of the downward channel;
→ the current yearly low around $135 per share.
It is possible that today's earnings report could provide a fundamental driver (e.g., higher-than-expected earnings per share) for a reversal upwards from this support block.
Meanwhile, forecasts remain optimistic. According to predictions from 34 Wall Street analysts surveyed by TipRanks, 28 recommend buying AMD shares. On average, they forecast AMD's price to reach $194.93 (nearly +40% from current levels) within 12 months.
This article represents the opinion of the Companies operating under the FXOpen brand only. It is not to be construed as an offer, solicitation, or recommendation with respect to products and services provided by the Companies operating under the FXOpen brand, nor is it to be considered financial advice.

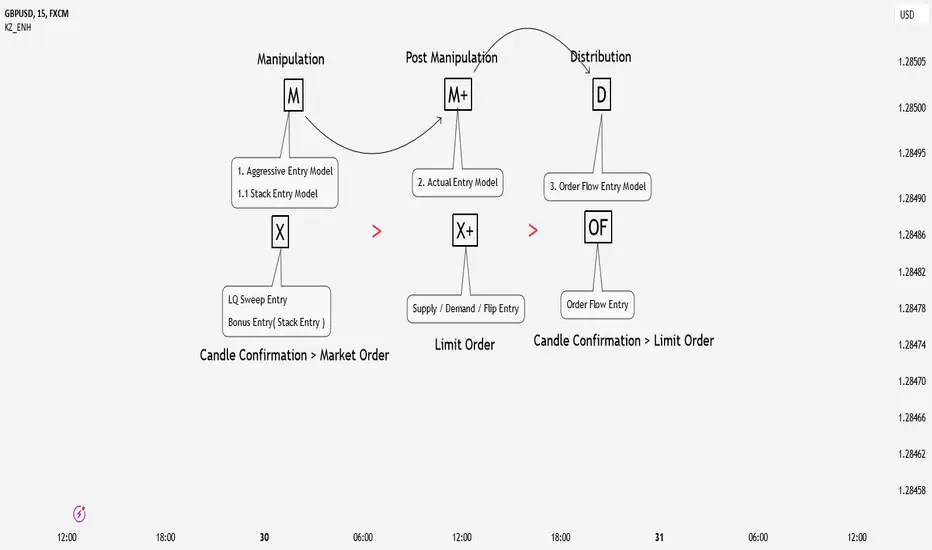
Types of Entry Models in SMC ConceptsIn Smart Money Concepts (SMC) trading, there are different types of entry models that traders use to enter the market. These include aggressive entry, actual entry, and order flow entry models. Here’s a simple explanation of each:
1. Aggressive Entry Model (15m): @Manipulation
Entry Criteria: During Liquidity (LQ) Sweeps at Killzones + Stack Entries at Lower Time Frame (LTF, 1m)
Description:
Traders enter trades during significant liquidity sweeps, particularly in key market zones known as killzones (high-activity periods).
They stack their entries by analyzing the 1-minute chart to find optimal entry points.
This approach aims to catch early moves by entering immediately after liquidity has been swept, indicating potential reversals or strong market moves.
Order Type: Market Order(post candle confirmation)
Traders execute a market order as soon as their entry criteria are met on the 1-minute chart, entering the trade immediately at the current market price.
Time Frame: 1 minute (LTF)
2. Actual Entry Model (15m): Post Manipulation
Entry Criteria: At Valid Supply or Demand or Flip Zones
Description:
Traders enter trades at well-defined supply and demand zones or flip zones (areas where the market changes from supply to demand or vice versa).
They wait for the price to reach these significant zones on the 15-minute chart, providing a more confirmed entry point that aligns with market structure and potential reversals.
Order Type: Limit Order
Traders place a limit order on the 1-minute chart at a specific price level they believe the market will reach, ensuring a better entry price.
Time Frame: 1 minute (LTF)
3. Order Flow Entry Model (15m): @Distribution
Entry Criteria: At Unmitigated Order Flow
Description:
Traders look for areas of unmitigated order flow on the 15-minute chart.
Unmitigated order flow refers to price levels where significant orders have not yet been fully absorbed by the market, indicating potential areas of strong buying or selling pressure.
Traders place their entries at these levels, often waiting for a candle confirmation to ensure the validity of the order flow analysis.
Order Type: Limit Order (post candle confirmation)
Traders wait for a candle confirmation on the 1-minute chart before placing a limit
order.
They analyze the order flow and wait for a confirming candle that aligns with their analysis before setting a limit order to enter the trade.
Time Frame: 1 minute (LTF)
AMD Advanced Micro Devices Options Ahead of EarningsIf you haven`t bought AMD before the previous earnings:
Now analyzing the options chain and the chart patterns of AMD Advanced Micro Devices prior to the earnings report this week,
I would consider purchasing the 140usd strike price Calls with
an expiration date of 2024-10-18,
for a premium of approximately $13.90.
If these options prove to be profitable prior to the earnings release, I would sell at least half of them.


#AMD Bearish on the Daily#AMD has an impulse, an ABC 3 wave corrective structure and has impulsively broken out of the corrective trend line.
Look for sells along the way to the fib extensions of 27.0 and 61.8
