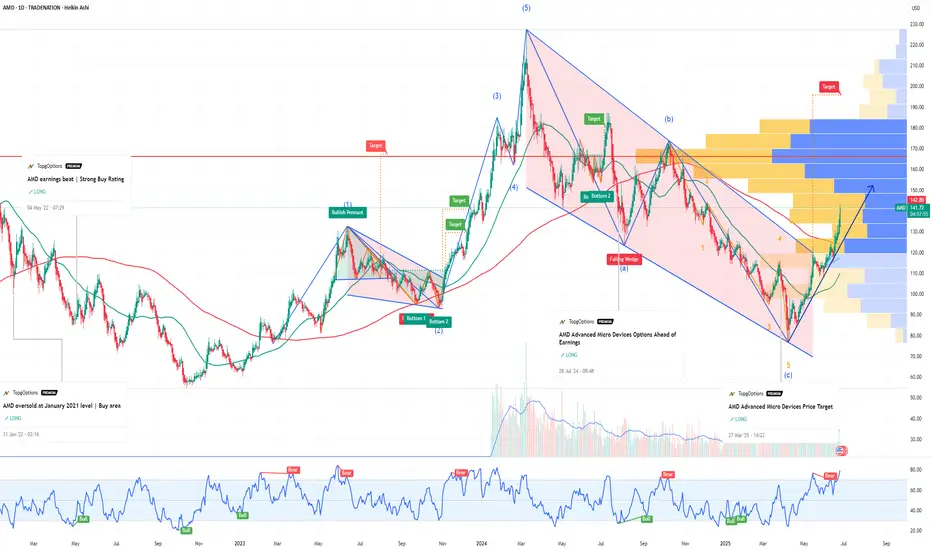
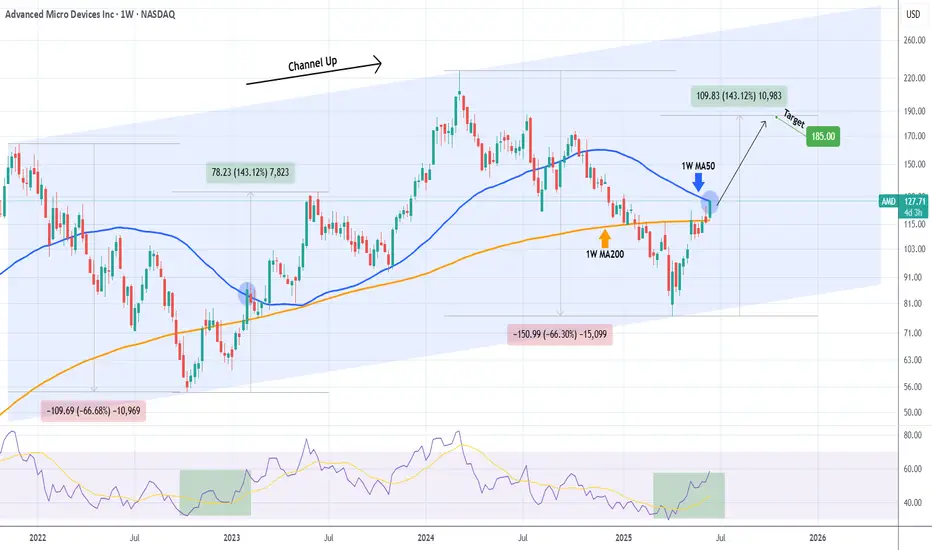
AMD Major Lower Highs/ 1W MA50 break-out.It was only 9 days ago (June 16, see chart below) when we called for a potential bullish break-out on Advanced Micro Devices (AMD) above the 1W MA50 (blue trend-line):
The break-out did happen, this 1W candle is already considerably above its 1W MA50 and based also on the level the 1W RSI is at right now, it may resemble more the March 13 2023 1W candle instead of the January 30 2023 as previously thought.
The reason is the major break-out of the All Time High (ATH) Lower Highs trend-line that came along with the 1W MA50. As you can see, it was on the March 13 2023 1W candle that AMD broke above that trend-line with the 1W RSI being on the same level (66.00) as today.
This candle formed a short-term Top, with the price initiating a 1.5 month pull-back that re-tested the 1W MA50 as Support and then moved on to complete the +143.12% Bullish Leg from the Channel Up bottom.
As a result, we can't rule out the first wave of short-term profit taking by next week. But a potential 1W MA50 test, will be another long-term buy entry in our view. Our $185.00 Target remains intact.
-------------------------------------------------------------------------------
** Please LIKE 👍, FOLLOW ✅, SHARE 🙌 and COMMENT ✍ if you enjoy this idea! Also share your ideas and charts in the comments section below! This is best way to keep it relevant, support us, keep the content here free and allow the idea to reach as many people as possible. **
-------------------------------------------------------------------------------
💸💸💸💸💸💸
👇 👇 👇 👇 👇 👇
AMD
Bullish Thesis: Why AMD Stock Could Soar by Year-End 2025If you haven`t bought AMD before the previous rally:
What to consider now:
1. AI Tailwinds Are Accelerating
AMD is finally gaining serious traction in the AI GPU race. Its MI300X accelerator chips are being adopted by big names like Microsoft, Meta, and Oracle for data center AI workloads. While NVIDIA is still dominant, AMD is expected to grab 10–20% of the AI GPU market share by 2025, according to industry estimates. That’s a multibillion-dollar opportunity.
The MI300X already passed $1B in revenue within its first quarters.
AI server TAM (total addressable market) is expected to grow to $400B by 2027 — AMD is positioning itself aggressively to carve out its slice.
2. Valuation Looks Reasonable vs Peers
AMD trades at a forward P/E around 40, significantly below Nvidia (which trades over 60x) despite similar growth projections for the next 2 years.
Revenue expected to grow over 15–20% YoY in 2025.
Gross margins expanding as high-performance chips dominate the mix.
3. Diversified Growth: Beyond AI
Gaming segment (PlayStation 5 and Xbox Series X chips) remains strong.
Embedded segment from Xilinx acquisition continues to generate solid cash flow.
Client CPU business is rebounding as the PC market stabilizes.
4. Strong Management and Execution
CEO Lisa Su is widely respected for turning AMD around and guiding the company through major innovations and acquisitions (Xilinx, Pensando). Execution has remained consistent, especially in delivering cutting-edge performance-per-watt chips.
Disclosure: I am part of Trade Nation's Influencer program and receive a monthly fee for using their TradingView charts in my analysis.
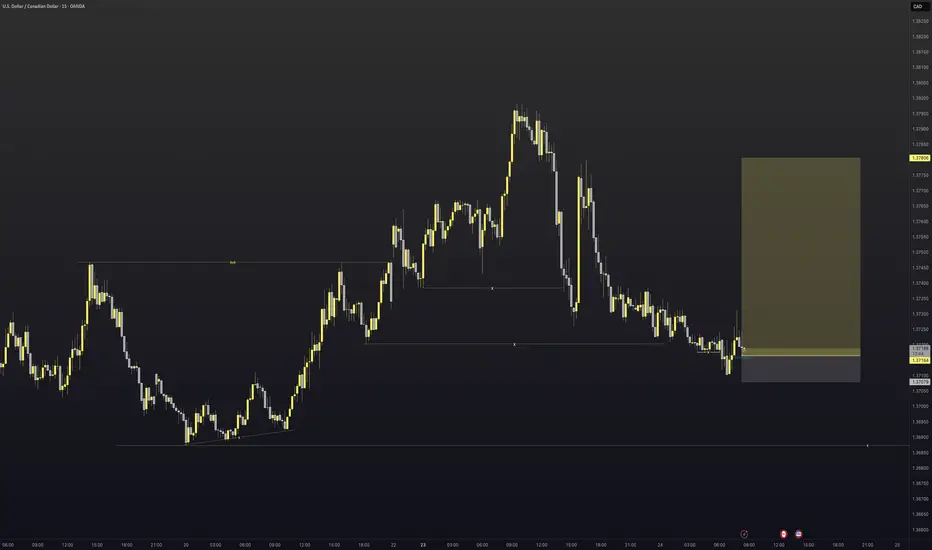
USDCAD - Long triggered We have entered into the discount area of the most recent swing point on USDCAD. With doing this we have taken out all the areas of liquidity within the trading range so it was time to look for potential long moves.
Now at current price we have had a great example of AMD where by we
Accumulate
Manipulate
and then the hope is that we begin to distribute higher.
There was also a nice fair value gap that was left behind on the 5min
So all that was left to do was execute.
Let us see how it plays out.
Win or lose great entry super happy with the trade. Lets see how it goes
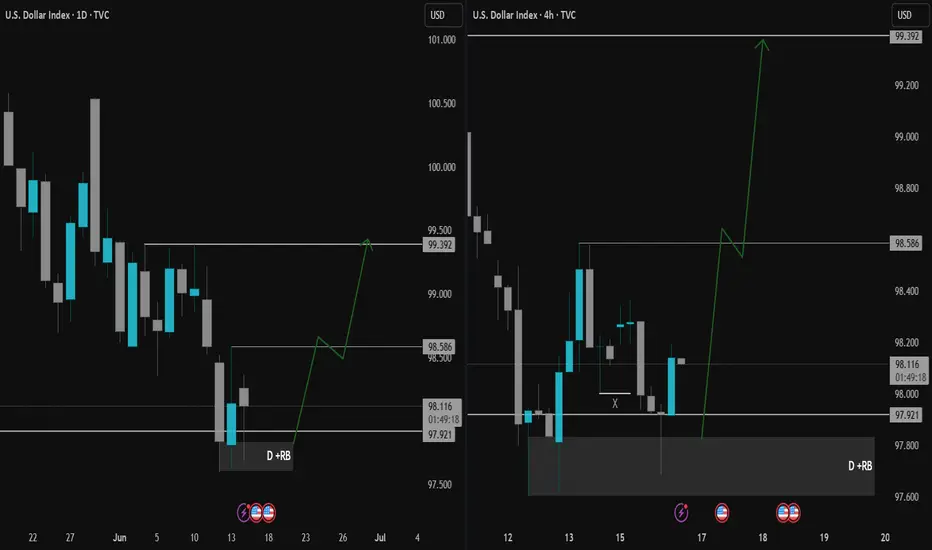
DXY Market Outlook: Eyes on 99.392Hello Traders,
DXY found buyers at the 97.921 level we tracked last week and managed to close daily candles above this level. We can now refer to this area as a rejection block (D + RB). This week, the block was retested and encountered rejection from buyers.
With this buyer reaction, our target is the peak level of the consolidation that brought the price here (99.392).
There's a minor level to watch along the way: 98.586. However, considering the key level where the price reacted and the weekly chart showing no major obstacles ahead, we believe that targeting the peak of the consolidation that initiated the last decline (99.392) is the more suitable approach.
Taking news data into account—and more importantly, geopolitical factors and unexpected developments—we still acknowledge the possibility of the price sweeping the low again. However, we don’t expect this to invalidate the overall scenario. With news catalysts, we anticipate the price reaching the target within the week.
Until the next update, wish you many pips!
AMD IS READY FOR A STRONG BULLISH MOVENASDAQ:AMD Right now, am extremely bullish on AMD.
I expect AMD to give a good bullish run to trail NVIDIA.
Technically, AMD is supper bullish right now, having had a multiple bullish break of structure on the daily time frame.
I took a long entry on the bullish break of structure on daily time frame. Stop loss is below the recent structure swing low.
What do you see on your chart?
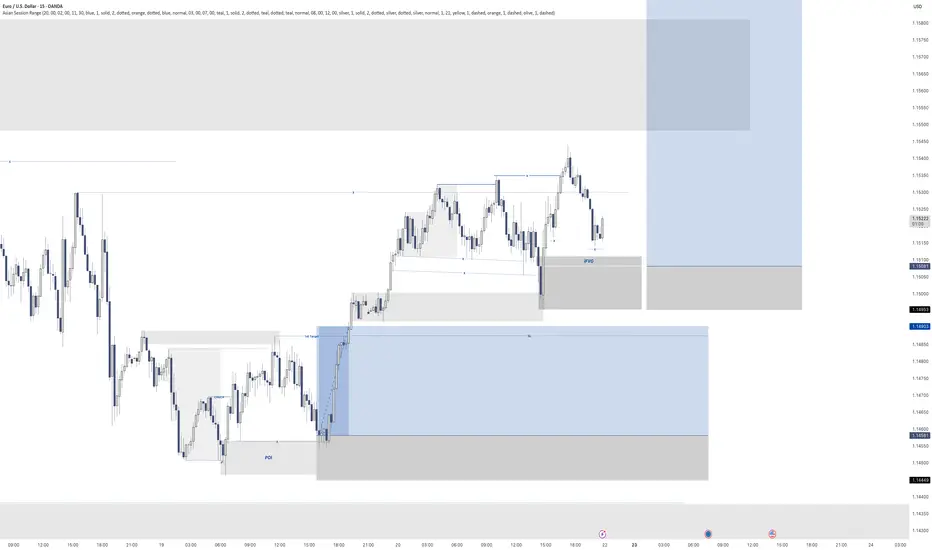
EURUSD - 2nd potential entryEvening all
Here is a still screenshot of what I am looking for the market open on EURUSD come Sunday night after the spreads have died down on the pair.
My pending order will go directly on the FVG with my stops below the manipulation of the range.
If I get tagged in great. If I don't also great if we continue to move high I mill just manage the one position.
If I am tagged in I will give you and update with a new idea and then depending on how that idea plays out win or lose I will come back and re-visit it and break it down some more.
However I have high hopes for this trade to make it up to 1.16300
Have a great weekend
and I will speak to you all soon
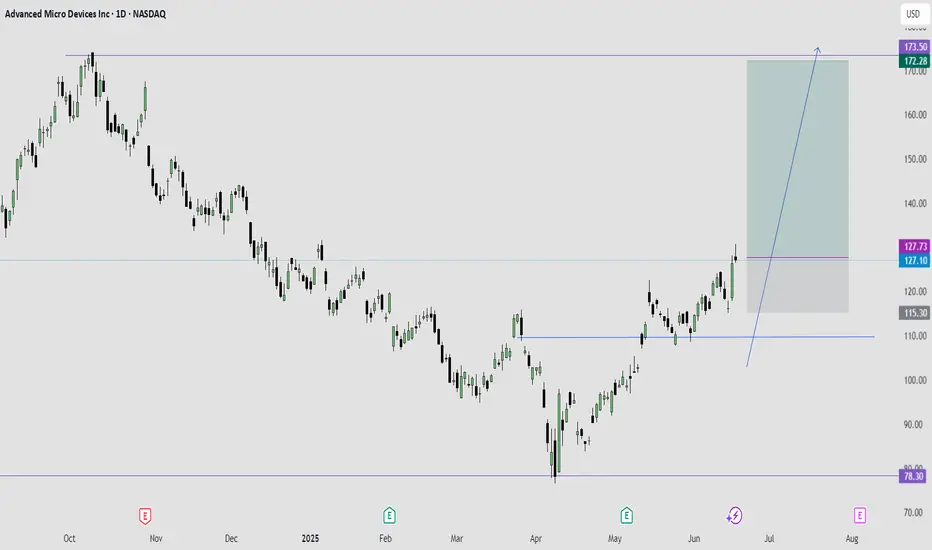
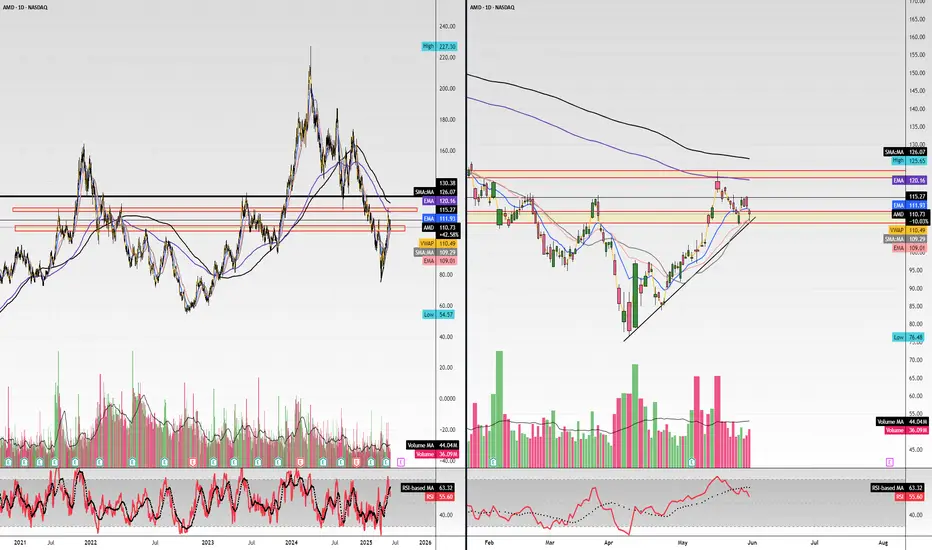
AMD – Breakout Watch (Daily Chart)NASDAQ:AMD surged +9.12% on June 16 with volume 1.8× above average, reclaiming the 200-day SMA for the first time in 7 months.
This marks a clear character change, but not yet a setup. Price stalled into multi-quarter trendline resistance around 128–130.
No pivot, no contraction — just strength into supply. Still needs to consolidate below trendline resistance for a valid trade.
Key Levels:
• Resistance: 130 / 145
• Support: 124.35 (breakout zone), 116.55 (MA stack)
• Watch for: Tight coil, volume dry-up, pivot pattern formation
Not chasing — watching for structure. Patience is a position.
📉 Weekly chart also reclaimed 30-week MA for the first time since Nov ’24.
#AMD #technicalanalysis #breakoutwatch #tradingview
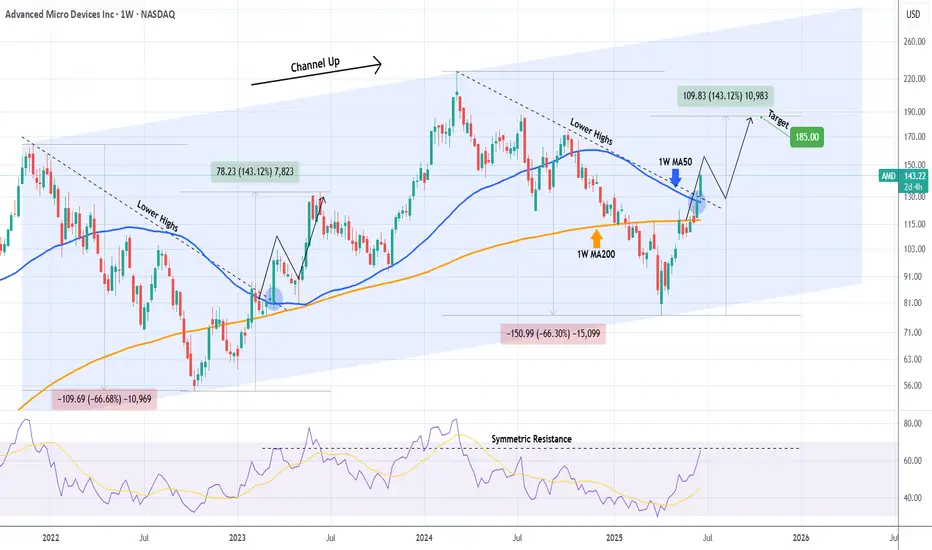
AMD First touch of 1W MA50 after 8 months!Advanced Micro Devices (AMD) hit today its 1W MA50 (blue trend-line) for the first time in almost 8 months (since October 28 2024). This is a crucial test as the las time this level broke as a Resistance following a Channel Up bottom rebound was on the week of January 30 2023.
When that happened, the Bullish Leg extended the upside to complete a +143.12% rise, before the next 1W MA50 pull-back.
As a result, if we close the week above the 1W MA50, we expect to see $185 before the end of the year.
-------------------------------------------------------------------------------
** Please LIKE 👍, FOLLOW ✅, SHARE 🙌 and COMMENT ✍ if you enjoy this idea! Also share your ideas and charts in the comments section below! This is best way to keep it relevant, support us, keep the content here free and allow the idea to reach as many people as possible. **
-------------------------------------------------------------------------------
💸💸💸💸💸💸
👇 👇 👇 👇 👇 👇
Amd - This starts the next +200% rally!Amd - NASDAQ:AMD - is preparing a major rally:
(click chart above to see the in depth analysis👆🏻)
It has - once again - not been unexpected at all that we now see a major reversal rally on Amd. After the harsh drop of about -65%, Amd retested a significant confluence of support and already created bullish confirmation. It is quite likely that this now starts the next bullrun.
Levels to watch: $100, $300
Keep your long term vision!
Philip (BasicTrading)

$SMCI "Buy The Dip" Value AreaSMCI (Super Micro Computer) has weathered the storm from all the negative press and I believe it is poised to go on a big run. This $26-$47 area is the BEST value you are going to get on it. This is probably the last discount before takeoff. We may not see this level again. As NVDA continues to fly, so will SMCI. Always do your own DD.

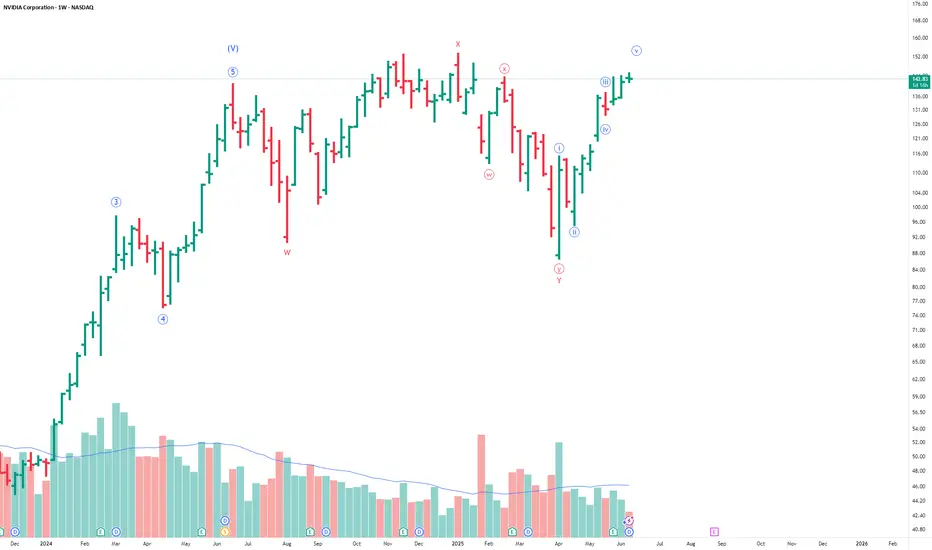
AI Chip Stocks NVDA and AMD Showing 5 Wave RiseNASDAQ:NVDA and NASDAQ:AMD are both showing 5 wave rise in weekly chart after a correction in WXY. I haven't checked but other AI related stocks also might be doing something similar.
Once the 5 waves are over, we can expect some correction but the 5-wave rise post a correction typically signals fresh uptrend so it might be worth keeping an eye on these stocks. Waiting till retracement/correction of this rise is complete.
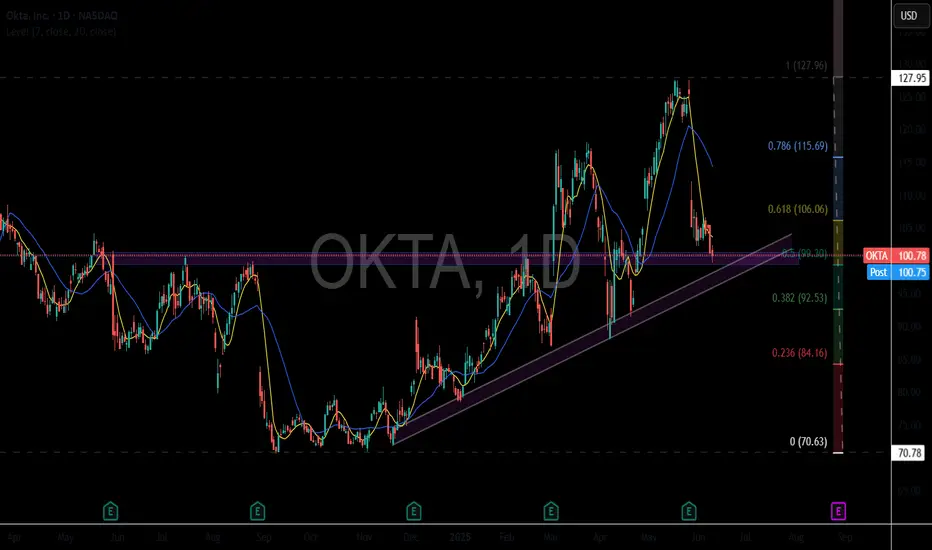
OKTA - DAY TRADE IDEAOKTA is setting up for a day trade scalp long...perhaps an aggressive swing trade as well. The day trade is a much higher probability of success around the $98.50-$99.30
Okta's stock has seen some volatility recently. After a strong rally earlier this year, it pulled back following cautious guidance from the company. Despite beating expectations on sales and earnings for Q1 fiscal 2026, investors were concerned about slowing growth, leading to a 14.6% drop in its stock price.
Okta reported $688 million in revenue, a 12% year-over-year increase, and positive free cash flow of $238 million, but its GAAP earnings were significantly lower than its adjusted earnings. The company maintained its full-year revenue forecast of $2.85 billion to $2.86 billion, reflecting 9% to 10% growth, but analysts tempered their optimism due to macroeconomic uncertainties.
Technicals
- Multiyear Support
- 50 % Fib Retrace
- Upsloping Trendline
- Positive Divergence building on 1/ 4 hour chart.
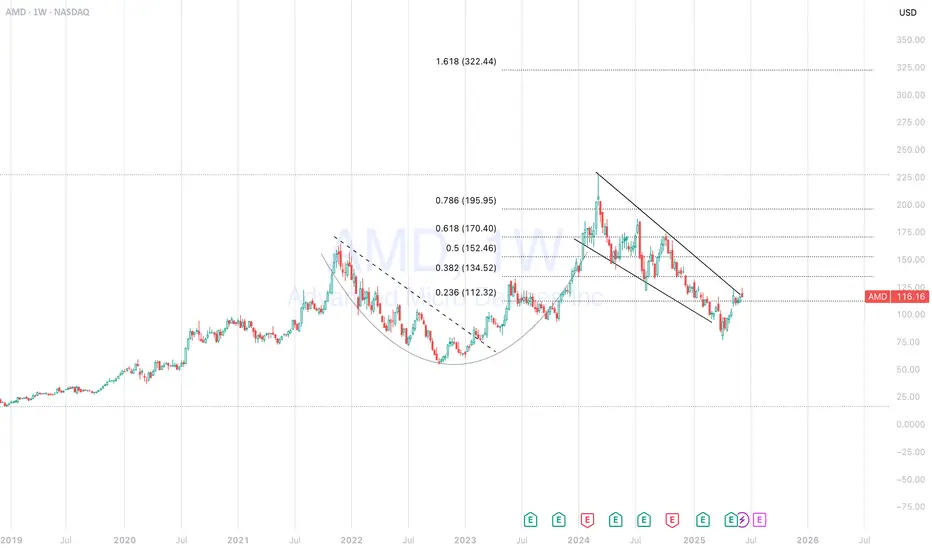
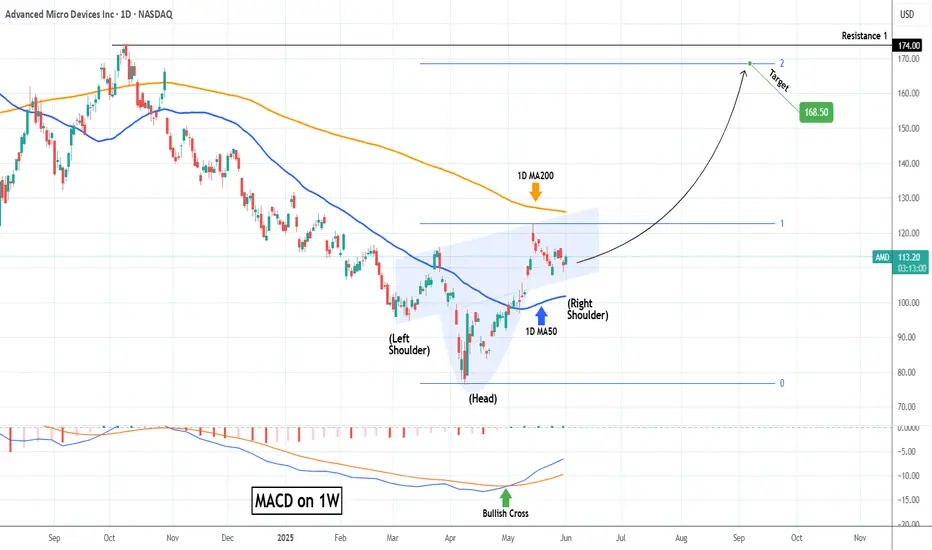
AMD - Inverted Head & Shoulders (Bullish Reversal)Let´s see if we can break the neckline (White trendline) and stay above with a close and possibly a retest on the neckline to confirm this pattern. If so, Im looking for the previous top on daily which is the all time high (So far).
This is not a financial advise. Always do your own research and decision before investing.

Inverted H&S on AMD BULLISH FOR MONDAY !!!! 150$USD JUNE END!!!Analysis of the Inverted Head and Shoulders
- Left Shoulder: The price first dipped, formed a trough, and then rebounded.
- Head: The stock dropped further, creating a lower trough than the left shoulder, followed by a recovery.
- Right Shoulder: A higher low formed, aligning with the left shoulder before the price moved upward.
- Neckline Breakout: The confirmation of this pattern comes when the price decisively breaks above the neckline (resistance level), suggesting a continued uptrend.
Potential Outcomes
- Bullish Breakout: Once the neckline is breached, a surge in buying pressure could push prices higher.
- Volume Confirmation: Increased trading volume at the breakout strengthens the validity of the pattern.
- Price Target: Traders often project the price increase by measuring the distance between the head and the neckline, then adding this to the breakout point.
Given the current price action, this setup could indicate a strong bullish continuation. However, market conditions and external factors should always be considered before making trading decisions.
If you want to refine this analysis or explore other scenarios, I'm here to dive deeper into key points! 🚀 Subscribe! TSXGanG
I hold a CCVM and MNC (Certificate of Competence to become a securities broker anywhere in Canada) and have been working as a trader for five years.
It’s a pleasure for me to help people optimize their trading strategies and make informed financial market decisions.
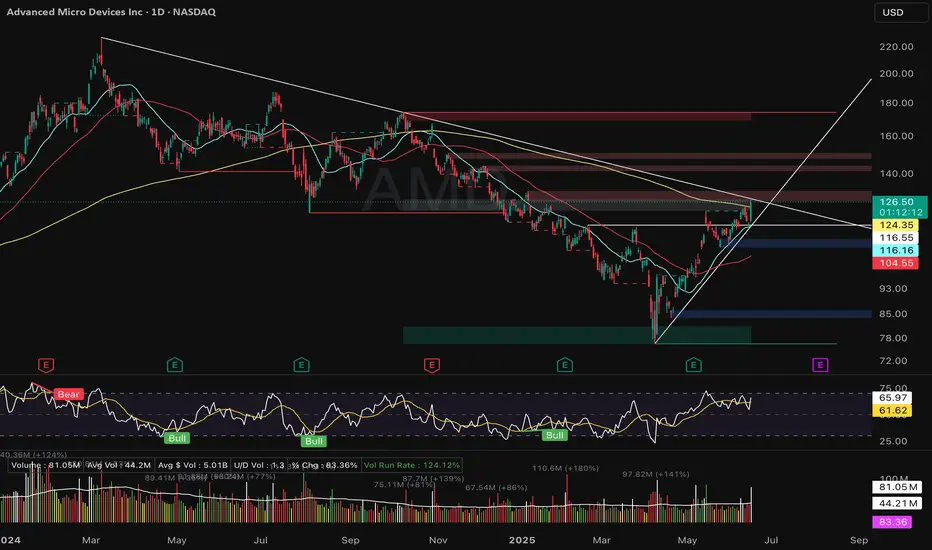
AMD will be bullish if we go higher than 128$ USD (CCVM)AMD (Advanced Micro Devices)
Stock appears to show signs of an imminent bullish recovery, according to several technical and fundamental indicators.
Technical Analysis TSX:AMD
- Current Price: $118.87, up 1.33%.
- Bollinger Bands: Indicate moderate volatility, with a trend toward the upper band.
- Trend Lines: A rising purple curve suggests a possible bullish recovery.
- Buy and Sell Zones: Annotations indicate strategic entry and exit points in the market.
Fundamental Analysis
According to the latest market analyses:
- Revenue Growth: AMD recorded a 36% increase in revenue in Q1 2025.
- Strategic Acquisition: The purchase of ZT Systems strengthens its position in data centers and artificial intelligence.
- Stock Buyback Program: AMD announced a $6 billion buyback, boosting investor confidence.
- Analyst Consensus: The average target price is set at $154.45, indicating significant upside potential.
Conclusion
Technical and fundamental indicators suggest that AMD may soon enter a bullish phase.
If you want to refine this analysis or explore other scenarios, I'm here to dive deeper into key points! 🚀 Subscribe! TSXGanG
I hold a CCVM and MNC (Certificate of Competence to become a securities broker anywhere in Canada) and have been working as a trader for five years.
It’s a pleasure for me to help people optimize their trading strategies and make informed financial market decisions.
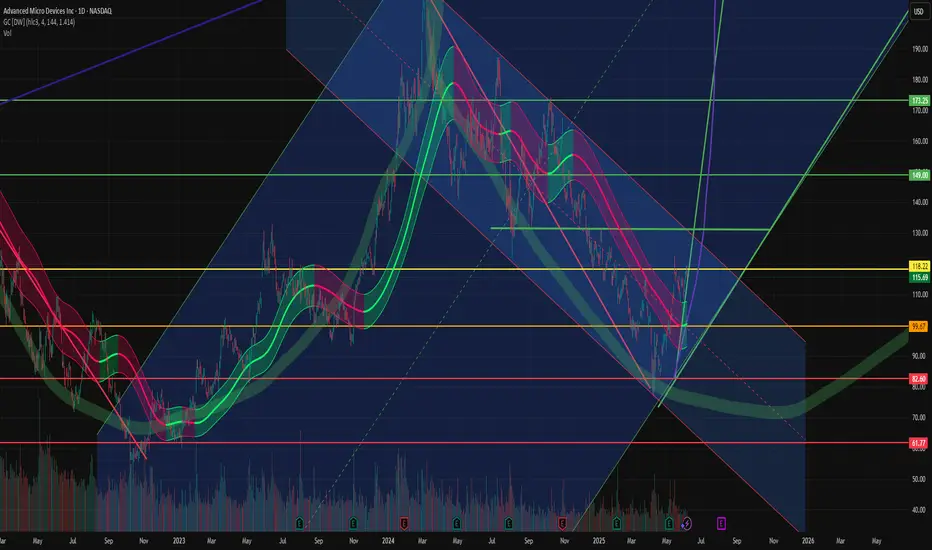
AMD: Short-term Upward PotentialAMD has continued to face downward pressure, preventing further progress in green wave . While this wave still has room to rise, its top should form below resistance at $141.16. Once wave completes, wave should follow—finishing the larger green impulse to the downside and completing the corrective structure of blue wave (II). This move is expected to conclude in our blue Long Target Zone between $62.82 and $35.19. That said, we continue to monitor a 30% alternative scenario: it suggests that wave alt.(II) has already bottomed at $76.12. In that case, AMD wouldn’t visit the blue zone but instead break out directly above the resistances at $141.16 and $174.98—marking the beginning of wave alt.(III).
📈 Over 190 precise analyses, clear entry points, and defined Target Zones - that's what we do.

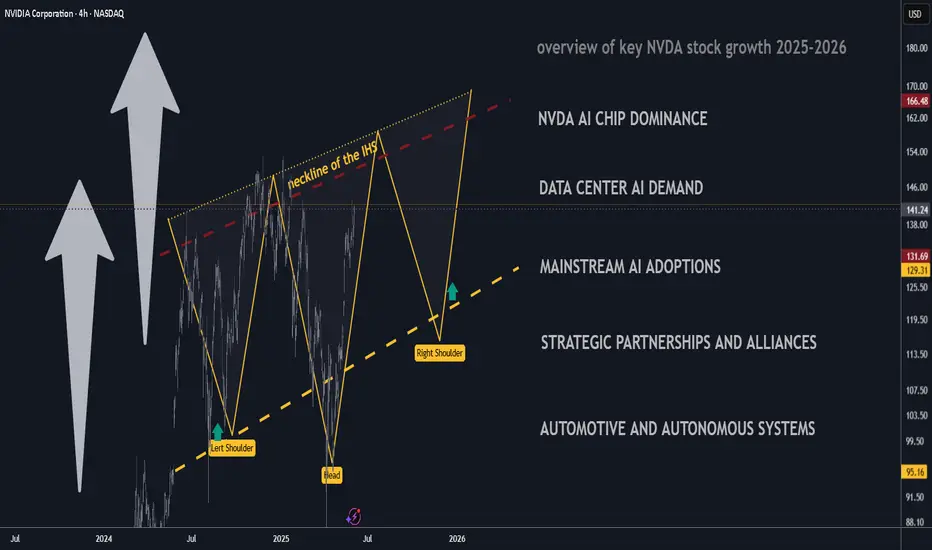
Key Catalysts Driving Nvidia’s Stock Growth 2025 and BeyondKey Catalysts Driving Nvidia’s Stock Growth (Mid-2025 Onward)
Nvidia (NVDA) has solidified its position at the center of the AI computing boom, with record fiscal 2025 revenue of $130.5 billion (114% year-over-year growth) driven by surging demand for its AI chips. Looking ahead from mid-2025, multiple fundamental catalysts are expected to power further stock price growth. Below, we identify 10 primary forward-looking growth drivers for Nvidia, each ranked by expected impact (0 to 10) and analyzed with recent data, forecasts, and developments.
1. AI Chip Dominance – Strength: 10/10
Nvidia is the undisputed leader in accelerated AI hardware, commanding a dominant market share in data-center GPUs and AI chips. Its GPUs have become the backbone of modern AI – Nvidia “holds the pole position” in the AI ecosystem, with industry estimates showing it controls over 90% of the data-center AI processor market. This chip supremacy gives Nvidia tremendous pricing power and a virtuous cycle: more developers adopt its CUDA platform and hardware, further reinforcing its lead. As advanced AI models grow ever more complex, Nvidia’s top-of-the-line silicon (from the current Blackwell GPUs to upcoming architectures) remains the default choice for training and deploying cutting-edge AI, positioning the company to capture the lion’s share of the AI revolution.
2. Explosive Data Center AI Demand – Strength: 10/10
Skyrocketing demand from cloud giants and enterprise data centers for AI compute is a core growth engine for Nvidia. The company’s data-center segment has experienced exponential growth – in calendar 2023, Nvidia’s data center revenue surged by 409%– as hyperscalers raced to build out AI infrastructure for large-scale training and inference. This upward trend is expected to continue into 2025 as companies pour capital into AI-driven services. Notably, tech titans like Meta, Microsoft, Amazon, and Google have collectively pledged over $300 billion in 2025 AI-related capex, reflecting no slowdown in spending on AI servers.
Nvidia directly benefits, as its high-end GPUs (e.g. H100 and Blackwell) are heavily deployed for these AI workloads. In its latest quarter, Nvidia reported data center revenue of $39.1 billion (up 73% year-on-year – an astonishing run-rate driven by relentless orders from cloud providers. With customers reportedly maintaining or increasing their 2025 AI infrastructure plans, data-center demand remains an unparalleled catalyst for Nvidia’s growth over the next several years.
3. Mainstream AI Adoption Across Industries – Strength: 9/10
AI is rapidly becoming ubiquitous in business processes and consumer applications, translating to broad-based demand for Nvidia’s technology beyond the hyperscalers. “AI has gone mainstream and it’s being integrated into every application,” CEO Jensen Huang noted – from logistics and e-commerce to healthcare and finance, organizations are embedding AI to gain efficiency and insights. This everyday AI usage sustains high growth for Nvidia as enterprises large and small invest in AI capabilities, often via cloud services powered by Nvidia GPUs. The company is banking on this pervasive adoption (“AI…in delivery services everywhere, shopping services everywhere”) to drive continued revenue expansion.
Crucially, as AI moves into normal operations – such as automated customer service, supply chain optimization, and data analytics – demand shifts from one-off experimental projects to ongoing, scaled deployments. This creates a steady, secular tailwind for Nvidia’s AI platforms (both hardware and software) across virtually every industry. Analysts expect Nvidia’s revenue to keep rising at a healthy clip (UBS projects ~$147 billion by 2026, up from ~$27 billion in 2023f) precisely because AI adoption is broadening into a long-term, multi-industry growth cycle. In short, the “AI everywhere” era means sustained demand for Nvidia’s solutions well beyond the tech sector.
4. Strategic Partnerships & Alliances – Strength: 8/10
Nvidia has forged high-impact partnerships across tech, industry, and even nations, which amplify its market reach and create new revenue streams. Robust alliances with virtually all major technology players are central to Nvidia’s strategy, enabling it to deliver solutions at massive scale. For example, Nvidia expanded collaborations with cloud providers and enterprise software firms: Snowflake now integrates Nvidia’s full-stack AI platform to help customers build AI applications in the Data Cloud, and ServiceNow is co-developing enterprise AI agents with Nvidia’s tools to transform business workflows.
These deals embed Nvidia’s AI technology into popular platforms, driving indirect adoption of its chips and software. On the global stage, Nvidia is also partnering with governments and sovereign investment funds to supply AI infrastructure. In May 2025, Nvidia announced a major partnership with Saudi Arabia’s AI firm Humain (backed by the Saudi Public Investment Fund) to build out national AI infrastructure. In the first phase, Humain will purchase 18,000 of Nvidia’s advanced Grace Blackwell AI superchips for new Saudi data centers. Such large-scale deals not only yield immediate chip sales but also cement Nvidia’s position as the go-to provider for strategic AI projects. Overall, by teaming up with influential cloud vendors, software companies, automakers, and governments, Nvidia is seeding long-term growth opportunities far beyond what it could achieve alone.
5. Automotive & Autonomous Systems – Strength: 8/10
Nvidia’s push into automotive AI is expected to become a significant growth driver as the auto industry evolves toward self-driving, electrification, and software-defined vehicles. Nvidia’s automotive segment – which provides AI chips and software (Drive platform) for driver assistance and autonomous driving – grew 27% year-over-year recently and is considered the company’s next billion-dollar business line. The pipeline is robust: more than 25 vehicle makers (including EV leaders BYD, NIO, Lucid and stalwarts like Mercedes-Benz, Volvo, Jaguar Land Rover) have adopted the NVIDIA DRIVE system-on-chip for their next-generation cars. Starting in 2025, all new Jaguar Land Rover models will be built on Nvidia’s Drive AI platform (from cloud training to in-car chips), and Mercedes is rolling out Nvidia-powered “Hyperion” AI computers in its 2024 models.
These design wins translate to multi-year revenue streams in hardware and software (through NVIDIA’s DRIVE OS and AI cockpit software). As vehicles become “computers on wheels” requiring sophisticated AI for perception and decision-making, Nvidia is uniquely positioned with its automotive-grade Orin/Atlan chips and full software stack. Additionally, Nvidia’s technology is expanding into robotaxis, trucking, and autonomous industrial machines, tapping markets beyond passenger cars. While automotive AI revenue is smaller today than data center, its growth trajectory (with a design-win pipeline exceeding $11 billion over 6 years makes it a strong catalyst moving forward – effectively adding a new vertical to Nvidia’s growth profile as self-driving capabilities proliferate.
6. Expanding Software Ecosystem & Platforms – Strength: 9/10
A critical (and often underappreciated) driver of Nvidia’s success is its full-stack software ecosystem, which greatly extends its reach and creates a sticky moat around its hardware. Nvidia has spent years developing software frameworks, libraries, and tools (from the CUDA programming platform to AI frameworks like TensorRT and NVIDIA AI Enterprise) that are custom-built for its chipsets. This tight integration means anyone building AI, HPC, or graphics applications can leverage Nvidia’s optimized software to get superior performance – but in doing so, they become tied into Nvidia’s platform. For example, CUDA has become the de facto standard for GPU computing, with countless applications and machine learning models written for Nvidia GPUs.
The result is a virtuous ecosystem: over 4 million developers now work with Nvidia’s SDKs, and the company continually updates its software (e.g. CUDA Toolkit, cuDNN, Triton inference server) to support new AI breakthroughs. Beyond enabling hardware sales, software is becoming a direct revenue stream. The NVIDIA AI Enterprise suite – a cloud-native AI software platform dubbed the “operating system for enterprise AI”– is sold via licenses and subscriptions to corporations deploying AI. Likewise, Nvidia’s DGX Cloud offering provides its AI infrastructure “as-a-service” via cloud partners, contributing to nearly $1 billion in annual recurring revenue already. By expanding its software stack and services, Nvidia not only locks in customers, but also moves up the value chain. This software-centric strategy is a powerful catalyst: it boosts margins, fosters customer loyalty, and opens Nvidia to growth beyond chip sales – for instance, through AI cloud services, enterprise support contracts, and developer platform fees – all of which support a higher long-term valuation.
7. Omniverse and Digital Twin Leadership – Strength: 7/10
Nvidia is spearheading the use of AI and graphics in simulation, positioning its Omniverse platform as the standard for industrial metaverse applications and digital twins. Omniverse is a real-time 3D simulation and collaboration platform that enables companies to create virtual worlds – “digital twins” of products, factories, cities, and even data centers – with physical accuracy. This initiative is forward-looking and strategic: it drives demand for Nvidia’s professional GPUs and AI software as more industries embrace simulation for design, engineering, and operations. Recent developments underscore Omniverse’s momentum: at GTC 2025, Nvidia announced an expansion of Omniverse with major partners like Ansys, Siemens, SAP, and Schneider Electric integrating it into their solutions to build smarter factories, robots and AI-driven facilities.
In other words, leading industrial software providers are embedding Nvidia’s metaverse platform to help enterprise customers digitize their operations. The Omniverse allows engineers to visualize complex systems and test scenarios virtually – for example, designing a gigawatt-scale AI data center in simulation (including cooling and electrical systems) before building it in reality. Automakers use Omniverse to simulate autonomous driving; architects create virtual building models; manufacturers test production line changes in a risk-free virtual space. As this “industrial metaverse” trend grows, Nvidia’s early lead could yield a new ecosystem (and revenue source) of Omniverse software subscriptions, cloud services, and associated hardware sales. While still emerging, the platform’s potential is significant – it extends Nvidia’s reach into every field that uses simulation or 3D design, leveraging its core strengths in graphics and AI. In the coming years, Omniverse-driven demand for GPUs (for rendering and physics simulation) and software could become a notable catalyst augmenting Nvidia’s more mature segments.
8. Continuous Innovation and Product Roadmap – Strength: 9/10
Nvidia’s planned GPU hardware roadmap through 2027 (Ampere/Hopper to Blackwell to Rubin architectures) demonstrates its aggressive cycle of innovation, with each generation delivering major leaps in AI performance.
A key reason Nvidia maintains its edge is relentless R&D yielding regular leaps in performance – a pipeline of new GPUs and systems that keep customers upgrading. The company’s roadmap beyond mid-2025 is packed with heavyweight launches. Its current flagship data-center GPU family, Blackwell, only ramped production in early 2025, yet Nvidia is already preparing the next architecture, codenamed “Rubin,” for 2026. CEO Jensen Huang has affirmed that Blackwell Ultra GPUs (a mid-cycle upgrade with faster memory and networking) will debut in late 2025, followed by the next-generation Rubin GPU platform shortly thereafter. Partners are “getting up to speed” on Rubin, which is expected to provide a “huge step up” in AI capability. In fact, Nvidia has outlined a cadence of major launches every even year (2024 Hopper → 2026 Rubin → 2028 Feynman, etc.), with incremental updates on odd years. This rapid pace matters for the stock: each new generation spurs a replacement cycle as cloud firms, enterprises, and supercomputing centers upgrade to unlock higher efficiency.
For instance, the Blackwell-based systems offer up to 1.5× the performance of the prior Hopper chips, and Rubin is expected to jump even further, enabling more advanced AI models (critical as the industry chases artificial general intelligence). Nvidia’s ability to consistently deliver order-of-magnitude improvements – e.g. through more memory (HBM4E), faster interconnects, and specialized AI cores – encourages customers to expand their Nvidia-powered infrastructure. In turn, it deters competitors who struggle to match Nvidia’s R&D breadth. This continuous innovation cycle ensures that as AI workloads grow, Nvidia will have the cutting-edge products ready – keeping demand (and revenue growth) on an upward trajectory.
9. Full-Stack Expansion (CPUs, DPUs & Networking) – Strength: 8/10
Nvidia is evolving from a pure GPU vendor into a full-stack data center platform provider, expanding into CPUs, networking, and data processing units (DPUs). This strategic broadening of its product portfolio substantially increases Nvidia’s addressable market and lets it capture more value per system. Notably, Nvidia’s homegrown CPU (central processor), codenamed Grace, began shipping to customers in 2024–2025. Grace is a high-performance Arm-based CPU designed to pair tightly with Nvidia GPUs, capable of handling enormous data flows between chips – a crucial advantage for AI and HPC workloads. By offering its own CPU, Nvidia can sell complete server platforms (CPU+GPU) and optimize the whole system for AI. Jensen Huang highlighted that integrating GPUs with CPUs can boost computing speeds by 100× while only tripling power usage, underscoring the efficiency gains of Nvidia’s full-stack approach.
Alongside CPUs, Nvidia has invested in networking and interconnects (acquiring Mellanox in 2020) and now leads in ultra-fast data center networks. Its latest Spectrum-X switches and ConnectX/BlueField SmartNICs (DPUs) are built to alleviate data bottlenecks in AI supercomputers. Industry analysts predict rapid growth in this DPU/SmartNIC space (a ~$5.5 billion market by 2031), and Nvidia is well positioned to dominate it with BlueField. By selling DPUs and switches alongside GPUs, Nvidia ensures that AI clusters can scale out efficiently, which is a key selling point for cloud providers. Importantly, these moves encroach on traditional CPU and networking incumbents – every Nvidia Grace CPU or BlueField DPU sold potentially displaces a competitor’s chip, consolidating more of the data center stack under Nvidia. The full-stack strategy thus acts as a force-multiplier for growth: Nvidia can address virtually every component of AI infrastructure, from processing to networking to storage acceleration. As customers increasingly prefer integrated solutions, Nvidia’s ability to provide the “entire package” drives incremental revenue and strengthens its competitive moat in the AI infrastructure market.
10. Global AI Infrastructure & New Markets – Strength: 8/10
Nvidia’s growth is set to benefit from international expansion and a wave of government-driven AI infrastructure investments. Around mid-2025, export policies began to favor Nvidia’s business, widening its reachable market. The U.S. Commerce Department’s rollback of certain AI chip export rules in May 2025 removed restrictions on which countries Nvidia can sell advanced AI chips to, easing a headwind that had weighed on the stock earlier. This policy shift, coupled with surging interest in AI globally, has unlocked huge orders from new regions. For instance, the Middle East is emerging as a major AI hub: the United Arab Emirates reached a preliminary agreement with the U.S. to import up to 500,000 of Nvidia’s high-end AI chips per year starting in 2025 – a massive volume aimed at making the Gulf a “third AI power center” alongside the US and China. Similarly, Saudi Arabia has announced plans to invest hundreds of billions in tech and is buying a TON of Nvidia chips for its own “AI factories” as part of a $600 billion investment pledge in U.S. and AI infrastructure.
These moves reflect a broader “sovereign AI” trend: governments and enterprises worldwide are building domestic AI supercomputers (for national security, research, or competitive advantage) – and Nvidia is the go-to supplier for the requisite hardware. Additionally, markets like India, Southeast Asia, and Latin America are ramping up cloud data center builds and AI initiatives, representing new growth frontiers for Nvidia’s datacenter GPUs. Even in China – despite ongoing export controls – Nvidia has navigated restrictions by offering modified chips (like the A800/H800) to continue serving demand. Altogether, the global arms race in AI computing acts as a tailwind for Nvidia: it guarantees a steady stream of orders from across the world. With geopolitical allies now explicitly allowed (and eager) to procure Nvidia’s top chips, the company stands to fill the AI compute gap globally, driving revenue growth beyond the traditional U.S. customer base. In summary, expanding international markets and large-scale AI infrastructure projects are a catalyst that could propel Nvidia’s next phase of growth.
Sources: The analysis above incorporates information from recent Nvidia financial reports, press releases, and expert commentary, including Nvidia’s FY2025 earnings, CEO Jensen Huang’s statements on AI demand, analyst insights on spending and growth forecasts, and news of key deals and policy changes affecting Nvidia. These catalysts underscore Nvidia’s unique positioning at the intersection of AI hardware, software, and global adoption, suggesting that from mid-2025 onward, the company has multiple powerful growth drivers supporting its stock’s long-term trajectory.
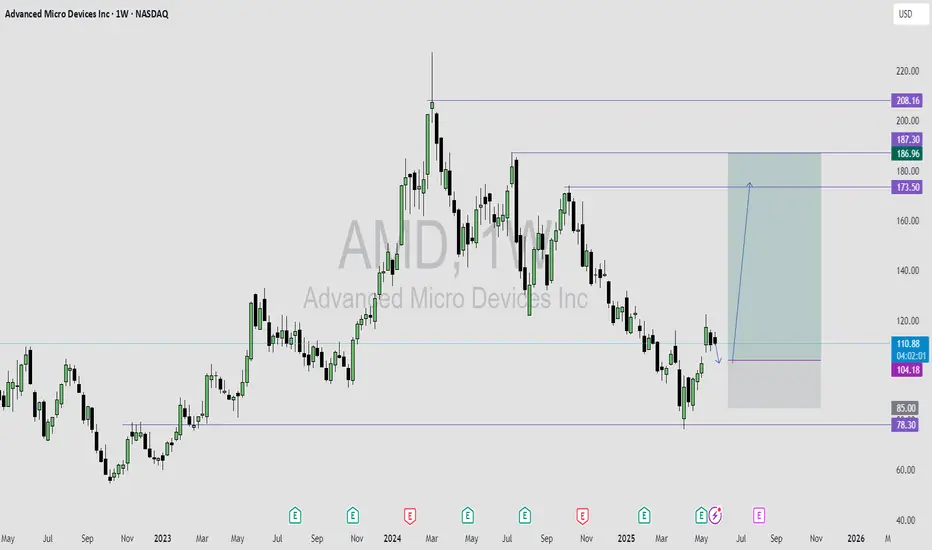
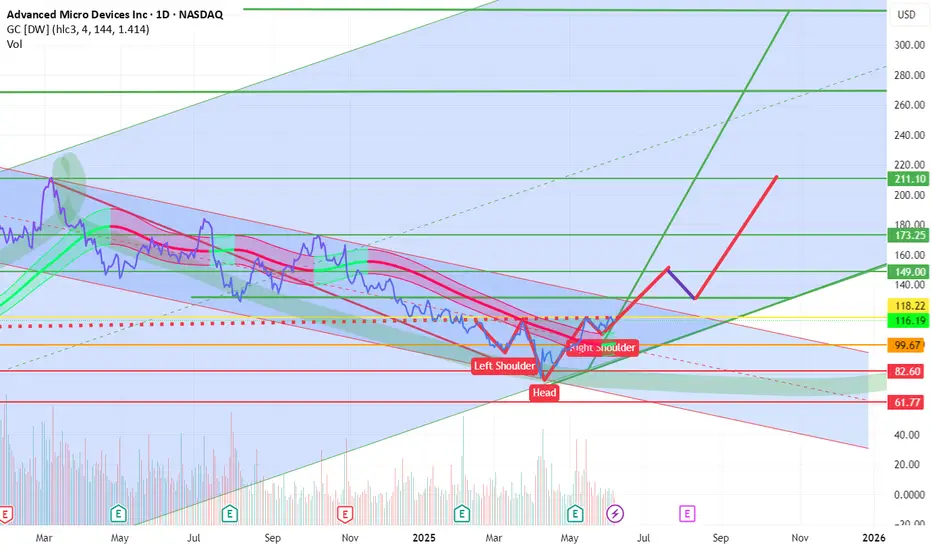
AMD Inverse Head and Shoulders waiting for massive break-out.Advanced Micro Devices (AMD) has entered a wide consolidation range within the 1D MA50 (blue trend-line) and 1D MA200 (orange trend-line) following the May 14 High. From a wider scale, this is technically seen as the Right Shoulder of an Inverse Head and Shoulders (IH&S) pattern.
This is generally a bullish reversal pattern and it is no coincidence that the Head was formed exactly on the market bottom (April 08). With the first long-term buy signal already given by the 1W MACD Bullish Cross, as long as the 1D MA50 holds, a break above the 1D MA200 would confirm the next rally phase.
Technically when the Right Shoulder break-outs take place, they target the pattern's 2.0 Fibonacci extension. That's now exactly at $168.50 and this is our medium-term Target.
-------------------------------------------------------------------------------
** Please LIKE 👍, FOLLOW ✅, SHARE 🙌 and COMMENT ✍ if you enjoy this idea! Also share your ideas and charts in the comments section below! This is best way to keep it relevant, support us, keep the content here free and allow the idea to reach as many people as possible. **
-------------------------------------------------------------------------------
💸💸💸💸💸💸
👇 👇 👇 👇 👇 👇
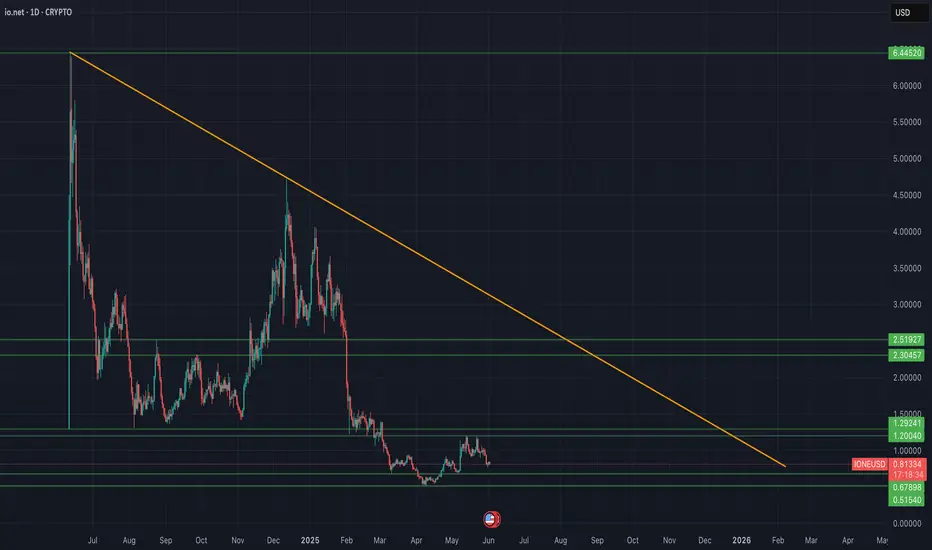
Decentralized AI Infrastructure in a trade war between US/ChinaThe AI revolution is real, but it has a critical weakness: GPU scarcity.
NVIDIA's H100s are sold out to specific countries around the world, serving as crucial hardware for AI development. Cloud costs are skyrocketing. Access to compute is being gatekept by Big Tech. Meanwhile, China is no longer allowed to purchase these GPUs from the US due to the ongoing trade war and the escalating AI arms race between the two countries.
Enter $CRYPTO: IONEUSD — a decentralized GPU network on Solana aiming to become the infrastructure layer for AI, machine learning, and high-performance computing.
Just like Helium tokenized wireless infrastructure, IO is tokenizing global compute power.
-AI is the fastest-growing sector globally, but compute remains the biggest bottleneck.
-Cloud GPU costs are 4–10x higher than decentralized alternatives.
-IO.Net positions itself at the intersection of AI, Web3, and tokenized infrastructure.
-IO is early in its growth curve, currently holding a market cap of $131 million.
I believe that IO.Net could represent a way for China to compete with the US in the AI race, offering a high-demand substitute for expensive and sanctioned chips — helping China stay competitive in AI development.
Because IO.Net is decentralized, it cannot be easily shut down. I believe IO.Net is here to stay and has strong potential to grow significantly from its current market cap of $131 million.
COINBASE:IOUSD
NASDAQ:NVDA
NASDAQ:AMD
NYSE:TSM
BITSTAMP:BTCUSD
BINANCE:SOLUSD
AMEX:SPY
$AMD $120 retest then $130 push through. R/R looks incredible..Hello, NASDAQ:AMD Advanced Micro Devices, INC looks TASTY. I'm almost salivating. NASDAQ:NVDA may take a backseat and NASDAQ:AMD could start seeing monster upside. Something in my gut is telling me this name wants to GO. I'm looking at $120c for 6/20 and $130c for 6/20. This thing can launch.. it's hanging on an upside trendline, it may break but this $110 area may represent local support. Earnings report were good and after an abysmal 2024 after having highs and totally wiping them out hitting lows of $80, I think this could be the time for NASDAQ:AMD longs. It has taken the 20 day EMA/SMA over and now could curl to the 200 day EMA/SMA. 200 SMA is $126. This seems like a really good setup especially R/R here. Very cheap calls for a name that can see a 10-15% week.
WSL.
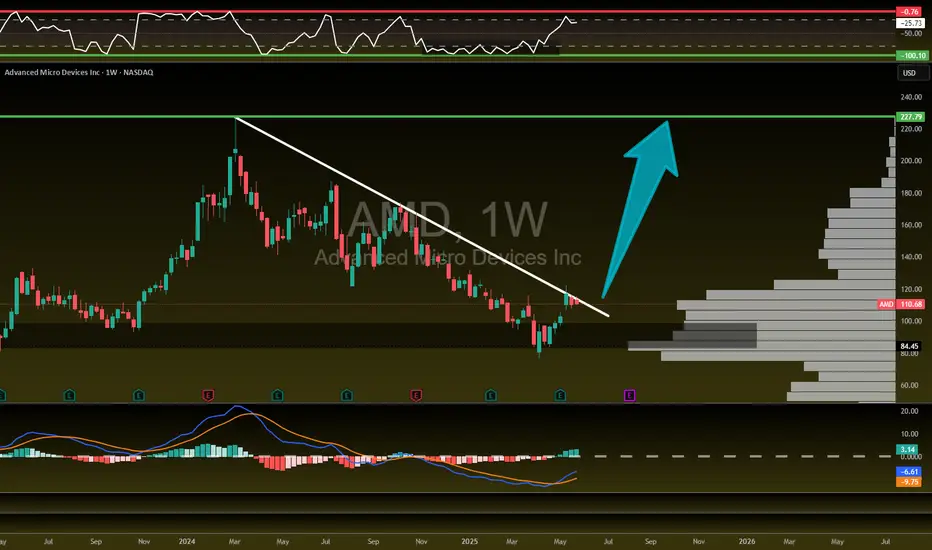
$AMD When, not IF! 105% UPSIDENASDAQ:AMD - It's not a matter of if, but when...🚀
Once this downtrend on the weekly is broken out of with a big fat engulfing candle we will launch off this volume shelf like a SpaceX rocket to mars!
All indictors are curling up and I think the time is coming for AMD to make their ascent higher and back to ATHs!
AMD LONG IDEA: AMD IS READY FOR A GOOD BULLISH RUNAMD is bouncing off the monthly time frame key level that is acting as support for price.
On weekly time frame and daily we had a shift in market structure from bearish trend to bullish.
I will be buying AMD on this retracement to the recent weekly gap created by price.
Once I see a good bullish price confirming that the retracement is over, i will enter for a buy trade.
My overall target is the 187 price level.