AMD DOUBLE RESISTANCE! PERFECT?AMD had a nice pump this week and not it's in a little bit of trouble. There is a confluence stopping it's bullish price action. Two major resistance levels merge and AMD looks like it will need to retrace back to the support below before another attempt at moving higher.
If price stays where is it by Monday open, I will enter a short position with my stop above the current local high.
Calculate Your Risk/Reward so you don't lose more than 1% of your account per trade.
Every day the charts provide new information. You have to adjust or get REKT.
Love it or hate it, hit that thumbs up and share your thoughts below!
This is not financial advice. This is for educational purposes only.
AMD

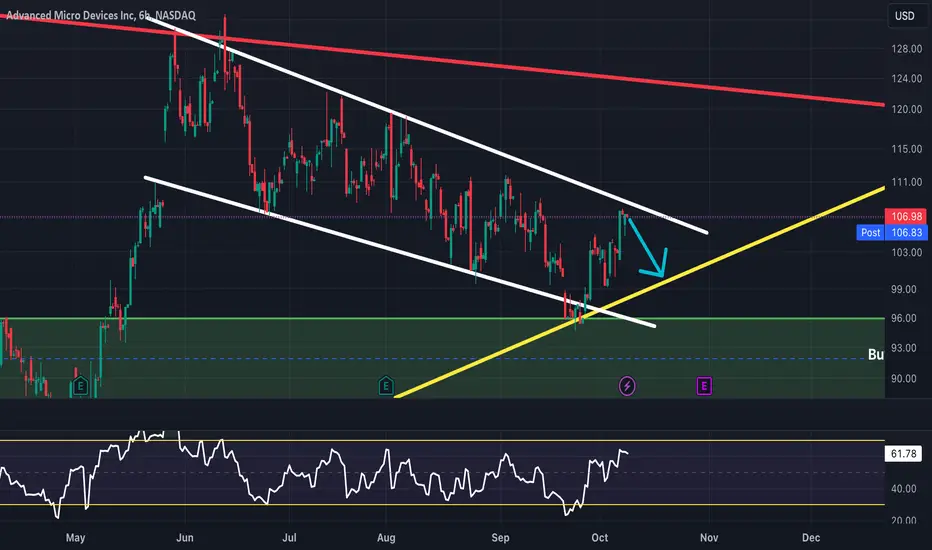
$AMD Due for a Correction This WeekAMD has been showing a lot of bullishness since September 26. However, AMD has reached the upper range of the white channel and is due for a correction this week. I have the yellow trend line as a key support level and my first price target. I think there will be a solid bounce off this yellow support line in the short term.
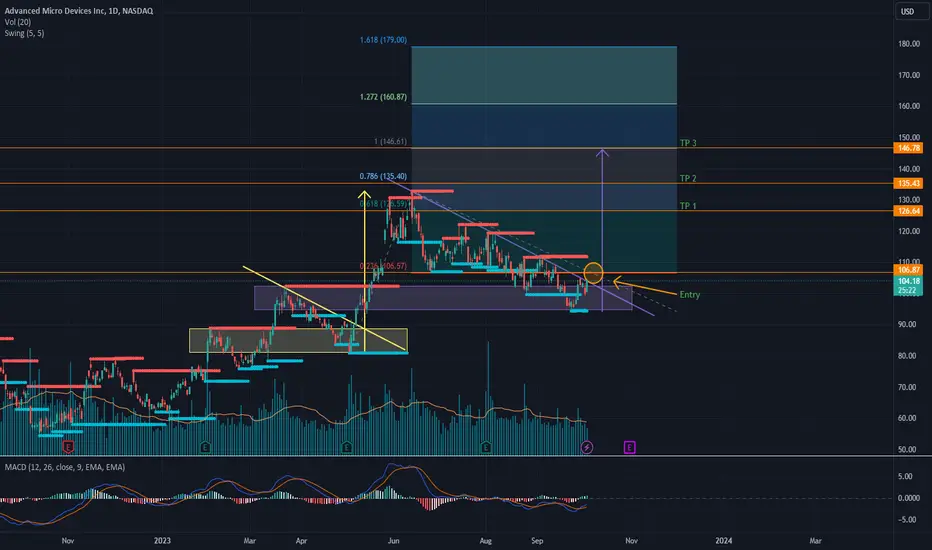
AMD Daily timeframeafter valid breakout from wedge patern in daily timeframe with candle we can enter to long position with 4 risk to reward that its good
maybe price want to meet trend line again.. pay attention to this
good luck
AMD opening @ reversal zone with max dip ~97-98Watch AMD for a bounce at 97 on a market open fakeout.
I already alerted puts (bearish) @ 108 and the stock is already down -8%. That's a large gain in 3 days. Watch for key reversal. If it doesn't reverse, can see a lot of volatility.
Tagged the puts idea.
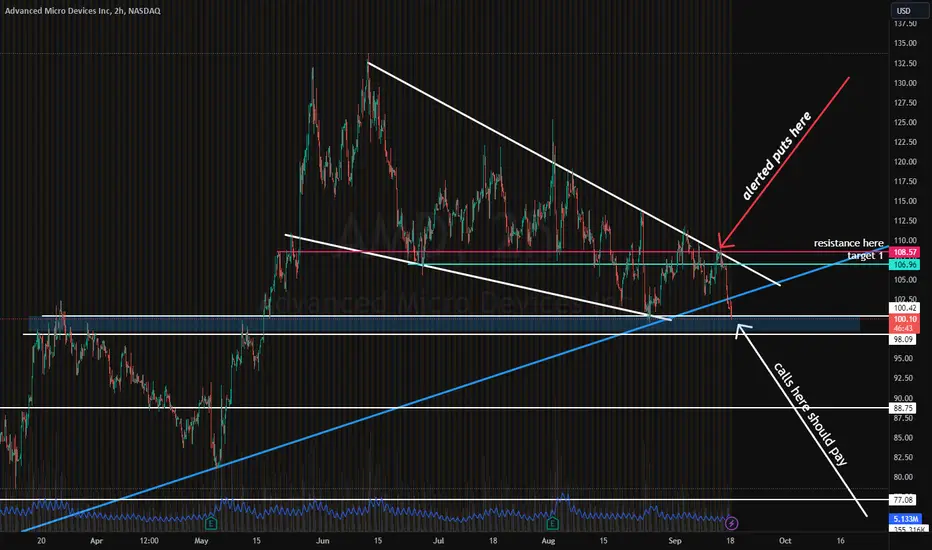
AMD @ flag trendline & 200 SMA. Next major demand zone 85 to 88If you remember my post from earlier this/ last week, my max dip on NASDAQ:AMD short term was 96-97. This is exactly where we're opening today. Expecting a small reversal that which the strength of will wholly depend on CME_MINI:ES1! CME_MINI:NQ1! AMEX:SPY NASDAQ:QQQ
200 SMA bounces are usually very strong. When price starts heading below this SMA, you should start to be cautious. Of course, sometimes there's a mini fakeout under the SMA and right back up.
Watch this critical level here.

📈 AMD back @ flag's top trend. Watch for breakout/ rejectionJust a recap of this trade so far:
Posted this @ 108 calling for a bearish rejection.
After it failed to bounce from 101-103, I was certain it'd head over to 95-98, or the bottom TL at most.
When we hit the bottom TL, I called for a buy signal @ 95.
Will tag all these for proof.
Now we are at the top TL, which is the ultimate PT from 95. We hit this in 2 days. +10% in 2 days. That's right.
When you wait for swings to come to you, you will make the most money.
Here's the alert @ 95-96:
We waited a week or two for this perfect bounce. That's the best way to swing.
One way to swing is to buy, buy more, buy more, and buy some more. Another way, is to wait for the right moment and wait for the trade to come to you. If you miss it, you miss it. All good, there's tons of trades on the market.
NASDAQ:AMD NASDAQ:QQQ AMEX:SPY NASDAQ:TSLA NASDAQ:NVDA

AMD Falling Wedge Breakout - BullishWe traded AMD for over 100% leveraged profits a few moths ago. After hitting both our targets it made its way back to support to give us another great opportunity with a perfect RR.
Check out our older trade and it's perfection.
This trade is less convincing than the last, however the stop loss level is clear as there would be no reason to hold the asset below that support.

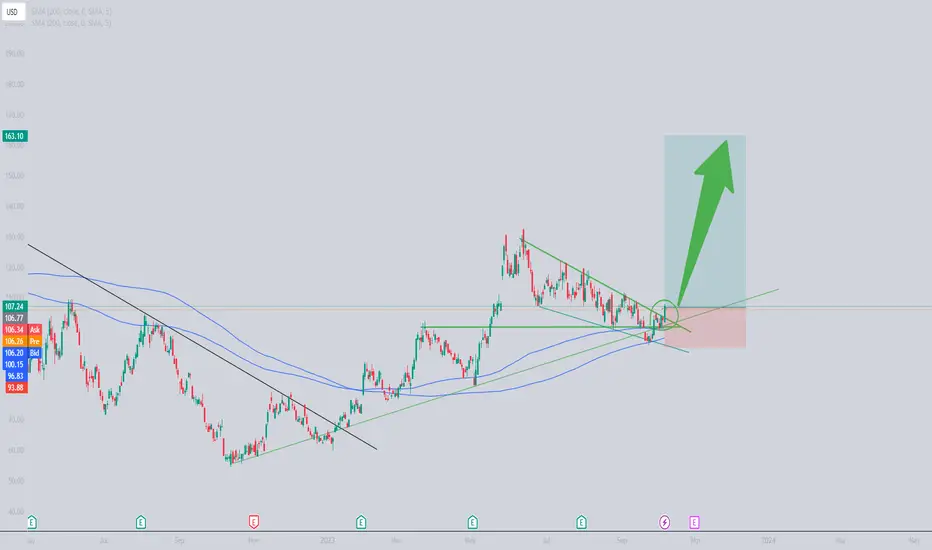
AMD Technical analysis - Repeating trend?It looks like currently we're facing two resistances, if trend repeats as the previous one we could enter to another uptrend.
I have pointed out what could be a good entry point after pass both of them as well as possible take profit points based on Fibonacci Extension.
Any feedback is very welcome.
Regards.
Disclaimer: This is not investment advice and is intended for informational purposes only.

$AMD Quarter 3 (Q3) AnalysisAMD is playing out as planned since the initial Q2 prediction with a dip into the buy zone. I’ve been saying that AMD is an excellent buy opportunity under $100, and the bearish August and September price action has helped to send AMD down to this price level. I have $158.53 as a key price target for Q4, and I believe that AMD will form a new all-time high afterwards. Long-term I think AMD will be a $400-500 stock. The yellow trendline has been acting as a support level and AMD just formed a bullish bounce off this support. The red trendline will act as short-term resistance on the way up.

Fundamentals from Technicals: AMDThe NASDAQ:AMD Weekly Chart shows that the stock had attempted to complete the long term bottom at 104.
But over the past few weeks, it dipped below that bottom completion level.
This week it has started move up. This provides a level of fundamental support.
If it had continued downward, then fundamentals would be lower. For now, it appears fundamentals are within the outlined range, an accumulation zone.
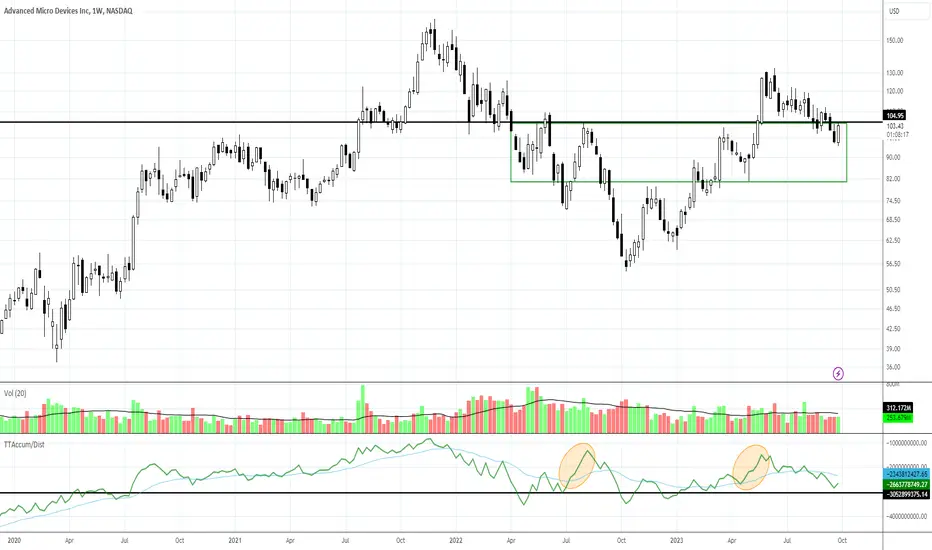
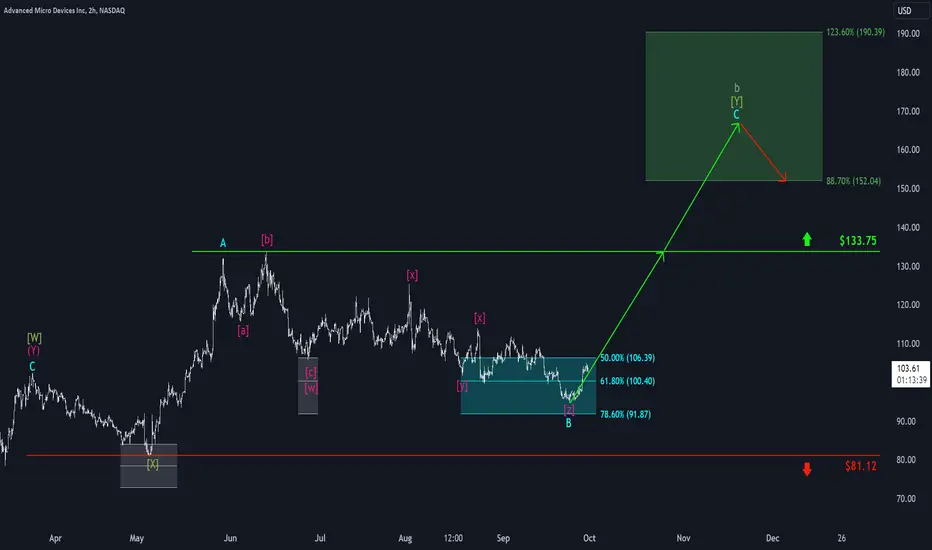
AMD: Here we go! 🎢Over the past few weeks, AMD stock has again visited lower levels below the 61.80% retracement in the turquoise target zone between $106.39 and $91.87. However, as of this week, the stock has been moving decisively higher, and we now believe that the bottom of the turquoise wave B has been completed. As a result, the price should now be in the turquoise wave C, which will take it higher. First, the resistance at $133.75 should be breached, ensuring further upside momentum. After that, the rise should continue significantly. The green target area between $152.04 and $190.39 is where we expect this wave's completion and, thus, the end of superior wave b in gray.
AMD approaching meaningful supportAdvanced Micro Devices (AMD) presently approaching meaningful support, able to absorb weekly selling pressures.
From here, (AMD) can recover and push to our next notable resistance level, eliciting gains of 10% from current price levels.
A settlement above this resistance level would push (AMD) to our next notable breakout point, able to absorb weekly buying pressures when tested and a meaningful upside continuation point into later year.
Inversely, a weekly settlement below the shown support would put (AMD) into a sell signal where losses of 20 - 30% would be expected over the following 3 - 5 months.

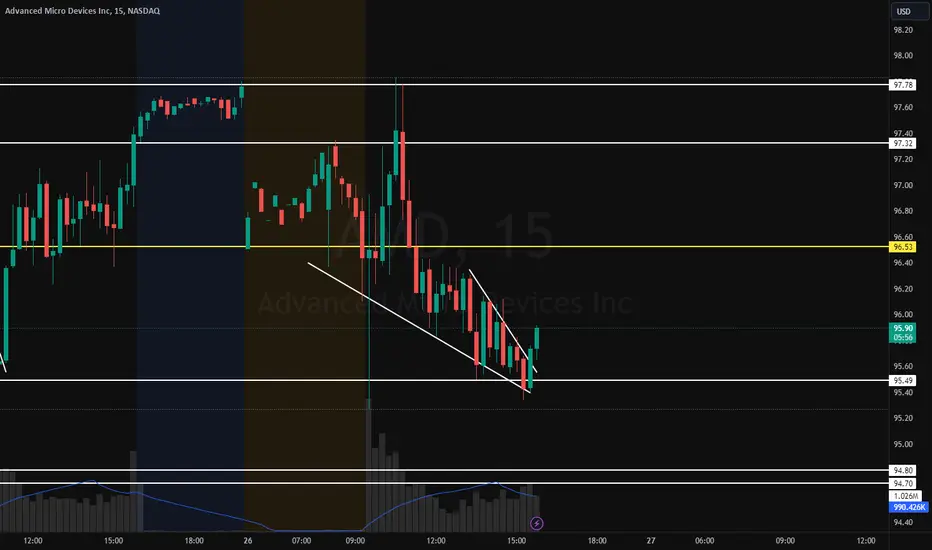
$AMD falling wedge to end today's action. Good signGood sign on NASDAQ:AMD with that falling wedge on the 15 min.
When a stock's been hammered for no reason at all except market volatility, we usually try to look for bullish reversals or bullish signs to enter on a swing.
Closing in a falling wedge is good. Doesn't ALWAYS pay off, but if you are swinging it likely means 4-12 weeks anyway, so it's relatively safe here.
Also looking on the Daily chart, it's right on the bottom of the flag trendline:
Follow for more insights.
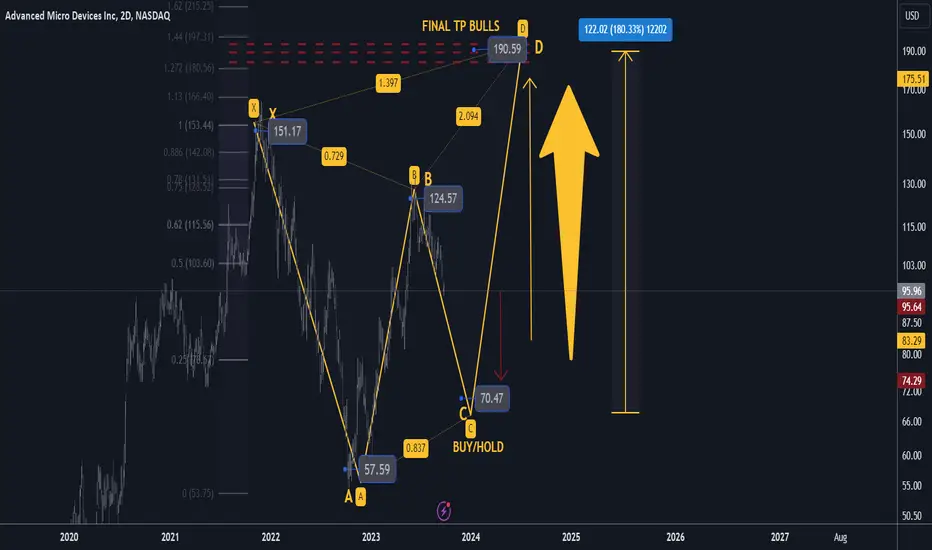
AMD 2d XABCD advanced buy setup TP +185% gains🔸Hello traders, today let's review the 2days/candle AMD price chart.
Recently solid gains off the lows near 58 USD usd and currently pullback/correction
in progress after we maxed out at 125 usd. Having said that, bull run is not over yet,
and after correction expecting strong performance and new ATH for AMD.
🔸Setup is based on speculative XABCD structure, point X at 151, point A and 58,
point B at 124, point C at 70 usd and finally point D/PRZ at 190 usd.
🔸recommended strategy bulls: advanced buy/hold setup at point C 70 usd,
TP bulls is 190 usd point D, buy/hold setup, patience required.
keep in mind that this is advanced entry strategy for the bulls.
185% gains potential so we got great risk/reward in this trade setup.
recommend to confirm reversal/bottom with other indicator.
good luck traders!
🎁Please hit the like button and
🎁Leave a comment to support our team!
RISK DISCLAIMER:
Trading Futures , Forex, CFDs and Stocks involves a risk of loss.
Please consider carefully if such trading is appropriate for you.
Past performance is not indicative of future results.
Always limit your leverage and use tight stop loss.
$AMD LONGNASDAQ:AMD
Possible Head and Shoulders Pattern if Price Action goes through the Cloud.
IMO -> Good Risk/Reward

AMD Swing SetupAMD falling wedge into ~$95 demand. Could we see some demand step in and a wedge break for a swing trade? I'll be looking for a long if we start seeing some support/demand in this area for a swing trade.

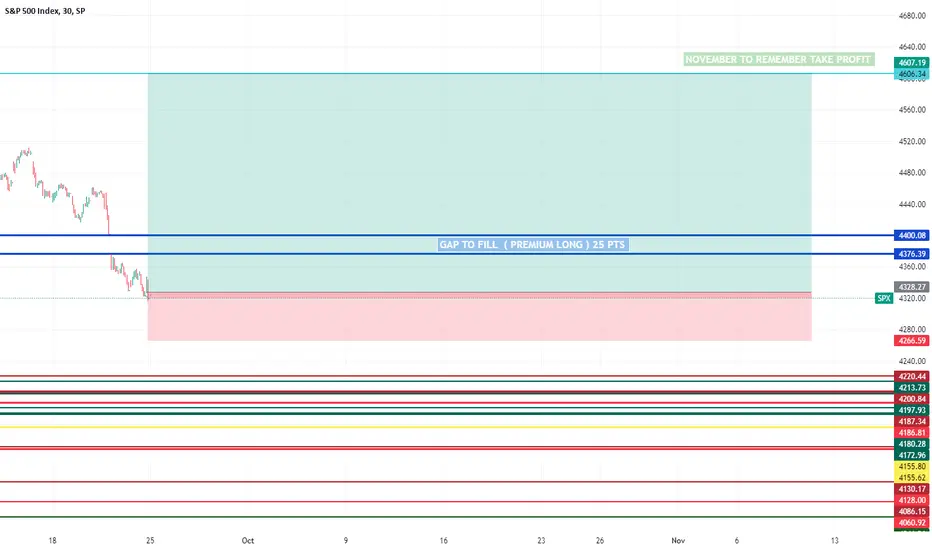
SPX READY TO LONG SPX LONG UNTIL 4600
Microsoft Rolling out Pilot 365
Iphone Pro Max Titanium Sales for Christmas
Nvidia Bullish
Amazon Sales for Christmas
Technical reversal
Be Patient
SIze According to your Posotion
Focus on Price action
do NOT Over trade
LET THE MARKET COME TO YOU !!!
DO NOT CHASE THE MARKET !!
Cafe City Studio 2024
Stay Profitable !! GBA !!
AMD (wait for sell)Hi everyone - I'm with you with AMD signal and analysis. By checking the weekly and monthly graphs of AMD, the signs of decreasing power of the ascent can be seen. And in the daily time frame, the rotation of the market can also be clearly seen. And also, the bearish power has increased compared to the bullishness of the market.
In the 4-hour time frame, you can see that it touched the ceiling of the channel several times, but it did not break and reached an important level. By closing the price below this level, a good opportunity to sell opens up and we can make a good profit. And bearish can continue until the end of the weekly channel (green channel).

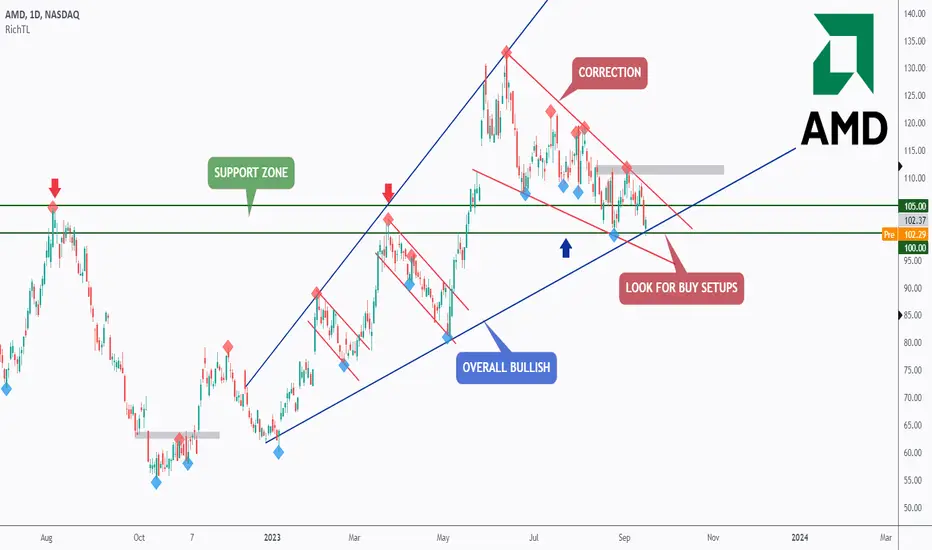
Advanced Micro Devices - Is The Future 🌐Hello TradingView Family / Fellow Traders. This is Richard, also known as theSignalyst.
AMD has been overall bullish trading inside the rising wedge pattern and it is currently in a correction phase approaching the lower bound / blue trendline.
Moreover, the zone 100 - 105 is a strong support.
🏹 So the 100.0 round number is a strong area to look for trend-following buy setups as it is the intersection of the green support and lower blue trendline acting as a non-horizontal support.
As per my trading style:
As AMD is sitting around a rejection zone, I will be looking for bullish reversal setups (like a double bottom pattern, trendline break, and so on...)
Moreover, for the bulls to take over long-term again for the next impulse to start, we need a break above the last major high in gray around 112.5
📚 Always follow your trading plan regarding entry, risk management, and trade management.
Good luck!
All Strategies Are Good; If Managed Properly!
~Rich
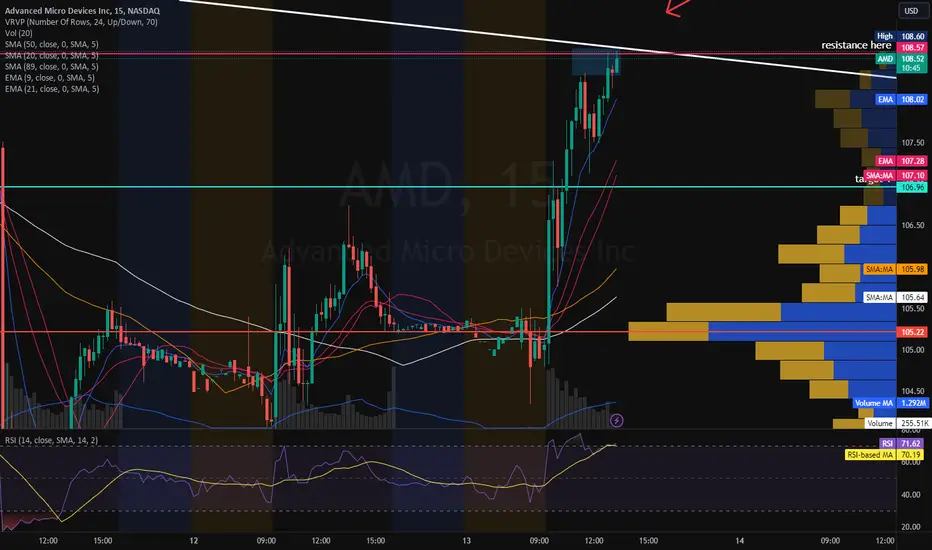
DayTrade/Overnight. AMD potential resistance @ 1D TL & supply 5mAMD approaching supply on the 5/15 min chart:
AMD approaching TL rejection/ resistance on the 1D chart:
I need another confirmation and I will enter.
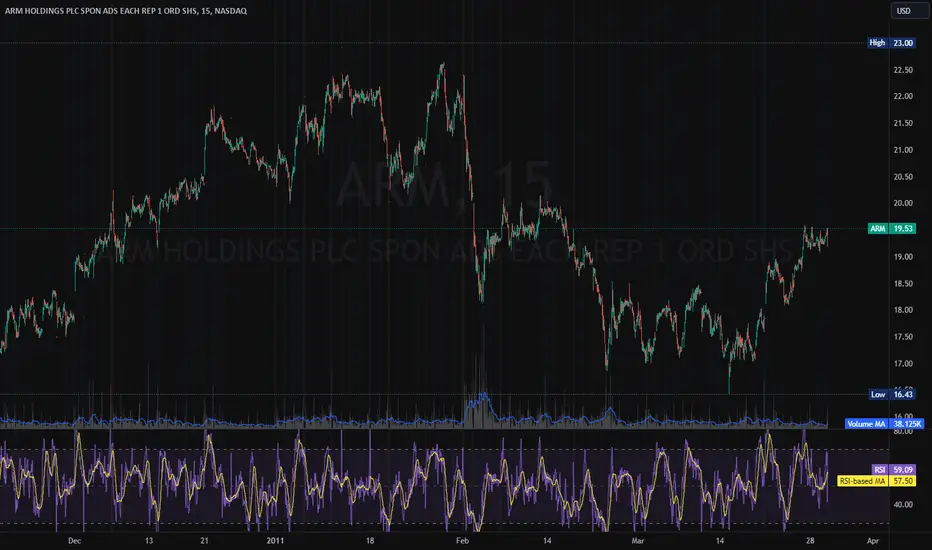
🔥 ARM IPO: Worth the hype? Should I chase? What even is it?ARM DD:
Before you read this, understand that trying to buy IPOs when they begin trading isn't guaranteed and if you market buy, you will get roasted. It's not good to chase IPOs. No matter if this is the next NASDAQ:AAPL NASDAQ:TSLA and NASDAQ:AMZN combined, do not chase and only make wise and calculated decisions while trading.
I've been waiting for this IPO for a while. It's finally here. It might be the most over anticipated IPO in a while. Trade carefully. Do not chase blindly. Have a plan. Trade the plan. If it doesn't come, move on.
If you learn something or want to trade with me, give me a follow & join my community. Thanks.
IPO valued @ $55B.
Around $51 per share.
They are only releasing 9% of the total shares to the public. So it has a tiny float.
SoftBank is the owner, they bought ARM 7 years ago.
The floor for me is 40B USD valuation. Meaning, around $38.50 is support. Where did I get that number? NVDA was closing on buying ARM for 40B USD in 2020.
NASDAQ:NVDA , NASDAQ:INTC , NASDAQ:AMD , NASDAQ:AAPL , NASDAQ:GOOG , TSM, Samsung, are all interested in investing in ARM.
What does ARM do?
ARM is not a chip manufacturer.
ARM designs chips & system processors & holds patents to chips and they license their technology to other big tech like AAPL, NVDA. Hence, NVDA wanted to buy them for 40B USD.
THE POSITIVES:
SoftBank bought out someone's 25% stake in ARM recently. For 16B USD. That puts it at a FWB:64B valuation in their eyes. That means the owner of ARM expects ARM to surpass 64B USD.
NVDA CEO loves ARM, but NVDA failed to acquire it.
NVDA CEO has been selling NVDA. Around 150k shares this year. Last sale 14M USD on 9/11/23. IMO he's freeing up to buy ARM @ IPO. Remember SoftBank is a 90% owner. Everyone who wants it gets it at IPO. Yes, even NVDA CEO.
The float is tiny, and asset managers .
NYSE:TSM expressed interest of 100M USD investment
This might be the most hyped IPO in a while.
THE NEGATIVES:
SoftBank is a known dumper.
SoftBank bought ARM in 2016 for $32B. They tried flipping it in 2020 for 40B USD to NVDA. So they were happy with a 8B flip USD in 4 years. Sus. Shows signs that if ARM does well, they'll unload.
Because SoftBank are known dumpers, once they dump one time, investors will get shook.
Their net income is low. Under 550M.
Their revenue is around $2.7B.
Their net income dropped YoY.
Again, I will evaluate if I'm buying this and post my entries/ exits in my community. Welcome to join.
Stay tuned.
$DISH ready to rip! Beautiful bottoms bounce with a 1:3 risk:reward
✅MACD cross/approaching 0
✅daily RSI broke 50
✅volume uptick
I like Jan 2024 swing as well as common shares here
Adding on break and hold of $7.00
