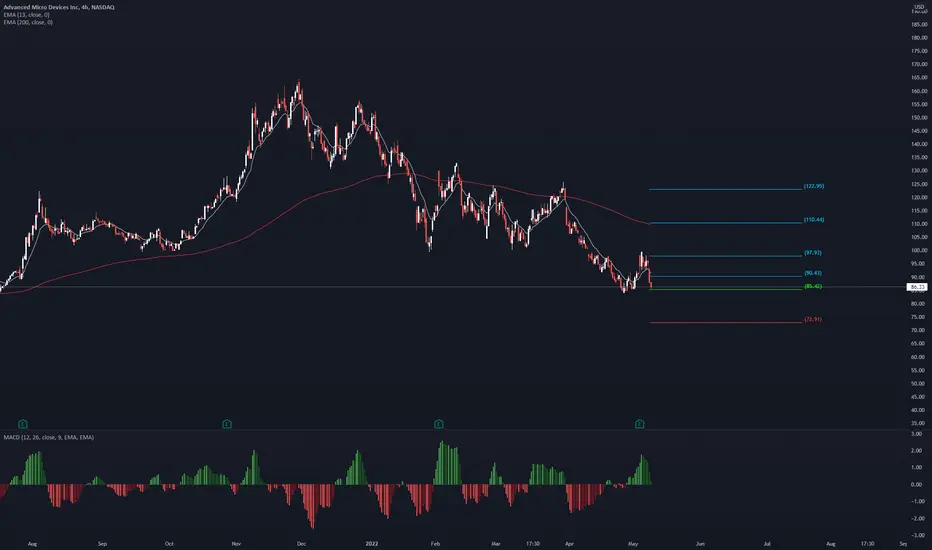
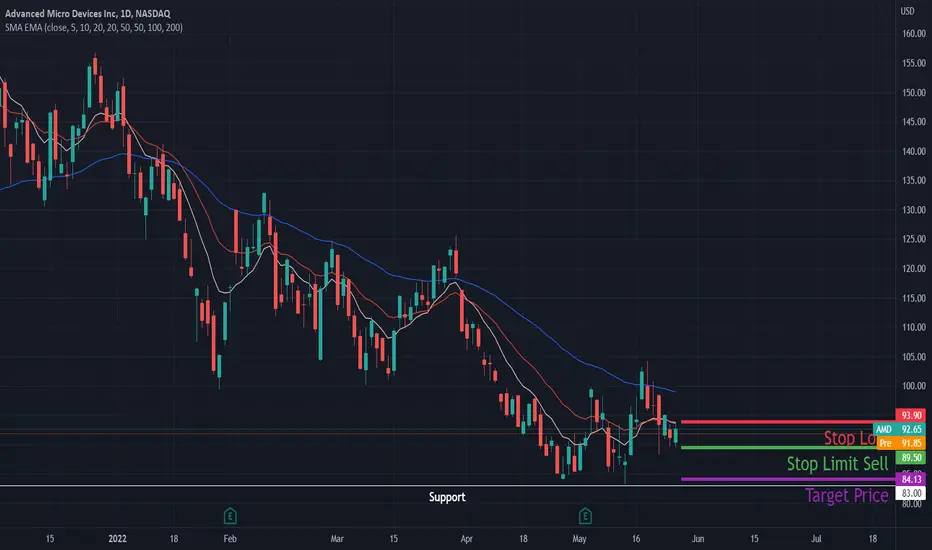
AMD daytrade ideaDespite market weakness, AMD has been holding and battling the psychological $100 level.
Also, I can see that a possible symmetrical triangle (a little wonky) black lines.
My plan into tomorrow is watching the direction of this move.
Upside scenario: Above $93.83 would long it targeting $96 and above that $100
Downside scenario: I would wait to see if price will break the bottom of the triangle, if it does i will enter short below the break and target $90 and $88.70
There is no need to have a bias in this market, just play what the day brings.
Good luck.
AMD
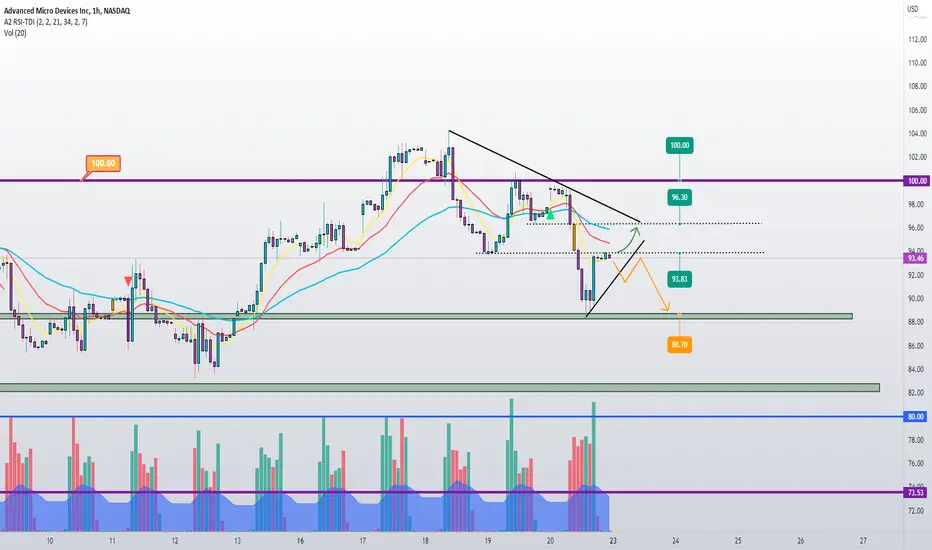
AMD: Compression PatternCompressions patterns are an important one to watch for in sideways action like a bottom formation. These form as buyers gain dominance over sellers. I'd like a tighter consolidation to develop at the current resistance for lower risk for entry on the breakout.

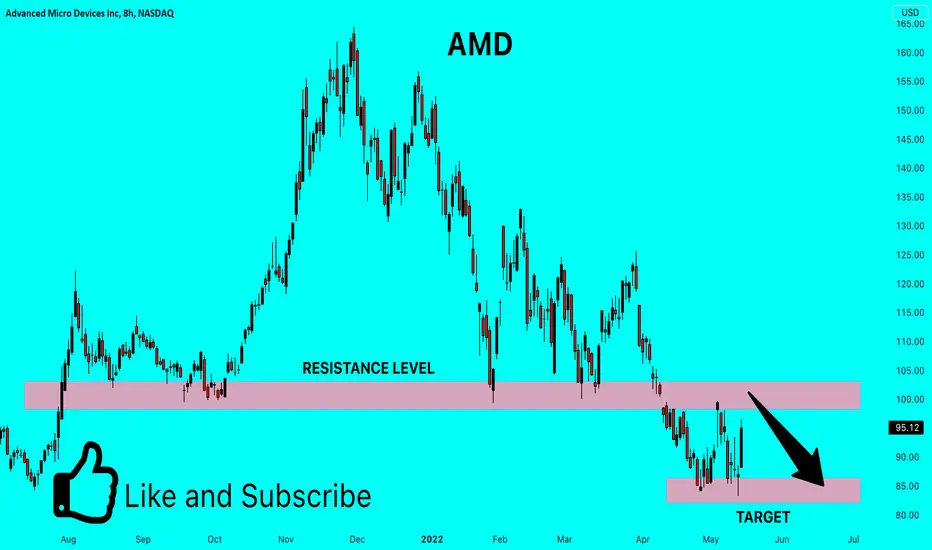
Where will AMD stock meet resistance and drop?Short-term support levels $75-85
Gray zone range $34-64
Resistance levels $142-164
Like and Share
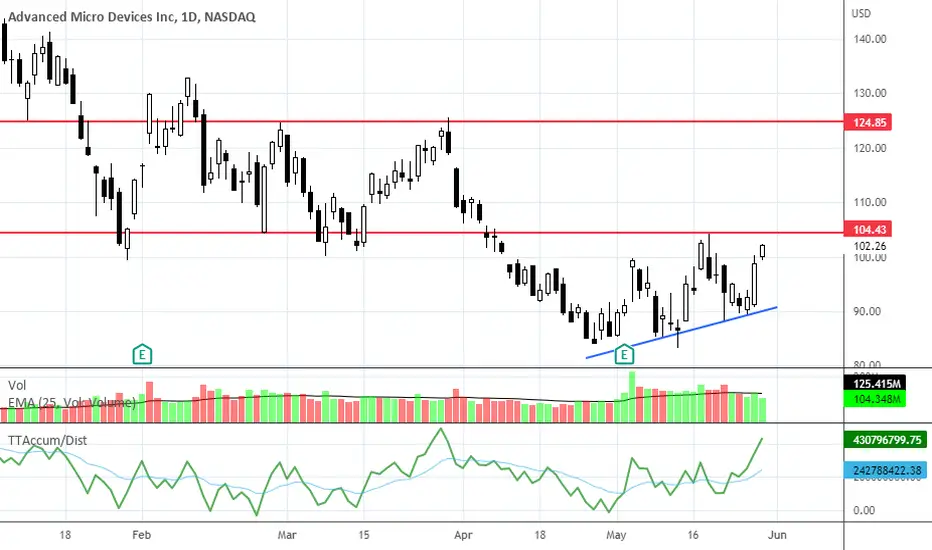
AMD Break Out (Short Term)As we see AMD breaking out a major resistance within the rising wedge, we could expect it to keep rising and hitting resistance around the circled area on the resistance trend line of the rising wedge. On the RSI, it also shows AMD has been continuing on a uptrend channel thus showing it has already hit support and its ready to move upwards.

STEP 3) WAIT to see Price RETEST of HTF''s POI on Counter-Trend It is an established fact that price usually makes a RETEST to the protected Demand or Supply zone regarded as Institutional Order Flow (IOF).
So it is critical for every price action trader to WAIT for a Return to Order (RTO) . But this doesn't mean that price must hit the POI at all times.
They are others factors that may like to cause price reaction off the Demand or Supply zone. These factors include: Imbalance, Hidden Base,
Inducements, e.t.c.

AMD Forward P/E discountIf you haven`t bought AMD here:
or here:
then you should know that AMD is trading at a 61% forward P/E ratio discount versus the 5 year average!
The Goldman Sachs Group has an $133 price target for it!
Looking forward to read your opinion about it.

BULLISH signal for Risk Assets! BTC/USD Rally AheadBackground
So far this year we’ve seen a tremendous amount of volatility across literally all financial markets as a result of the tightening of monetary policy conditions by the largest and most influential central bank in the world – the Federal Reserve . The equity markets together with other risk assets like crypto have been in the cross-hairs ever since the Fed changed its overall stance and monetary policy plan back in early November, 2021. In the post FOMC meeting press conference on Nov. 3, 2021, the Federal Reserve Chair Jerome Powell indicated for the first time that the FOMC "will start to reduce the pace of asset purchases," in a process called tapering. Up until that point the Fed had been purchasing $80 billion in U.S. Treasury securities and $40 billion in U.S. agency securities each month. Powell stated that, starting in December 2021, these monthly asset purchases initially will be reduced by $10 billion for Treasury securities and $5 billion for agency securities. He then further emphasized that the central bank’s goal was to fully complete the tapering process by March, 2022, so that they could start raising interest rates after that.
Not surprisingly at all as a result of the hawkish stance of the Federal Reserve and the future of tighter monetary policy conditions ahead, investors started to abandon the previously loved high-growth tech stocks that were trading at extremely stretched valuations at that time. The so-called “multiple compression” process began at the end of last year and has continued to be the center theme in the market to this day. The concept is rather straightforward and we’ve written about it before – when monetary policy conditions tighten, credit becomes less available and more expensive, which makes it more difficult for these high-growth companies to continue to invest and grow at the same rate. This slows down their revenue and EPS growth numbers, and investors become less willing to pay that same premium as before for these stocks. As a result, a major repricing of this more speculative part of the market then begins and investors start looking and shifting their capital into more defensive, stable and dividend paying companies.
However, as we all know people tend to overcommit to various trends and narratives out there, which very often leads to the overextension of both bull and bear markets. Currently, investors are pricing 11 more interest rate hikes by the Federal reserve , which in our opinion is simply not realistic. We believe that as Economic data starts to deteriorate in the US with the ISM Manufacturing Index showing early signs of that already, the FED will make a dovish pivot signaling that the economy no longer needs 11 more rate hikes as it is not as strong as they had initially anticipated. This will inevitably lead to a major stock market rally which will be predominantly led by Technology stocks. The crypto market as a whole will also find its footing and make a move back up to its prior highs.
Why is that important you might ask?
Well, as much as crypto lovers, proponents and supporters have been trying to portrait Crypto and Bitcoin in particular as a completely separate, non-correlated, inflation-hedge asset class, this is simply not true. It is for sure an incredibly fast growing asset class, which undoubtedly will continue to play a major role in the way we communicate, transact and store value in the future. However, the reality is that the crypto market is still treated by institutional investors and money managers, which are indeed the people who move the markets, as a rather speculative risk-asset. This could be clearly identified by the strong intermarket positive correlation that we’ve seen between the crypto market and Bitcoin in particular and the Nasdaq 100 ( QQQ ) technology index. Bitcoin has pretty much mirrored the price action of the US tech sector ever since the Fed made that policy change back in November, 2021.
How can we use that to our advantage?
By identifying the presence of a strong positive correlation between Bitcoin and the QQQ index, we should treat that correlation as valid until proven otherwise. Monitoring the two markets simultaneously could allow us to spot potential trading opportunities forming on either one of the two charts and then wait for a confirmation of the trading set-up by the other chart. Taking our intermarket analysis one step further, we could analyze the volatility profile of not only the Nasdaq 100, but also of the S&P 500 and see where the markets could be headed next. As a general rule, when the volatility in equity markets rises, uncertainty rises and investors tend to become more fearful, which usually leads to major equity market declines, which can then translate into weakness in the price of Bitcoin as well.
The Volatility Index ( VIX ) is linked to the S&P 500 and is regularly referred to as the Fear and Greed index of the US equity markets. When the VIX stays at rather elevated levels for extended periods of time this represents the presence of a lot of Fear and Uncertainty among market participants. The technology sector accounts for nearly 30% of the S&P 500 and the Tech stocks are indeed the most volatile stocks out there, thus even though that the most popular volatility measure VIX is not directly linked to the technology index (NASDAQ, Nasdaq 100), it still represents a very accurate measure of the volatility profile of not only the broad market, but also of the QQQ as well. There is a specific volatility index that is linked directly to the NASDAQ 100, VOLQ , but it is less popular and not as relied on as the VIX benchmark.
Our findings
Our most recent research shows that since the beginning of 2022, there have been 3 occasions where the short-term low for the Bitcoin price coincided almost perfectly with the rejection of the VIX from its major multi-year downward sloping resistance line going all the way back to the March 23rd, COVID-19 sell-off. On all 3 occasions, this major rejection of the VIX from this key resistance line, happened right when the price of Bitcoin was laying around a critical support level . The combination of these intermarket signals produced a 30% rally in the price of Bitcoin in the following 2-4 week period in all three instances.
Here are the numbers:
Example 1 - January – February
Top for the VIX – Date: January 24th, 2022
Price of BTC /USD as of January 24th, 2022 = $35,000
Price of BTC /USD as of February 10th, 2022 = $45,000!
Example 2 – February – March 2022
Top for the VIX – Date: February 24th, 2022
Price of BTC /USD as of February 24th, 2022 = $37,000
Price of BTC /USD as of March 2nd, 2022 = $45,000!
Example 3 – March – April
Top for the VIX – Date: March 8th
Price of BTC /USD as of March 8th, 2022 = $37,500
Price of BTC /USD as of March 30th, 2022 = $47,500
The current picture
We saw two major daily rejections on of the VIX from the very same downward sloping trendline resistance that took place on May 2nd and May 10th respectively. This has coincided once again with the price of Bitcoin sitting at a critical support zone around the $30,000 level. In addition to that we’ve seen positive price action for BTC with higher highs and higher lows on the lower time frames, which is also an indication for the presence of bullish interest at these levels.
We believe that as we see the VIX retreating from these current elevated levels that a strong 30% move up could materialize in the next 2-4 weeks. Our price target for this up move will be the $38,000 level.

AU Pa Breakdown, and Idea!Here i'm breaking down AU as well as give you an idea of where it might go next!


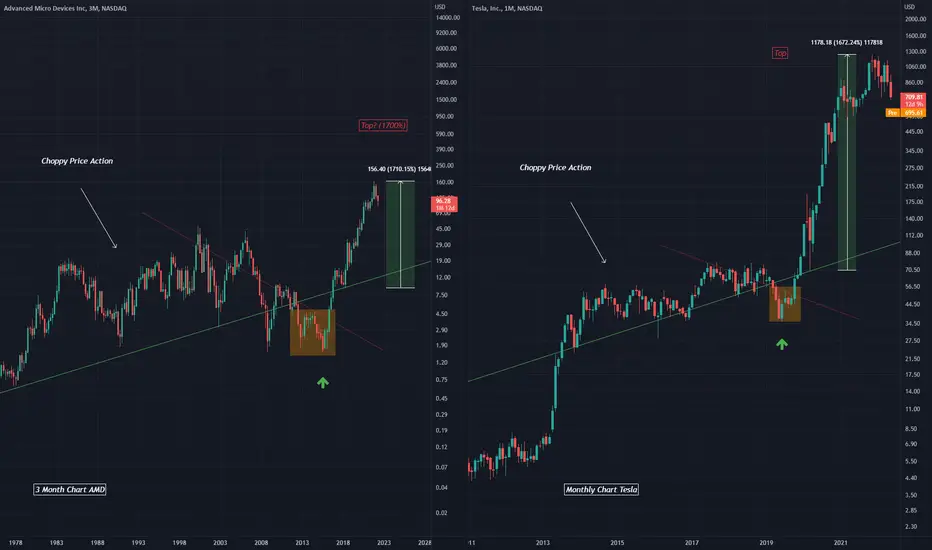
Comparing AMD and TeslaBoth charts can be observed to have an upward trend (green)
Before recent movement upwards price dipped in both cases below this green line (in orange)
Both share choppy price action for a very long time, which is followed by a large breakout
Biggest chart difference is the timeframes, AMD is 3M, while Tesla in Monthly
AMD - Short PositionCNBC Pro
AMD can surge nearly 50% after big pullback this year, Piper Sandler says in upgrade

AMD leading investors into a trap?$AMD continues to rally on the second day of this week in the middle of Fed meetings. AMD has been a hot stock to play in the semi-conductors sector after its stellar earrings a few weeks back. Volume increased also for this first quarter of this year compared to last year. seems like everyone wants to get piece of AMD before its start to rally again back to 160. i think AMD with their back-to back-to back performance and beating the ER expectations this stocks is ready to rally to its all-time high. But with the current market, where recession is just around the corner due to inflation. Along with geopolitical problems, supply chain issues and shortages of labor, are making the market unstable, along with tech stocks and other commodities.
Here's my #STRAT strategy for AMD.
if you swing AMD from today, your next target for profit exit is 109.74 ( labeled with blue line)
if AMD breaks below 94.80, this will be your entry for puts and exit for profits at 90.48.
Hello everyone,
Welcome to this free technical analysis . ( mostly momentum play )
I am going to explain where I think this stock might possibly go the next day or week play and where I would look for trading opportunities
for day trades or scalp play.
If you have any questions or suggestions on which stocks I should analyze, please leave a comment below.
If you enjoyed this analysis, I would appreciate it if you smash that LIKE button and maybe consider following my channel.
Thank you for stopping by and stay tuned for more.
My technical analysis is not to be regarded as investment advice. but for general informational purposes only.
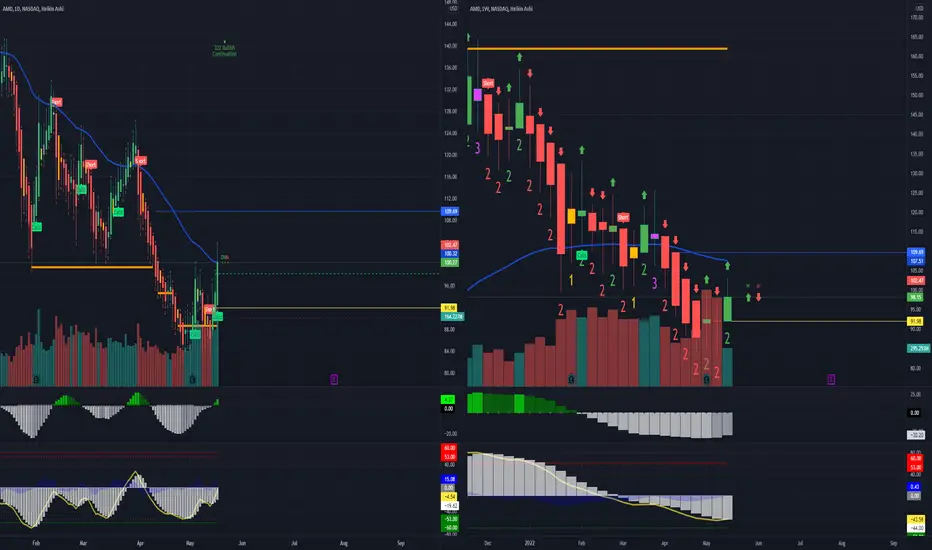
AMD- Another rejection of VMA
Candle yet to close, but price seems to reject 60 Day VMA (or 50 SMA if you prefer)
Volume profile has been really constructive, so I wouldn't be quick to short this.
if it can build above 94, still have a good chance for breakout. Short case would be weak action to test the trendline and hard rejection there would set this up for new low.

✅AMD MOVE DOWN AHEAD|SHORT🔥
✅AMD will be retesting a resistance level soon
From where I am expecting a bearish reaction
With the price going down but we need
To wait for a reversal pattern to form
Before entering the trade, so that we
Get a higher success probability of the trade
SHORT🔥
✅Like and subscribe to never miss a new idea!✅
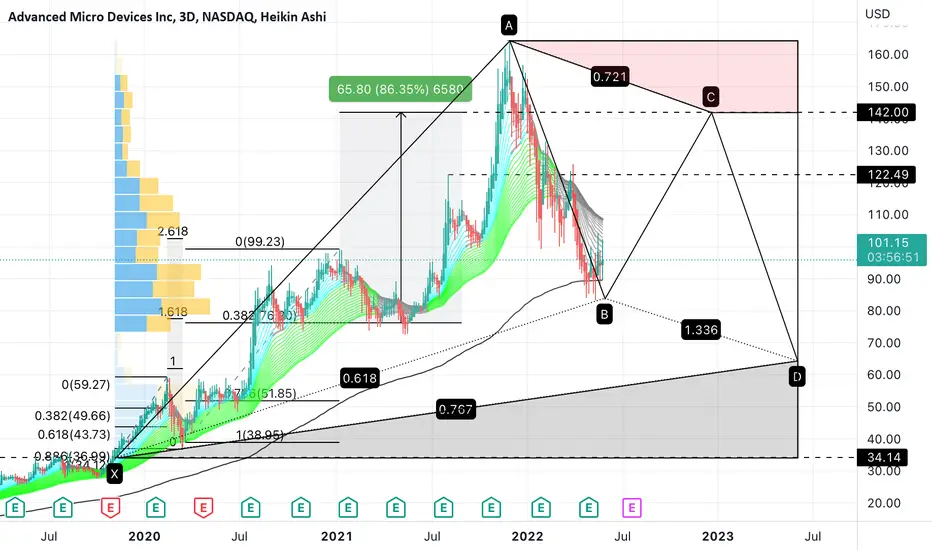
AMD $AMDJust the current situation of Apple .
Nobody can pick the bottom, so i post this as neutral, just as an overview of how the stocks looks at the moment.
Stay safe!

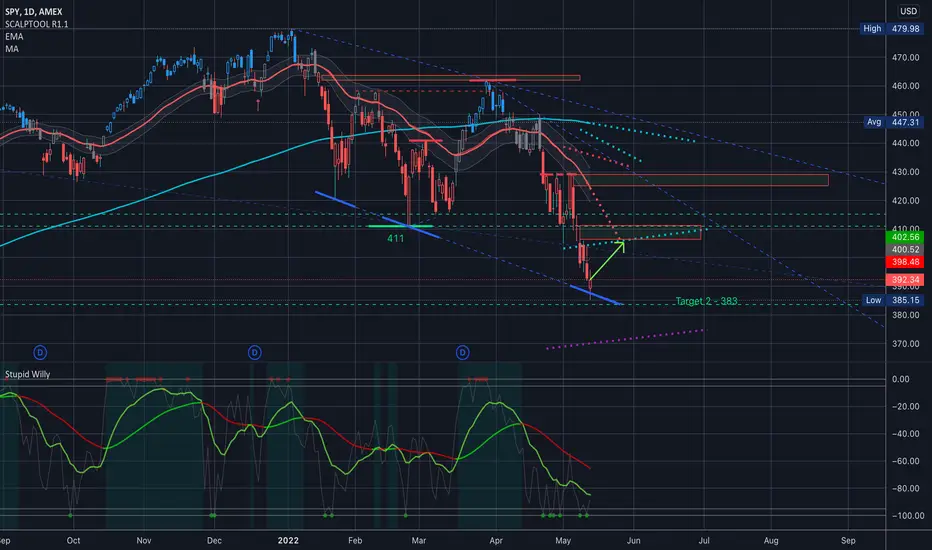
$SPY Analysis, Key Levels, & Targets… $SPY Analysis, Key Levels, & Targets…
I am definitely still bullish, y’all… The last three days I’ve played daily calls and won and that is not indicator of anything because you can play both sides most of the time… but I am bullish…
We’re at the bottom of the channel… Yes, lots of funds blew up last week, but then there’s a lot of people that have been mostly in cash since jan (ME) that are itching to play again (outside of just the daily day trade scalping)…
There’s a lot of deals out there right now and I think that we will see a little bit of green in the next week or so. I’m sure the bottom’s not in but money is shifting around and some names you won’t be able to see this low again….
What stocks are you guys thinking about possibly nibbling on??
I bought NIO and RIVN, TQQQ, and AMD this week… definitely looking for others that have taken a beating lately….
Good luck y’all and as always let me know what you think, and sorry if I’m slow to respond sometimes…
AMD correction 2022Keeping the analysis that the correction of the companies had to come back to the original value (channel 2018-2019)
Here is AMD CORRECTION

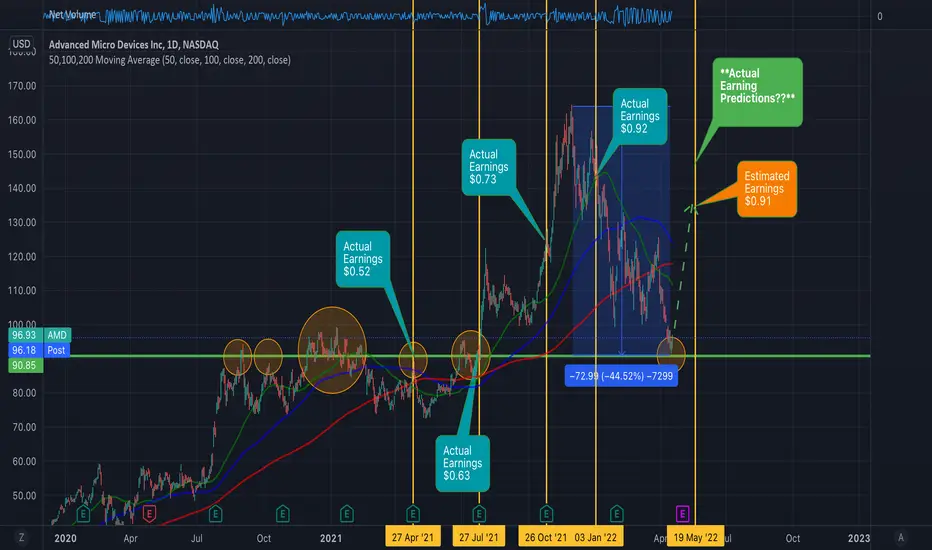
AMD Bullish outperform on the Horizon? Higher Actual Earnings?!?AMD has a History of outperforming Earnings Estimates. I believe this provides Stark Fundamentals, in order to support the TA Case for a reversal to the upside:
> Q1 2021 18% higher than expected
> Q2 2021 16% higher than expected
> Q3 2021 9% higher than expected
> Q4 2021 21% higher than expected
With the above earnings in mind. The last 4 Quarterly reports provided an average of 16% out performance for Actual over Estimated earnings.
I have become very Bullish on the Fundamentals of AMD. A company in which, I and other already consider to have stronger Financials that Nvidia. (Also bullish on NVIDIA - just more for AMD)
Even with the "Ukrainian Heroic Freedom War" effect on the companies earnings, I would expect a slight out performance to repeat.
>>I have all the earnings dates laid out with the Vertical lines<<
Technical Analysis
I believe that the Green Horizontal line, which has been substantial resistance, support, resistance and now Support. Will be the foundation for a reversal to the upside. The Tech Sector, more particularly AMD, is at one if not the most Oversold level(s) in the companies History. One must only look at the distance from the Moving Averages to see this. My Quantitative models have highlighted this as one the three most attractive equities at present on My Radar.
>>Alongside Riot Blockchain and Netflix<<
In my opinion, AMD is the most attractive from a combined Fundamentals and Technical Analysis Evaluation.
Having DCA over yesterday and today into AMD. I believe a significant short to mid term rally to the $130 range is possible.
> Supported by a bounce from the general market being oversold.
> Tax season selling finished.
> Rate hike news already over priced in the market. (Strong belief that most (not all) of the rate hikes are being used as a stick waved to slow the market and economy. Rather than a tool that will be used to brutally beat the economy into recession)
> AMD being significantly more oversold than the greater market.
> Long term pricing models, factoring earnings and industry growth would suggest a significantly higher price in the coming weeks/months.
>>Finally, don't lever up and keep some dry powder always<<
>>Keep the Long term in mind Chaps<<
This is my own opinions, analysis and a trade I am currently undertaking in my portfolios. This is not Financial advice purely my own Analysis and Research.
Will be sharing the TA modelled charts over the coming Days for those interested.
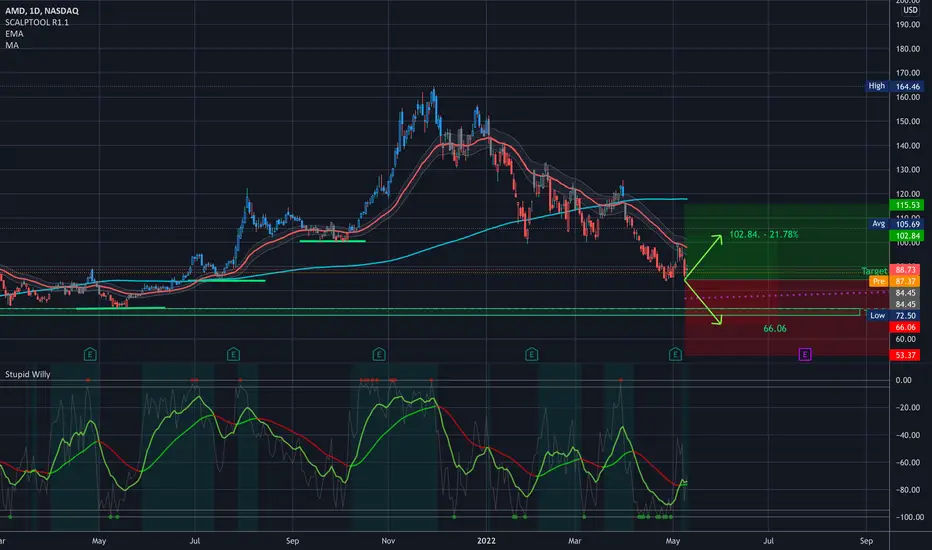
$AMD Update$AMD Update
So my buy order filled at 84.45… So I’m looking for 102.84 for 21.78% OR 66.06 to double my position….
There is a gap that was opened in July of 2020… that I also might add in….
Best of luck and have fun, y’all…
—-
I am not your financial advisor. Watch my setups first before you jump in… My trade set ups work very well and they are for my personal reference and if you decide to trade them you do so at your own risk. I will gladly answer questions to the best of my knowledge but ultimately the risk is on you. I will update targets as needed.
GL and happy trading.
IF you need anything analyzed Technically just comment with the Ticker and I’ll do it as soon as possible…
ADVANCE MICRO DEVICE .. IF YOU WANT TO SHORT please short only with small qty for practice with giving sl yellow line above..... let the red support break then go you can carry for tomorrow 1.2 target

AMD - Long PositionAdvanced Micro Devices has strengthened its position in the semiconductor market on the back of its evolution as an enterprise-focus company from a pure-bred consumer-PC chip provider. AMD has emerged as a strong challenger to NVIDIA’s dominance in the graphic processing unit or GPU market based on its Radeon technology.