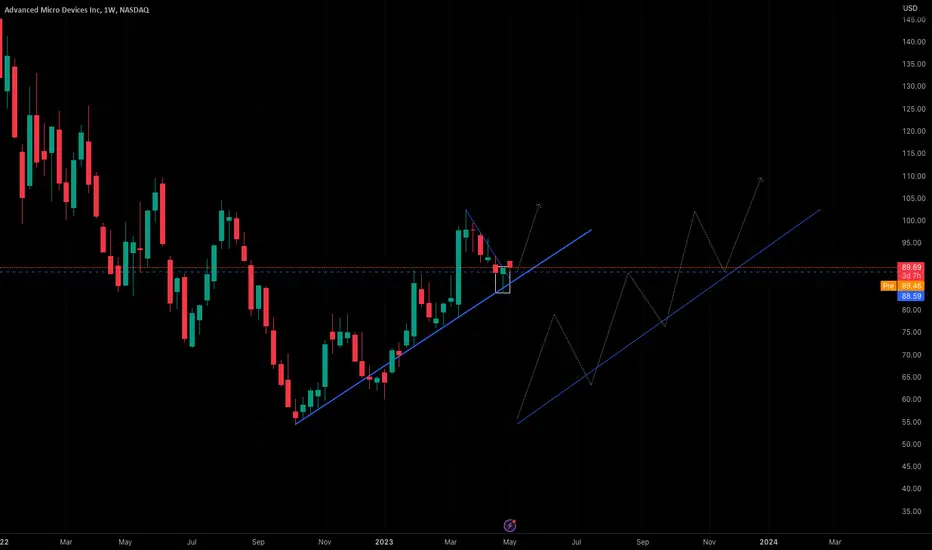
AMD reports for LONG?AMD reports 30-April: Popular stock + Above the average line 150 + Chip field is "HOT" + Fibonacci retracement. Is it possible to climb 42% to all time high? Only an idea and not a recommendation for trading!
Amdbuy

AMD GO HIGHERHello fellow stocks traders, currently working and watching this stock before it fall, my assumptions to the highest level is 220-243$ before it retrace.
Were on the 2nd moves for distribution type.
Betting the highs is not optional on shorting. best case is that we dont know whats happen next.
This is only my assumptions before it dump.
This is not a financial advice.
Follow for more Stocks to trade.
Trading is risky, dont trade it own it.

AMD: When will it End?For AMD, we've continued to see this rise since our last analysis, partly due to very positive news in the market about chips, indicating that chips look very promising in the near future, as expected. AMD rose by 9% yesterday, and pre-market, it's already opening up by 3% higher. We believe that the 161% mark will be reached quite quickly. This Wave (3) could potentially be much larger than the 227.2% mark, yet we think that this range will be a good point for the next correction to occur. However, we should quickly reach this level of $216.
It's important to remember that, on a larger scale, we are also in Wave III, which should be positioned significantly higher compared to the subordinate Wave (3), which lies between $216 and can reach up to $368 maximum. That would be quite impressive, but realistically, it's likely to be between $216 and $266.

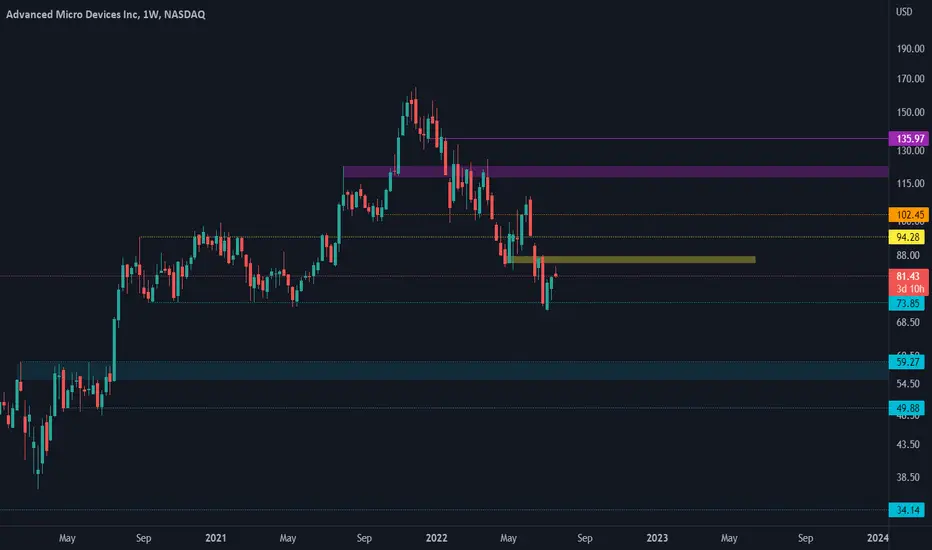
AMD - Starting to Accumulate.AMD - Currently down 50% from ATH starting a position for long-term.
Looking to add at levels of support indicated in cyan. Big bids at 59-50 and 34-29.
Short-term trend change if yellow zone gained. Targeting orange around 100 for profit taking.
Looking for new ATH on gain of purple.
PYR: Breakout Target 50$ by 2024🚀 Exciting developments are underway as Vulcan Forged PYR (PYR) makes a notable exit from a significant accumulation phase. The charts suggest a potential retest of the upper boundary of this range, setting the stage for a breakout with a target of $50 by the end of 2024. Let's dive into the details of this emerging opportunity. 📈🔍
PYR's Accumulation Breakout:
Accumulation Dynamics: PYR has shown signs of accumulating within a range, indicating a period of gathering momentum before a potential price move.
Exit from Accumulation: The recent breakout from this accumulation phase is a noteworthy development, suggesting that PYR is gearing up for a new trend.
The Retest and Breakout Scenario:
Retesting Upper Boundary: It's common for assets to retest the upper boundary of a range after a breakout. PYR might revisit this level, providing an opportunity for traders to confirm the strength of the breakout.
Targeting $50: The bullish sentiment surrounding PYR leads us to set a target of $50 by the close of 2024. This ambitious goal aligns with the potential of the current breakout.
Trading Strategy:
Retest Confirmation: Wait for confirmation through price action, ensuring that the retest of the upper boundary is met with bullish momentum.
Volume Analysis: Monitor trading volume during the retest and subsequent breakout. Increased volume can validate the strength of the upward move.
Long-Term Outlook: Considering the target of $50 by the end of 2024, investors may evaluate PYR as a potential long-term opportunity.
Conclusion:
PYR's emergence from accumulation signals a significant shift in market dynamics. As the cryptocurrency landscape evolves, strategic traders and investors can position themselves to capitalize on the potential breakout, with the ambitious target of $50 on the horizon.
May your trades align with the momentum of PYR's breakout, and the crypto journey be filled with success.
❗️Get my 3 crypto trading indicators for FREE!
Link below🔑


AMD BULLISH OCT 13,2023AMD is doing something extra ordinary & I am confident that it should go to to $140 soon.
Watch the analysis carefully &trade as per your risk tolerance.

$AMD Quarter 3 (Q3) AnalysisAMD is playing out as planned since the initial Q2 prediction with a dip into the buy zone. I’ve been saying that AMD is an excellent buy opportunity under $100, and the bearish August and September price action has helped to send AMD down to this price level. I have $158.53 as a key price target for Q4, and I believe that AMD will form a new all-time high afterwards. Long-term I think AMD will be a $400-500 stock. The yellow trendline has been acting as a support level and AMD just formed a bullish bounce off this support. The red trendline will act as short-term resistance on the way up.

$AMD LONGNASDAQ:AMD
Possible Head and Shoulders Pattern if Price Action goes through the Cloud.
IMO -> Good Risk/Reward

AMD BUYHi, According to my analysis of AMD stock, there is a good opportunity to buy. Or a long-term investment. All reasons for purchasing are explained as shown in the analysis. Good luck everyone

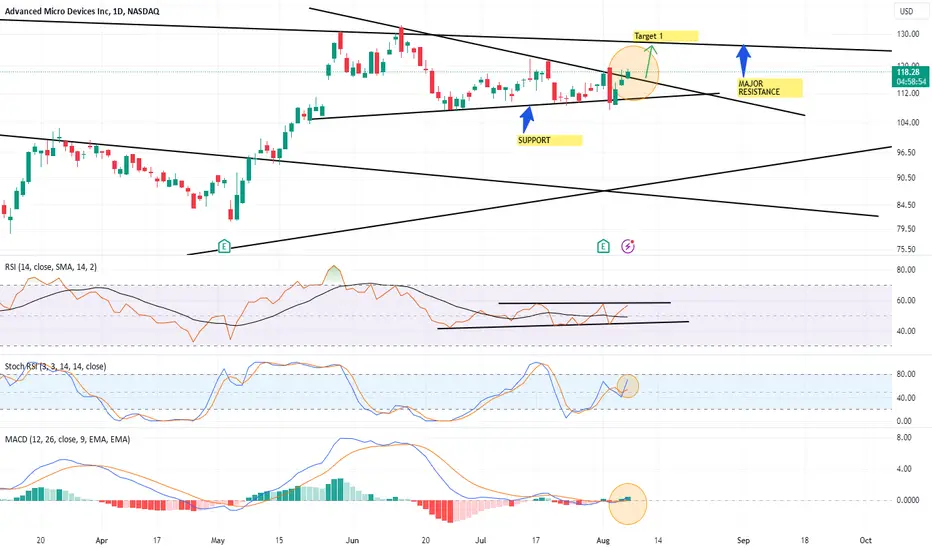
Advanced Micro Device Symmetrical Triangle Break/ Swing Hi guys this is a Technical Analysis on a Swing Trade opportunity for Micro Advanced Devices (AMD) on the 1 Day Timeframe.
Crruently, we are in the process of breaking out of the Upper trend line of the Symmetrical Triangle. Notice how we are coinciding with the previous candles WICK.
Now before taking any trades, make sure that the breakout is CONFIRMED. Which i will update on the confirmation.
If would be positive for this breakout if we test SUPPORT on this Upper trendline of the Triangle.
KEEP WATCH of FAKEOUTS, where we enter back into the triangle***
Our 1st Target = $125 - $132 range
Our next target and what i'd love to see is if we get ABOVE this range and act as SUPPORT on the "MAJOR RESISTANCE" line.
This MAJOR RESISTANCE line coincides with our TOP on Novemeber 2021.
Lets look at some more CLUE that will help strengthen this breakout in the INDICATORS:
RSI -> Notice how the RSI is coiling up in this range between the BLACK lines.
-> If we break above the UPPER line, this would indicate a trend change and will be a catalyst we need.
STOCH RSI -> Is showing a BULLISH CROSS. This would inject momentum into the breakout and help it move towards Target 1.
MACD => Is also showing that we have BULLISH momentum coming in, with the print of the GREEN histogram and BUllish cross inching towards the 0 level.
-> If we get above this 0 level with the cross, it will further the Bullish Momentum case.
TRADE IDEA:
STOP LOSS 5% below the Upper Trend Line of the Symmetrical Triangle
Scale in your buy orders
CONCLUSION:
We are in the process of breaking a Symmetrical Triangle which will require confirmation for validity. The first target is highlighted on the chart, with the best course of action being us breaking ABOVE the MAJOR RESISTANCE line and having it act as SUPPORT. Our indicators are either showing signs of a bullish case or is in the process of exhibiting such signs.
Thank you for taking the time to read my analysis. Hope it helped keep you informed. Please do support my ideas by boosting, following me and commenting. Thanks again.
If you have any questions, do reach out. Thank you again.
DISCLAIMER: This is not financial advice, i am not a financial advisor. The thoughts expressed in the posts are my opinion and for educational purposes. When trading always spend majority of your time on risk management strategy.
AMD breakout expected|31st July 2023Price has come down without touching any supplies. Price has also narrowed so much and price is initially from HTF DZ.

AMD -> New Major Bullish CycleHello Traders and Investors ,
my name is Philip and today I will provide a free and educational multi-timeframe technical analysis of AMD 💪
As you can see on the monthly timeframe AMD stock perfectly retested the 0.618 fibonacci retracement level of the previous bullish cycle and already started a quite nice rejection.
On the weekly timeframe you can see that AMD retested the 50% fibonacci level and also filled the gap which was created a couple of weeks ago so everything is pointing towards more bullish growth.
Finally I am waiting for an entry signal on the daily timeframe - specifically AMD breaking above the current resistance at the $115 area and then I also do expect another daily push higher.
Keep in mind: Don't get caught up in short term moves and always look at the long term picture; building wealth is a marathon and not a quick sprint 📈
Thank you for watching and I will see you tomorrow!
My previous analysis of this asset:

AMD -> Targeting The All-Time-HighHello Traders and Investors ,
my name is Philip and today I will provide a free and educational multi-timeframe technical analysis of AMD 💪
Just a couple of months ago AdvancedMicroDevices Stock perfectly broke above a major monthly downtrend line and since then created a bullish rally of roughly 70%.
On the weekly timeframe you can see that AMD just retested previous weekly structure at the $108 level and in confluence with a 50% fibonacci retracement level I do expect the continuation towards the upside from here.
The daily timeframe however is currently not bullish on AMD and the stock is retesting resistance at the moment so I am waiting for a bullish break back above the structure before then the daily timeframe is perfectly aligning with the overall long term bullish picture.
Keep in mind: Don't get caught up in short term moves and always look at the long term picture; building wealth is a marathon and not a quick sprint 📈
Thank you for watching and I will see you tomorrow!
My previous analysis of this asset:

20 Reasons for long AMD
🔆MULTI-TIME FRAME TOP-DOWN ANALYSIS OVERVIEW☀️
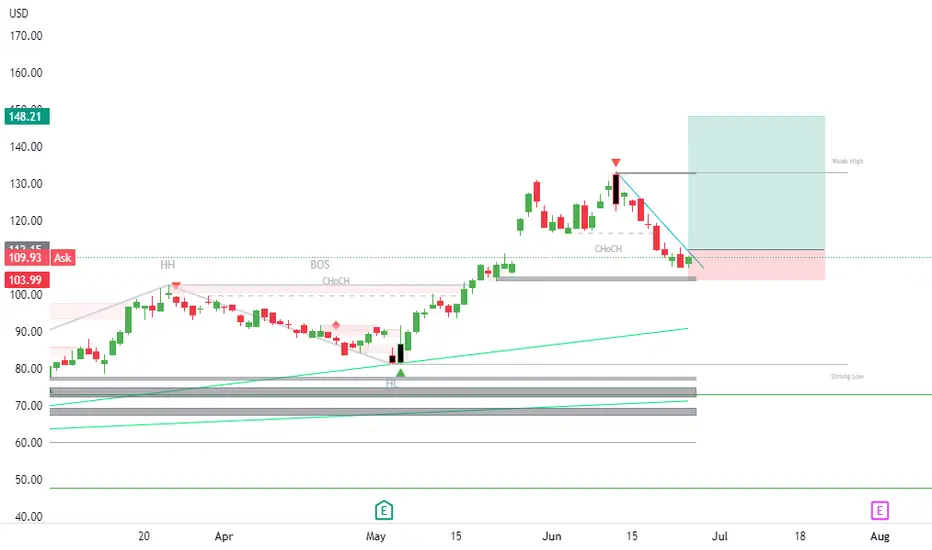
1:✨Eagle eye: In 2016, the stock started its bullish run and created its first multi-year Bullish Order Structure (BOS) and also set an All-Time High (ATH). After a correction move last year, an important point to note is that the Point of Interest (POI) area held, indicating that bulls still have power and the stock is showing strength. It is now poised for the next impulsive move towards a new ATH.
2:📆Monthly: In October 2022, the correction move confirmed a Lower High (LH), signaling the end of the correction. Now, the price may either consolidate sideways or take a reversal impulse move. We need to consider both possibilities. If the price consolidates, the range between 98 and 110 is important, and we should only look for buying opportunities within this range.
3:📅Weekly: A very strong bullish structure has already formed, and the price has made a BOS and almost completed its corrective move. The corrective area ranges from 100 to 104. Here, we need to wait for a strong reversal signal to confirm the buying opportunity. No further signals are needed, only one confirmed reversal signal.
4:🕛Daily: A well-established bullish trend is evident, with a strong inducement and a corrective move that has filled the gap and window. The price is now approaching the most recent support area after the inducement. The most important thing to watch carefully is the confirmation of today's pro-gap. If the price closes above 112 for the next two or three days, or even today, it will provide a buying confirmation.
😇7 Dimension analysis
🟢 analysis time frame: Daily
5: 1 Price Structure: Extremely bullish
6: 2 Pattern Candle Chart: Pro-gap
7: 3 Volume: High selling volumes indicate the end of the correction, and now a confirmation of the long position is needed.
8: 4 Momentum UNCONVENTIONAL RSI: Holding above the 40 area, indicating a middle strength bullish zone.
9: 5 Volatility measure Bollinger bands: Volatility is starting to squeeze, which may lead to a temporary calm or sideways movement before a bullish move. The breakout of the squeeze will provide final confirmation.
10: 6 Strength ADX: Completely sideways.
11: 7 Sentiment ROC:
✔️ Entry Time Frame: Daily
12: Entry TF Structure: Bullish
13: Entry Move: Initial impulsive move
14: Support Resistance Base: The most recent Order Structure (OS) after the inducement acts as strong support.
15: FIB: Not activated yet. Additionally, a breakout of the hourly trend line will provide an additional confirmation.
☑️ Final comments: Buy at confirmation.
16: 💡Decision: Go long.
17: 🚀Entry: 112
18: ✋Stop Loss: 104
19: 🎯Take Profit: 148
20: 😊Risk to Reward Ratio: 1:6.5
🕛 Expected Duration: 30 days
AMD - Bullish PitchforkLooks like NASDAQ:AMD may have found its bottom on this young pitchfork that I see forming actionable setups. After filling the gap it looks healthy and ready for higher prices. Expecting 140s before earnings.

AMD -> Almost Ready For Another PumpHello Traders,
welcome to this free and educational multi-timeframe technical analysis.
On the weekly timeframe you can see that AMD just recently perfectly retested and already started to reject a major previous weekly structure zone at the $130 level.
You can also see that the next weekly support zone is at the $100-$105 area - I definitely do expect AMD to retest this support before I then do expect some bullish rejection and an overall continuation of the underlying uptrend.
On the daily timeframe you can see that AMD just created a beautiful double top formation which is a classic bearish reversal pattern so there is the possibility that we will first see more downside to retest the $105 support before we will then see a bullish rejection.
Thank you for watching and I will see you tomorrow!
You can also check out my previous analysis of this asset:

AMD -> Uptrend Will ContinueHello Traders,
welcome to this free and educational multi-timeframe technical analysis .
On the weekly timeframe you can see that AMD is actually approaching a quite nice previous weekly support/resistance area which is now turned resistance again.
You can also see that weekly market structure is beautifully bullish, AMD is always creating new higher highs and higher lows, so I am now just waiting for a short term rejection away from the resistance before I then do expect more upside potential.
On the daily timeframe you can see that AMD is showing some rejection at the $110 level which was also previous daily resistance, so I am now just waiting for a retest of the $98 level before I then do expect a new fresh rally towards the upside from there.
Thank you for watching and I will see you tomorrow!
You can also check out my previous analysis of this asset:

AMD STRONG UPTRENDAMD is currently creating a possible weekly higher low which is an indication of the start of a uptrend on lower time frames. AMD also has earnings after market today which could initiate the move or invalidate it. With the weekly having a closed bullish Pinbar @ the trendline there is strong confirmation signaling a bullish move up for the next week or two.
AMD -> It Is Over For Bears!Hello Traders,
welcome to this free and educational multi-timeframe technical analysis .
On the weekly timeframe you can see that AMD stocks currently looks extremely bullish in my opinion.
We just broke above a key down-trendline, we also created and already confirmed a weekly double bottom and the next resistance area at the $105 area is quite far away so from a weekly perspective I just do expect more continuation towards the upside.
On the daily timeframe you can also see that with today's candle we are breaking above a previous daily resistance area, so I am now just waiting for the retest and some bullish confirmation and then also the daily timeframe looks ready for the next rally towards the upside.
Thank you for watching and I will see you tomorrow!
You can also check out my previous analysis of this asset:

AMD to again find support at previous resistance?Advanced Micro Devices - 30d expiry - We look to Buy at 79.11 (stop at 74.48)
Daily signals are mildly bullish.
Previous resistance at 79.00 now becomes support.
50 4 hour EMA is at 77.80.
The sequence for trading is higher highs and lows.
Preferred trade is to buy on dips.
This is currently an actively traded stock.
Our profit targets will be 90.31 and 92.31
Resistance: 86.00 / 88.94 / 91.50
Support: 82.00 / 79.00 / 76.50
Please be advised that the information presented on TradingView is provided to Vantage (‘Vantage Global Limited’, ‘we’) by a third-party provider (‘Signal Centre’). Please be reminded that you are solely responsible for the trading decisions on your account. There is a very high degree of risk involved in trading. Any information and/or content is intended entirely for research, educational and informational purposes only and does not constitute investment or consultation advice or investment strategy. The information is not tailored to the investment needs of any specific person and therefore does not involve a consideration of any of the investment objectives, financial situation or needs of any viewer that may receive it. Kindly also note that past performance is not a reliable indicator of future results. Actual results may differ materially from those anticipated in forward-looking or past performance statements. We assume no liability as to the accuracy or completeness of any of the information and/or content provided herein and the Company cannot be held responsible for any omission, mistake nor for any loss or damage including without limitation to any loss of profit which may arise from reliance on any information supplied by Signal Centre.

AMD -> Preparing The Rally?Hello Traders,
welcome to this free and educational multi-timeframe technical analysis .
On the weekly timeframe AMD stock is currently retesting the neckline of the very obvious weekly double bottom as predicted in my last video analysis which is linked below.
Since we are now retesting previous weekly resistance which is now turned support and we are also having a bullish ema crossover, I do expect at least a short term rally towards the upside from here.
On the daily timeframe, market structure is still overall bearish so I am now just waiting for a deeper retest of the zone and some bullish confirmation before AMD stock will then start the next pump towards the upside.
Thank you for watching and I will see you tomorrow!
You can also check out my previous analysis of this asset:
