$AMD Quarter 3 (Q3) AnalysisAMD is playing out as planned since the initial Q2 prediction with a dip into the buy zone. I’ve been saying that AMD is an excellent buy opportunity under $100, and the bearish August and September price action has helped to send AMD down to this price level. I have $158.53 as a key price target for Q4, and I believe that AMD will form a new all-time high afterwards. Long-term I think AMD will be a $400-500 stock. The yellow trendline has been acting as a support level and AMD just formed a bullish bounce off this support. The red trendline will act as short-term resistance on the way up.
Amdprediction

AMD BUYHi, According to my analysis of AMD stock, there is a good opportunity to buy. Or a long-term investment. All reasons for purchasing are explained as shown in the analysis. Good luck everyone

Advanced Micro Device Can we bounce from 21 Weekly EMA?Hi Guys! This is a Technical Analysis on Advanced Micro Device (AMD) on the 1 Week Timeframe.
Previously i posted a chart on the Daily Timeframe, mentioning of a potential breakout to the upside. But it was short lived as a fakeout, and we are down 7ish% since then.
To get an understanding of what went wrong, i decided to analyze the Weekly timeframe to get a bigger picture.
As you can see:
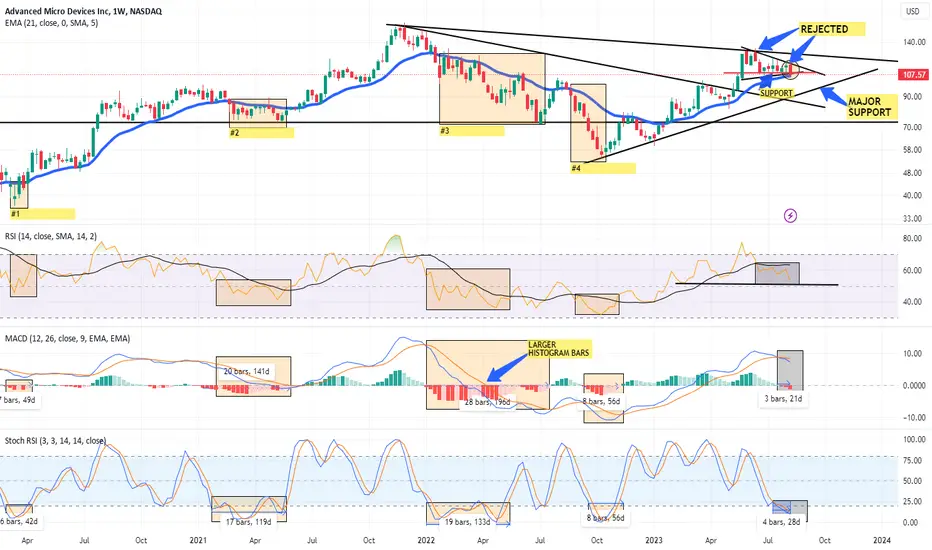
We have closed BELOW the SUPPORT line of the triangle.
We have also closed below this short term RED Horizontal support line.
And we are now Testing SUPPORT on the 21 Weekly EMA.
This is a Major development in my opinion.
21 EMA is used to determine trend:
->If its ABOVE = BULLISH
->If its BELOW = BEARISH
Whenever we are ABOVE the 21 EMA, its important for the BULLISH trend to have price action test SUPPORT on the EMA, every now and then.
For the BULLISH Trend to continue, we need CONFIRMATION that the 21 EMA indeed acted as SUPPORT.
But there is also the case, of the 21 EMA not being able to maintain SUPPORT.
So whats more likely in our current situation?
In my Opinion, its becoming more likely or probable that we BREAK BELOW 21 EMA.
For me and for more evidence i like to use INDICATORS.
Ive highlighted some Scenarios that mirror our current developments in the 3 indicators ive added.
Notice the Differences between how far we drop under the 21 EMA and the variations found in the indicators.
For Price action to weaken and drop below 21 EMA, 3 things need to happen:
1. RSI -> Showing the Orange line break support and move BELOW the Black line. The longer stay below and continue lower, more likely for price declines.
2. MACD -> BEAR CROSS, (Blue line below Orange line) and the appearance of Red Histogram.
3. STOCH RSI -> Below the 20 level. The longer we stay below this level, more likely for price decline
We are currently in this SCENARIO, highlighted by BLACK BOX.
So now to determine exactly how far BELOW we go, If we do break SUPPORT.
To gauge at that, we look LEFT and we look at the specific changes/ differences in the indicators.
For LARGER PRICE DECLINES like in Scenario #3 and #4
-> MACD Histogram Bars were LARGE
-> MACD Blue/Orange lines moved BELOW 0 level
-> STOCH RSI for #3 continued for about 133 days (longest compared to other scenarios).
-> RSI Orange line stayed below Black line for extended period
Now notice #1 and #2
-> The indicators didnt show extreme variations as seen in #3 and #4
-> Scenario #2 Price action was below 21 EMA for a decent amount of time but it was consolidating, rather than having a major decline.
-> Though the RSI Orange line was below the Black for extended time,
-> the STOCH RSI was at oversold area for 119 days,
-> the MACD Orange/Blue line NOT dose diving BELOW 0 level, helped price action maintain a range before moving back over 21 EMA.
We have to keep in mind though that history DOES NOT have to repeat and that a new scenario can be possible
BUT Main thing to watch is the size of the histograms of the MACD and whether or not we stay ABOVE the 0 level, in my opinion.
A level to look at is the SUPPORT line labeled "MAJOR SUPPORT".
IF we do close BELOW 21 EMA, it becomes more likely we test this line.
________________________________________________________________________________
Thank you for taking the time to read my analysis. Hope it helped keep you informed. Please do support my ideas by boosting, following me and commenting. Thanks again.
Stay tuned for more updates on AMD in the near future.
If you have any questions, do reach out. Thank you again.
DISCLAIMER: This is not financial advice, i am not a financial advisor. The thoughts expressed in the posts are my opinion and for educational purposes. Do not use my ideas for the basis of your trading strategy, make sure to work out your own strategy and when trading always spend majority of your time on risk management strategy.
AMD -> Targeting The All-Time-HighHello Traders and Investors ,
my name is Philip and today I will provide a free and educational multi-timeframe technical analysis of AMD 💪
Just a couple of months ago AdvancedMicroDevices Stock perfectly broke above a major monthly downtrend line and since then created a bullish rally of roughly 70%.
On the weekly timeframe you can see that AMD just retested previous weekly structure at the $108 level and in confluence with a 50% fibonacci retracement level I do expect the continuation towards the upside from here.
The daily timeframe however is currently not bullish on AMD and the stock is retesting resistance at the moment so I am waiting for a bullish break back above the structure before then the daily timeframe is perfectly aligning with the overall long term bullish picture.
Keep in mind: Don't get caught up in short term moves and always look at the long term picture; building wealth is a marathon and not a quick sprint 📈
Thank you for watching and I will see you tomorrow!
My previous analysis of this asset:

20 Reasons for long AMD
🔆MULTI-TIME FRAME TOP-DOWN ANALYSIS OVERVIEW☀️
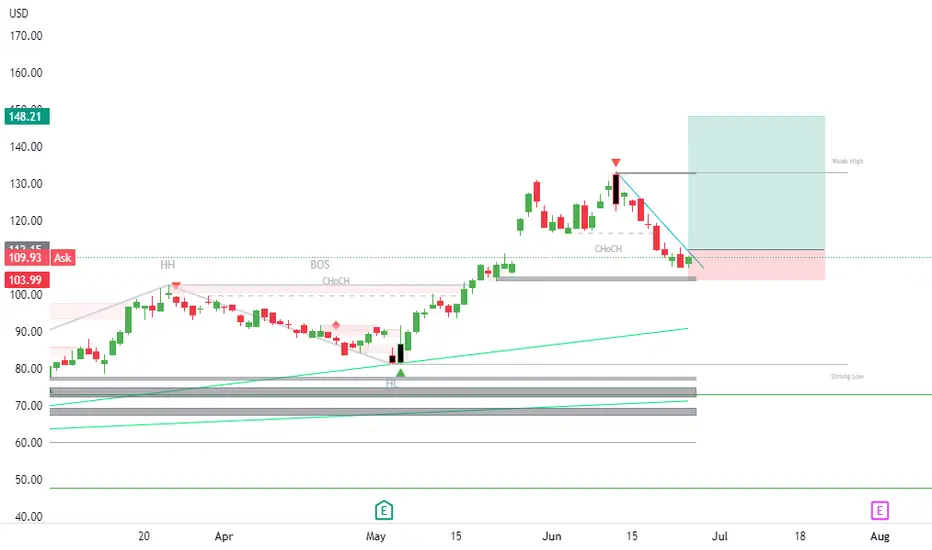
1:✨Eagle eye: In 2016, the stock started its bullish run and created its first multi-year Bullish Order Structure (BOS) and also set an All-Time High (ATH). After a correction move last year, an important point to note is that the Point of Interest (POI) area held, indicating that bulls still have power and the stock is showing strength. It is now poised for the next impulsive move towards a new ATH.
2:📆Monthly: In October 2022, the correction move confirmed a Lower High (LH), signaling the end of the correction. Now, the price may either consolidate sideways or take a reversal impulse move. We need to consider both possibilities. If the price consolidates, the range between 98 and 110 is important, and we should only look for buying opportunities within this range.
3:📅Weekly: A very strong bullish structure has already formed, and the price has made a BOS and almost completed its corrective move. The corrective area ranges from 100 to 104. Here, we need to wait for a strong reversal signal to confirm the buying opportunity. No further signals are needed, only one confirmed reversal signal.
4:🕛Daily: A well-established bullish trend is evident, with a strong inducement and a corrective move that has filled the gap and window. The price is now approaching the most recent support area after the inducement. The most important thing to watch carefully is the confirmation of today's pro-gap. If the price closes above 112 for the next two or three days, or even today, it will provide a buying confirmation.
😇7 Dimension analysis
🟢 analysis time frame: Daily
5: 1 Price Structure: Extremely bullish
6: 2 Pattern Candle Chart: Pro-gap
7: 3 Volume: High selling volumes indicate the end of the correction, and now a confirmation of the long position is needed.
8: 4 Momentum UNCONVENTIONAL RSI: Holding above the 40 area, indicating a middle strength bullish zone.
9: 5 Volatility measure Bollinger bands: Volatility is starting to squeeze, which may lead to a temporary calm or sideways movement before a bullish move. The breakout of the squeeze will provide final confirmation.
10: 6 Strength ADX: Completely sideways.
11: 7 Sentiment ROC:
✔️ Entry Time Frame: Daily
12: Entry TF Structure: Bullish
13: Entry Move: Initial impulsive move
14: Support Resistance Base: The most recent Order Structure (OS) after the inducement acts as strong support.
15: FIB: Not activated yet. Additionally, a breakout of the hourly trend line will provide an additional confirmation.
☑️ Final comments: Buy at confirmation.
16: 💡Decision: Go long.
17: 🚀Entry: 112
18: ✋Stop Loss: 104
19: 🎯Take Profit: 148
20: 😊Risk to Reward Ratio: 1:6.5
🕛 Expected Duration: 30 days
AMD -> Almost Ready For Another PumpHello Traders,
welcome to this free and educational multi-timeframe technical analysis.
On the weekly timeframe you can see that AMD just recently perfectly retested and already started to reject a major previous weekly structure zone at the $130 level.
You can also see that the next weekly support zone is at the $100-$105 area - I definitely do expect AMD to retest this support before I then do expect some bullish rejection and an overall continuation of the underlying uptrend.
On the daily timeframe you can see that AMD just created a beautiful double top formation which is a classic bearish reversal pattern so there is the possibility that we will first see more downside to retest the $105 support before we will then see a bullish rejection.
Thank you for watching and I will see you tomorrow!
You can also check out my previous analysis of this asset:

AMD STRONG UPTRENDAMD is currently creating a possible weekly higher low which is an indication of the start of a uptrend on lower time frames. AMD also has earnings after market today which could initiate the move or invalidate it. With the weekly having a closed bullish Pinbar @ the trendline there is strong confirmation signaling a bullish move up for the next week or two.
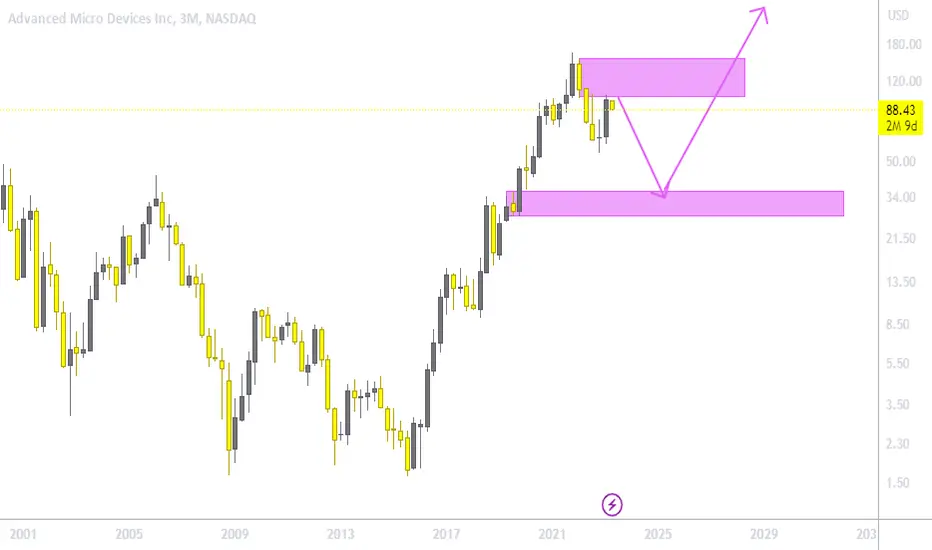
AMD Inc Chart AnalyticsHi
in Amd Chart in Monthly Timeframe i See strong supply Area and Pice Will Fall to around 37$ but in 37$ is a Good Point to Go for Long
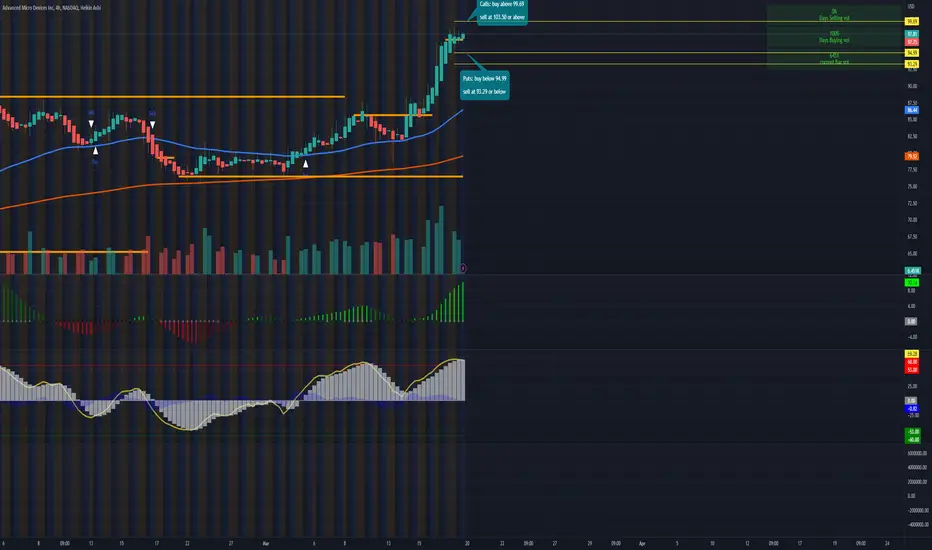
AMD bullish move? - $AMD continues to push higher, along with the broader tech sector, amid overall market strength.
- AMD broke through its tough resistance at $90 and is currently closing around $97.
- Technical indicators are signaling that it's overbought, so don't be surprised if the stock pulls back. Bulls need to hold AMD above $85-90 to continue its bullish momentum.
- $AMD average price move per day is $2-$6 per day depending on market volatility.
- Below are my price levels for AMD.
Calls: buy above 99.69 sell at 103.69+
Puts: Buy below 94.99 sell at 93.29
=================================================================
SIDE NOTE:
- make sure that you setup a price alerts on those key level so you wont miss the move.
and always to take your profits as you see one.
- sometimes, the fist 30 minute after of the opening bell is always volatile.
is either you can catch the move there. or wait for an 1 hour for better or cheaper price.
- as always if you have any question feel free to leave me a comment here.
if you're enjoying my ideas please don't forget to follow me or give the idea
a boost or like. thank you see you all soon.
AMD -> It Is Over For Bears!Hello Traders,
welcome to this free and educational multi-timeframe technical analysis .
On the weekly timeframe you can see that AMD stocks currently looks extremely bullish in my opinion.
We just broke above a key down-trendline, we also created and already confirmed a weekly double bottom and the next resistance area at the $105 area is quite far away so from a weekly perspective I just do expect more continuation towards the upside.
On the daily timeframe you can also see that with today's candle we are breaking above a previous daily resistance area, so I am now just waiting for the retest and some bullish confirmation and then also the daily timeframe looks ready for the next rally towards the upside.
Thank you for watching and I will see you tomorrow!
You can also check out my previous analysis of this asset:

AMD -> Preparing The Rally?Hello Traders,
welcome to this free and educational multi-timeframe technical analysis .
On the weekly timeframe AMD stock is currently retesting the neckline of the very obvious weekly double bottom as predicted in my last video analysis which is linked below.
Since we are now retesting previous weekly resistance which is now turned support and we are also having a bullish ema crossover, I do expect at least a short term rally towards the upside from here.
On the daily timeframe, market structure is still overall bearish so I am now just waiting for a deeper retest of the zone and some bullish confirmation before AMD stock will then start the next pump towards the upside.
Thank you for watching and I will see you tomorrow!
You can also check out my previous analysis of this asset:

AMD -> Patience And Then BoomHello Traders,
welcome to this free and educational multi-timeframe technical analysis .
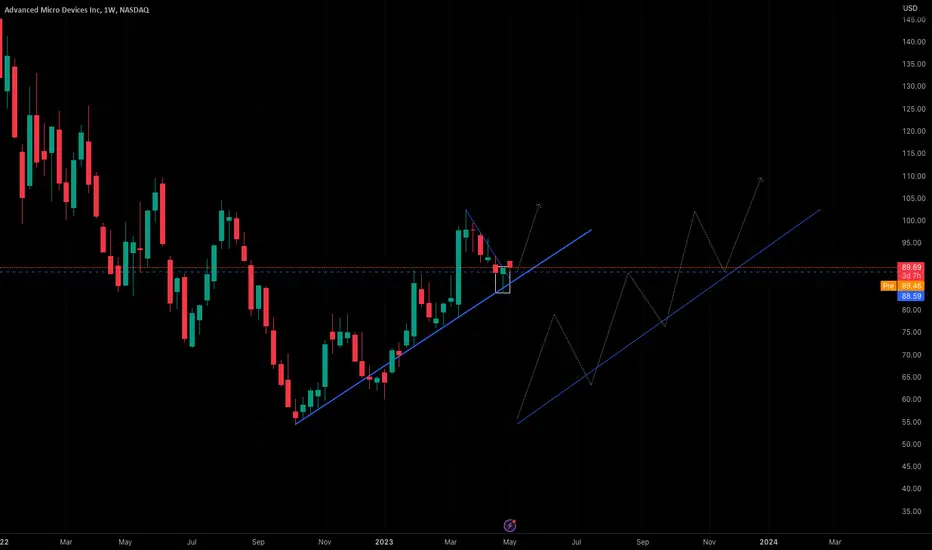
From a weekly perspective, AMD stock is looking extremely bullish. We just had a bullish ema crossover, a double bottom and also a trendline breakout, everything indicating that we will actually see the continuation towards the upside.
I am now just waiting for a retest of the neckline of the double bottom, before I do expect the next push higher.
On the daily timeframe, same scenario, just waiting for a retest of the previous resistance which is now turned support and then the continuation towards the upside.
Thank you for watching and I will see you tomorrow!
You can also check out my previous analysis of this asset:

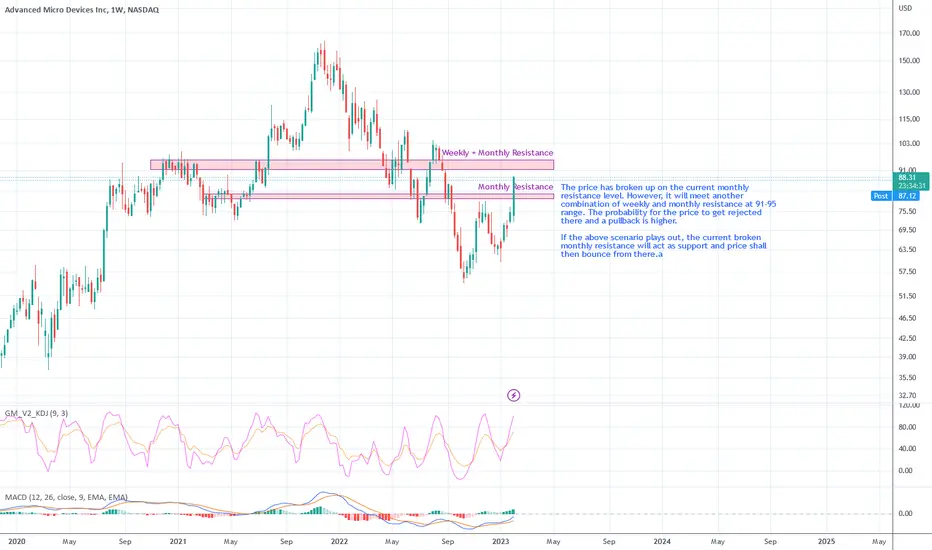
AMD soon to hit a weekly and monthly resistance at 91-95 rangeThe price has broken up on the current monthly resistance level. However, it will meet another combination of weekly and monthly resistance at 91-95 range. The probability for the price to get rejected there and a pullback is higher.
If the above scenario plays out, the current broken monthly resistance will act as support and price shall then bounce from there.a
AMD -> The Breakout Happened As PredictedHello Traders,
welcome to this free and educational multi-timeframe technical analysis .
In my last video analysis of AMD, linked below, I explained all the reasons for which I do expect the market to provide further continuation towards the upside and actually breaking above the neckline of the very obvious weekly double bottom.
With todays price action, this is exactly what happened, we are seeing a massive breakout to the upside, which could definitely lead to a significant short covering rally.
I am now just waiting for a small retracement on AMD and bullish confirmation to enter a long to also participate in this very bullish momentum.
Thank you for watching and I will see you tomorrow!
You can also check out my previous analysis of this asset:

Advanced Micro Devices Analysis 23.01.2023Hello Traders,
welcome to this free and educational analysis.
I am going to explain where I think this asset is going to go over the next few days and weeks and where I would look for trading opportunities.
If you have any questions or suggestions which asset I should analyse tomorrow, please leave a comment below.
I will personally reply to every single comment!
If you enjoyed this analysis, I would definitely appreciate it, if you smash that like button and maybe consider following my channel.
Thank you for watching and I will see you tomorrow!
You can also check out my previous analysis of this asset:

AMD continued momentum$AMD soar last week as market pivots due to inflation data from last week. AMD setup is looking bullish here as it entered the squeeze zone going up.
as you ca see in my chart. I marked some of the potential entry and exit if the stock extend its rally tomorrow. and also the potential entry for puts if
the stocks decides to pull back.
Make sure to set your alerts on those price target so you wont miss the move.
for more details AMD analysis. check out my streams.
Honorable mentions: GOOG AMZN QCOM NVDA DAL BA ( they all have almost similar setup)
=========================================================
Hi and welcome to this free technical analysis . ( mostly momentum play )
I am going to POST where i look for possibly entry and exit for intraday or scalp for trading.
I will try my best to make the idea short and simple as possible.
If you have any questions or suggestions on which stocks I should analyze, please leave a comment below.
If you enjoyed this analysis, I would appreciate it if you smashed that LIKE or BOOST button and maybe consider following my page.

Advanced Micro Devices Analysis 27.12.2022
Hello Traders,
welcome to this free and educational analysis.
I am going to explain where I think this asset is going to go over the next few days and weeks and where I would look for trading opportunities.
If you have any questions or suggestions which asset I should analyse tomorrow, please leave a comment below.
I will personally reply to every single comment!
If you enjoyed this analysis, I would definitely appreciate it, if you smash that like button and maybe consider following my channel.
Thank you for watching and I will see you tomorrow!
You can also check out my previous analysis of this asset:

AMD Back To Previous LowsAMD is down 60% from its all time high (ath), and even went so low as 67%. Things are looking grim for the tech stock, however, things may start to turn around sooner than later.
This down trend has been going on in a falling channel, which is my favorite pattern to trade. Judging from the magnitute of the decline of the last couple weeks, it seems like the stock want to come back to its previous low. From there, we can expect a small bounce, and potentionally, making a lower low.
From there, we want the lower low to be formed above the middle line of the channel. If that is the case, 49 dollars could be the bottom for AMD of this bear market, bringing us to a total decline of 70%.

Advanced Micro Devices Analysis 12.12.2022Hello Traders,
welcome to this free and educational analysis.
I am going to explain where I think this asset is going to go over the next few days and weeks and where I would look for trading opportunities.
If you have any questions or suggestions which asset I should analyse tomorrow, please leave a comment below.
I will personally reply to every single comment!
If you enjoyed this analysis, I would definitely appreciate it, if you smash that like button and maybe consider following my channel.
Thank you for watching and I will see you tomorrow!
You can also check out my previous analysis:

Advanced Micro Devices Analysis 27.11.2022Hello Traders,
welcome to this free and educational analysis.
I am going to explain where I think this asset is going to go over the next few days and weeks and where I would look for trading opportunities.
If you have any questions or suggestions which asset I should analyse tomorrow, please leave a comment below.
I will personally reply to every single comment!
If you enjoyed this analysis, I would definitely appreciate it, if you smash that like button and maybe consider following my channel.
Thank you for watching and I will see you tomorrow!

AMD Advanced Micro Devices Options Ahead of EarningsLooking at the AMD Advanced Micro Devices options chain, i would buy the $60 strike price Puts with
2022-11-4 expiration date for about
$1.81 premium.
If the options turn out to be profitable Before the earnings release, i would sell at least 50%.
Looking forward to read your opinion about it.

🟢 AMD - 3D (06.10.2022)🟢 AMD
TF: 3D
Side: Long
SL: $54.69
TP 1: $86.81
TP 2: $101.65
TP 3: $113.65
AMD has done falling and showing signs of recovery by creating a possible rounding bottom in lower time frames.
I think it will start pushing back up now as RSI and MACD look like they have bottomed and wanting to go up.

2X $AMD TP3 HIT for +20%! (PERFECT MOVE)$AMD has broken retested and made a big leg down to hit our TP3! This is why swing trades PAY we have been in this for 1month and like a week for more than 20%!
