AMD trade setup idea 15-september-2022AMD is in a downward channel since Jan this year. Partly because of the Semiconductor issue.
The current support level is an important level(75-77) for AMD. It has already tested this level twice.
We would have to wait for the price to show us the direction.
If we cross 78.5, we could take a long position with the first target around 83.5 levels.
If it penetrates the support levels of 75, we could take a short position with a mid term target of 60.
Amdprediction

$AMD big resistance..$AMD needs to break the big resistance of $104 before it continues its rally back to 106+ no major news so far about the company and its products. Semis dipped after a market shifted its focus to energy stocks. i believe the semis and the tech stocks will continue to pull back, expect more pain until J Powell next meeting. For now, you might want to check out retail stocks and travel stocks.
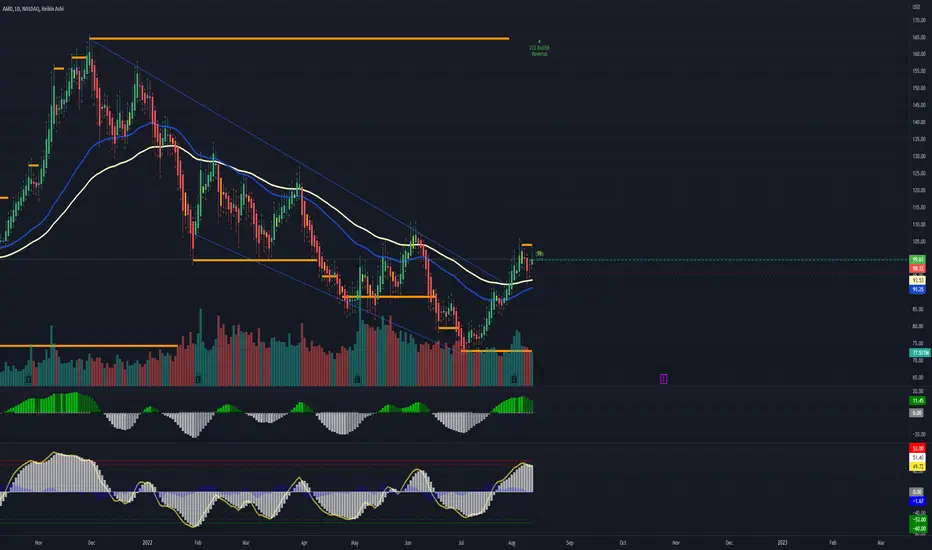
here's my day trade price target for AMD on FRIDAY 08/12/22.
============================================================
For calls; buy above $99.39 and sell at 100.47 or above
For puts, buy below 96.62 and sell at 95.13 or below
============================================================
Welcome to this free technical analysis . ( mostly momentum play )
I am going to explain where I think this stock might possibly go the next day or week play and where I would look for trading opportunities for day trades or scalp play.
If you have any questions or suggestions on which stocks I should analyze, please leave a comment below.
If you enjoyed this analysis, I would appreciate it if you smashed that LIKE or BOOST button and maybe consider following my channel.
AMD - Ain't Moving Down!Advanced Micro Devices
Short Term
We look to Buy at 94.20 (stop at 87.55)
Broken out of the channel formation to the upside. Reverse trend line support can be seen at 95.00. There is scope for mild selling at the open but losses should be limited. Preferred trade is to buy on dips. Dip buying offers good risk/reward.
Our profit targets will be 109.19 and 119.18
Resistance: 110.00 / 125.00 / 163.00
Support: 90.00 / 85.00 / 72.00
Disclaimer – Saxo Bank Group. Please be reminded – you alone are responsible for your trading – both gains and losses. There is a very high degree of risk involved in trading. The technical analysis, like any and all indicators, strategies, columns, articles and other features accessible on/though this site (including those from Signal Centre) are for informational purposes only and should not be construed as investment advice by you. Such technical analysis are believed to be obtained from sources believed to be reliable, but not warrant their respective completeness or accuracy, or warrant any results from the use of the information. Your use of the technical analysis, as would also your use of any and all mentioned indicators, strategies, columns, articles and all other features, is entirely at your own risk and it is your sole responsibility to evaluate the accuracy, completeness and usefulness (including suitability) of the information. You should assess the risk of any trade with your financial adviser and make your own independent decision(s) regarding any tradable products which may be the subject matter of the technical analysis or any of the said indicators, strategies, columns, articles and all other features.
Please also be reminded that if despite the above, any of the said technical analysis (or any of the said indicators, strategies, columns, articles and other features accessible on/through this site) is found to be advisory or a recommendation; and not merely informational in nature, the same is in any event provided with the intention of being for general circulation and availability only. As such it is not intended to and does not form part of any offer or recommendation directed at you specifically, or have any regard to the investment objectives, financial situation or needs of yourself or any other specific person. Before committing to a trade or investment therefore, please seek advice from a financial or other professional adviser regarding the suitability of the product for you and (where available) read the relevant product offer/description documents, including the risk disclosures. If you do not wish to seek such financial advice, please still exercise your mind and consider carefully whether the product is suitable for you because you alone remain responsible for your trading – both gains and losses.

$AMD falling chopstick breakout?AMD breaks out from its 3 day losing streak to 4 day winning streak after the feed week and blue chips earnings. AMD looks like a falling chopstick at 4hr chart. but also clearly visible its lower high movement. with earnings coming up tomorrow after market close. i expect $AMD to pull back along with the overall market as it starts to cool off its steam from 4 day winning streak. or it can go sideway like consolidation and make little move before the market close. AMD could breakout to $100 if they beat the Wall Street EPS estimate with positive guidance.
here my price target for $AMD for monday 08/02/22.
============================================================
For calls; buy above $98.30 and sell at 100.36 or above
For puts, buy below 96.50 and sell at 93.95 or below
============================================================
Welcome to this free technical analysis . ( mostly momentum play )
I am going to explain where I think this stock might possibly go the next day or week play and where I would look for trading opportunities
for day trades or scalp play.
If you have any questions or suggestions on which stocks I should analyze, please leave a comment below.
If you enjoyed this analysis, I would appreciate it if you smashed that LIKE or BOOST button and maybe consider following my channel.

$AMD down trend momentum$AMD has been trending down at a lower level ever since the market continues to pull back. Since then, $AMD picks ups a lot of short interest creating this downward move. The company's earnings have been amazing lately and continues its innovation for computer chips and probably expanding their reach to cloud computing and so on. a lot of big institutional traders seeing a buy, but the uncertain of the current market right now, preventing some traders to hold the stocks for long swing.
The average move of AMD per day is about $4.00-6.00 depending on market conditions and news.
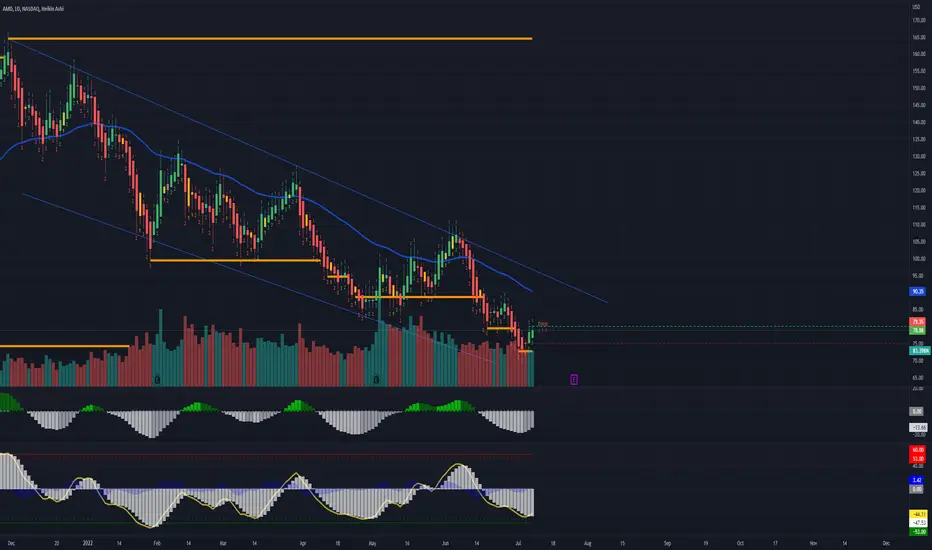
here my price target for $AMD for monday 07/11/22.
============================================================
For calls; buy above $80.15 and sell at 82.14 or above
For puts, buy below 78.18 and sell at 77.40 or below
============================================================
Welcome to this free technical analysis . ( mostly momentum play )
I am going to explain where I think this stock might possibly go the next day or week play and where I would look for trading opportunities
for day trades or scalp play.
If you have any questions or suggestions on which stocks I should analyze, please leave a comment below.
If you enjoyed this analysis, I would appreciate it if you smashed that LIKE button and maybe consider following my channel.
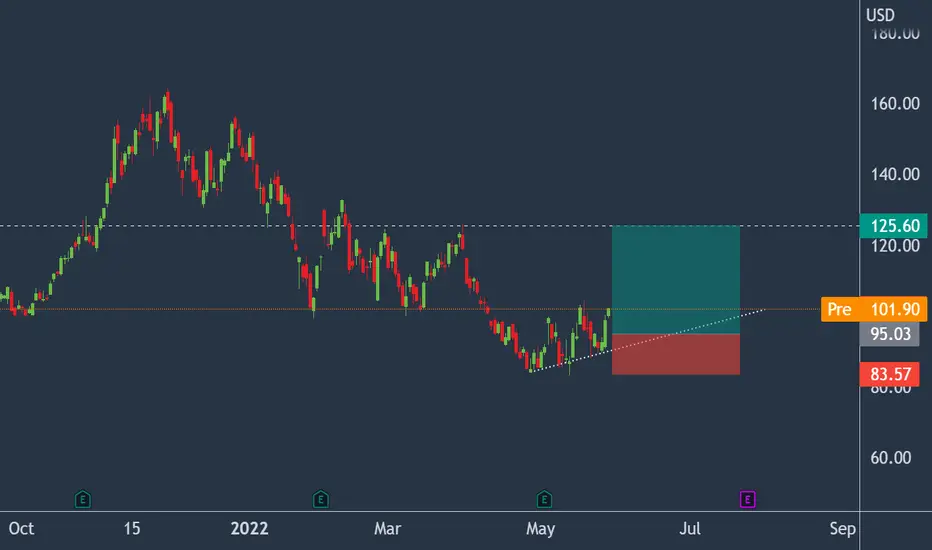
AMD:Bear market rally or turnaround?Advanced Micro Devices
Short Term - We look to Buy at 95.03 (stop at 83.57)
Although the bears are in control, the stalling negative momentum indicates a turnaround is possible. The trend of higher lows is located at 90.43. This is positive for sentiment and the uptrend has potential to return. We look to buy dips. Further upside is expected.
Our profit targets will be 125.60 and 133.11
Resistance: 125.60 / 140.00 / 157.50
Support: 93.50 / 84.00 / 72.30
Please be advised that the information presented on TradingView is provided to Vantage (‘Vantage Global Limited’, ‘we’) by a third-party provider (‘Signal Centre’). Please be reminded that you are solely responsible for the trading decisions on your account. There is a very high degree of risk involved in trading. Any information and/or content is intended entirely for research, educational and informational purposes only and does not constitute investment or consultation advice or investment strategy. The information is not tailored to the investment needs of any specific person and therefore does not involve a consideration of any of the investment objectives, financial situation or needs of any viewer that may receive it. Kindly also note that past performance is not a reliable indicator of future results. Actual results may differ materially from those anticipated in forward-looking or past performance statements. We assume no liability as to the accuracy or completeness of any of the information and/or content provided herein and the Company cannot be held responsible for any omission, mistake nor for any loss or damage including without limitation to any loss of profit which may arise from reliance on any information supplied by Signal Centre.
AMD Forward P/E discountIf you haven`t bought AMD here:
or here:
then you should know that AMD is trading at a 61% forward P/E ratio discount versus the 5 year average!
The Goldman Sachs Group has an $133 price target for it!
Looking forward to read your opinion about it.

ADVANCE MICRO DEVICE .. IF YOU WANT TO SHORT please short only with small qty for practice with giving sl yellow line above..... let the red support break then go you can carry for tomorrow 1.2 target

AMD AnalysisAn idea for AMD which suggests a pullback yet a support find above a major Trendline
Price action is very interesting in yellow, as it moves around the top of the circle (2.618)
White bars pattern is a guess of future price action (allowing support to be found at the Trendline.

AMD I like $166 next target, big run ahead I think So much confluence, volume profile looks ripe and similar to previous capitulations, looking so good.

AMDNot financial advice.
The essence of investing & trading is the intelligent and patient preying on the greed, fear, impatience, addiction and ignorance of the majority. It's definitionally Darwinian.
AMD - Final Push UpA chart for AMD showing bullish activity and price entering a major channel
A phase like this has been seen previously and has been marked with corresponding colours
A giant falling wedge is the culprit for the recent bullishness
One more final move up until top at 1.272

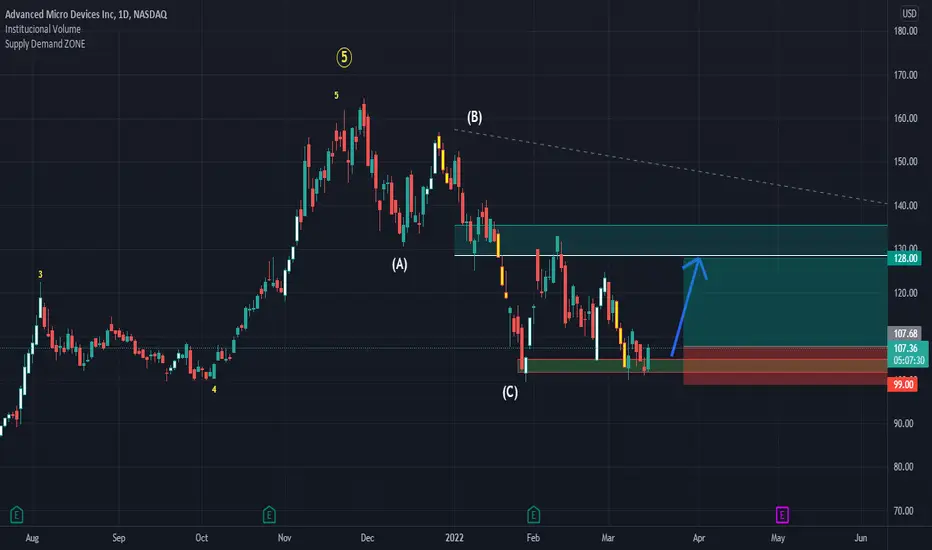
AMD Short term longWe finished 1 to 5 Elliot wave pattern and ABC correction, while in ABC correction market created Institutional candle and retraced to it that is our signal to buy and we are looking for market to retrace to 50% fib zone
Entry Price:108
Target:128
Invalidation: 99
AMD: Will double or triple in the next 12 monthsA detailed explanation as to why I believe AMD stock will double or triple in the next 12 months. See my other posts for my Elliot wave count.

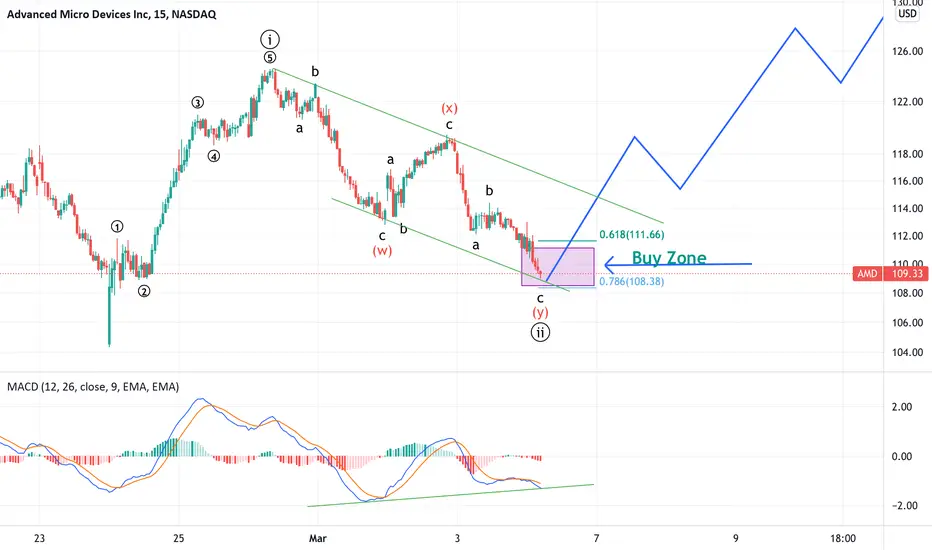
AMD: It is a wonderful time to buyHello traders, it looks like AMD is finishing up its W-2 within a larger degree W-3. We see that price is approaching the .786 fibonacci retracement, and we have a positive MACD divergence. This is a great opportunity too add to your long positions. Soon we will be in W-3 of W-3, so that will be a very powerful move to the upside. Good luck traders :)
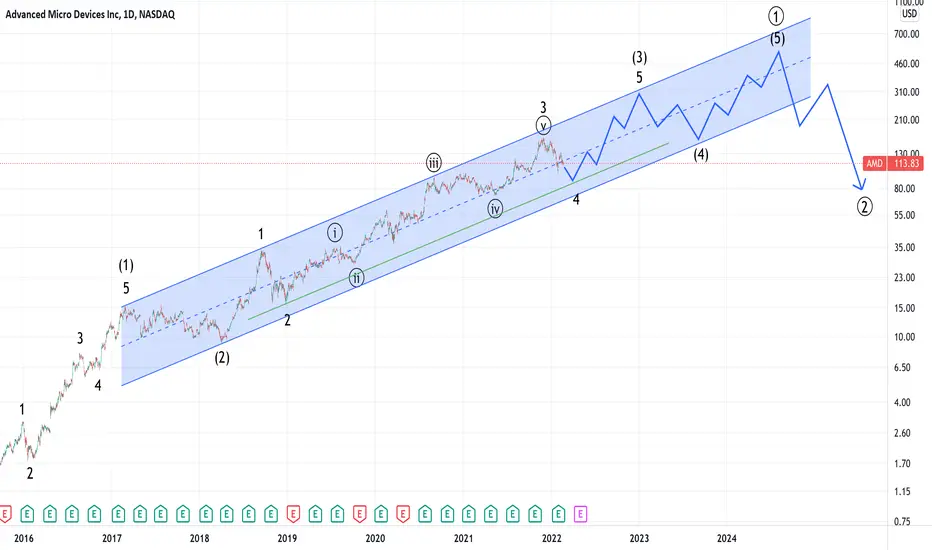
AMD: Big Picture Looks GoodHey friends, here is my longterm view of the AMD chart. On the smaller scale, I think it should bottom in the $80-$90 region and then begin the next leg up to $300+. I would be selling at 300 with the hope of purchasing back at the 150 level for the final leg up to 500+ before AMD enters a prolonged bear market where price can reach the same level it is today.
AMD: Now is NOT the time to buyHello Friends, here is a fresh AMD update. Unfortunately, the outlook is not good right now. For me, I am expecting a final move down to the $86-$92 region before we resume the uptrend. I think the sweet spot will be $88, because this will be the .236 retracement. AMD is very volatile, so large swings like this should not be surprise. For now, I will wait for my price target :)
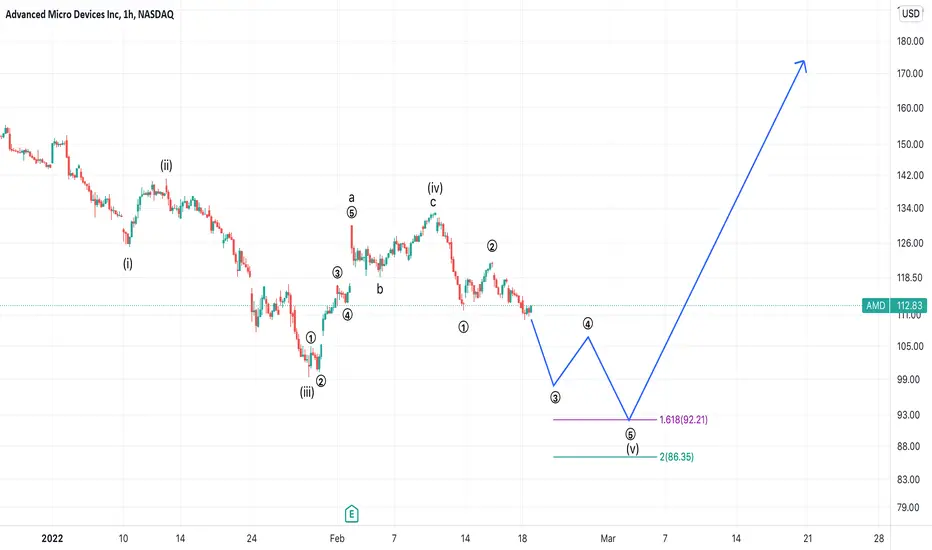
AMD: Time to fill the Gap at 106Hey all, I wanted to give a quick AMD update this morning. After today's price action, the structure of AMD's decline has become more clear. I believe we have 1 leg down to go which should bring us to the 106 region and fill the gap that was left behind. This will be good for AMD longterm, as it is not a a good thing to leave open gaps behind in the chart. I will be adding heavily in the 106 region if we get there. Upside targets are still in tact. Good luck traders.
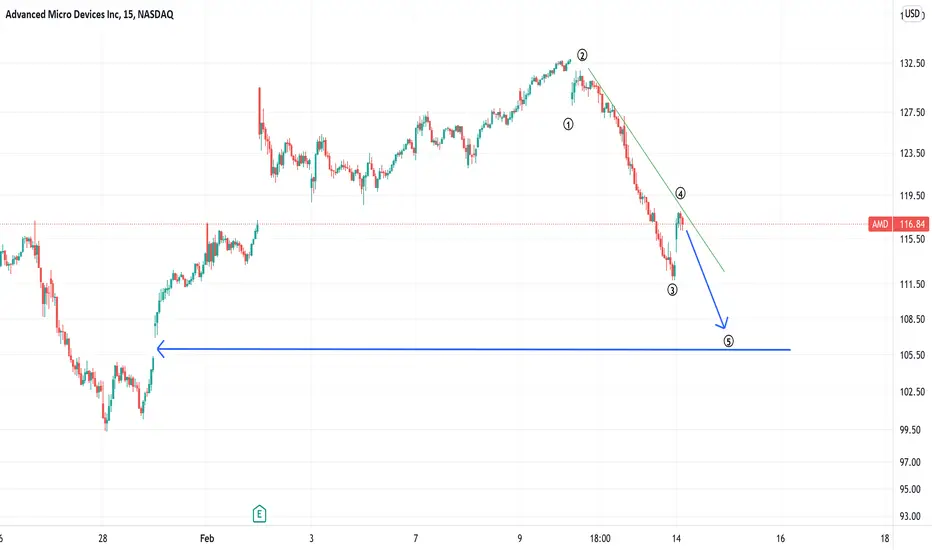
AMD: Time to go longAMD underwent the C-Wave drop that we warned about in our update a few days ago. C-Waves are generally the fastest moving and harshest waves, so it is no surprise that AMD fell about 15% in just 2 days. The speed and depth of the move even exceeded our expectation. In fact, this move was so steep that it difficult to come up with a clear 5 wave pattern down. It may still just be 3 down so far.
My base case is this: AMD has bottomed and will now begin its W-3
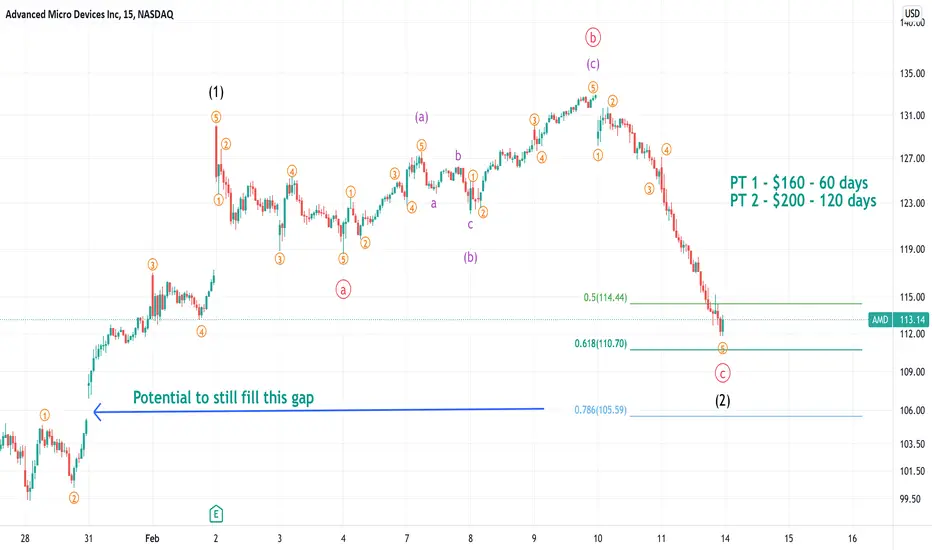
My bear case is this: AMD has 1 more low to make, which will likely fill the gap at the 105 level
Either way my upside targets remain the same: 160 In 60 days, and 200 in 120 days
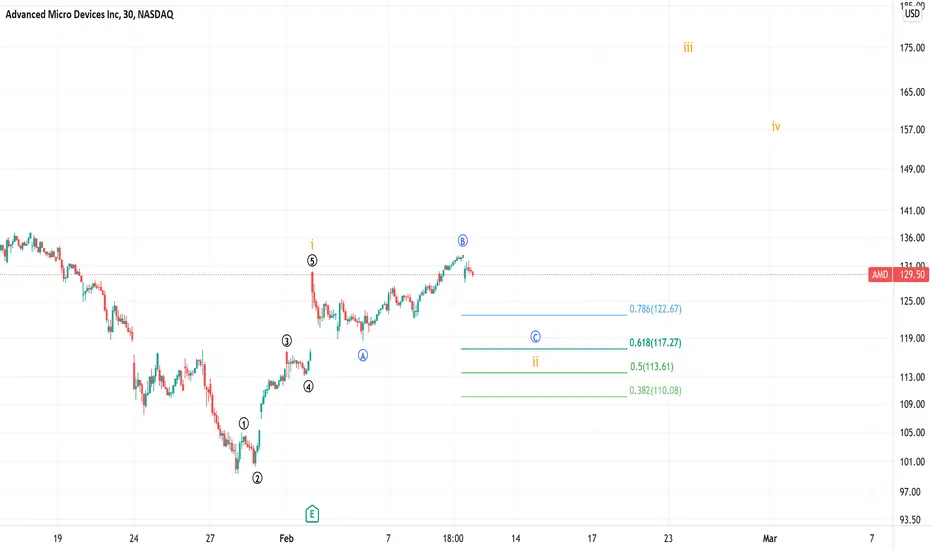
AMD: Go long at 117AMD gave us a clear 5-wave impulsive move off the lows, what happens next is very important. This could be an A-B-C with a final low yet to be struck, but the probability of that has decreased dramatically in my opinion. Right now we are topping in the B-wave. Expect the C-Wave to bring us to the 117-110 level. I will be initiating a long position at 117. Price target for this swing trade is 200+. Nice R/R setup.
AMD Set Price Target by Goldman Sachs If you haven`t bough the January 2021 retracement here:
Then you should know that on 2/2/2022, Toshiya Hari from The Goldman Sachs Group Set Price Target for AMD at $159.00.
Looking forward to read your opinion about it. When it will reach that price target.

Advanced Micro Devices Analysis 06.02.2022Hello Traders,
welcome to this free and educational analysis.
I am going to explain where I think this asset is going to go over the next few days and weeks and where I would look for trading opportunities.
If you have any questions or suggestions which asset I should analyse tomorrow, please leave a comment below.
I will personally reply to every single comment!
If you enjoyed this analysis, I would definitely appreciate it, if you smash that like button and maybe consider following my channel.
Thank you for watching and I will see you tomorrow!

AMD: Still looking for a bottomAMD had a strong 4th wave bounce after it's stellar earnings report. However, the stock turned downwards at a key resistance level. It appears that AMD is forming an expanding diagonal as the C-Wave of this A-B-C pullback. My ideal target is the 2.0 extension, which is $90, before we resume the broader uptrend.
