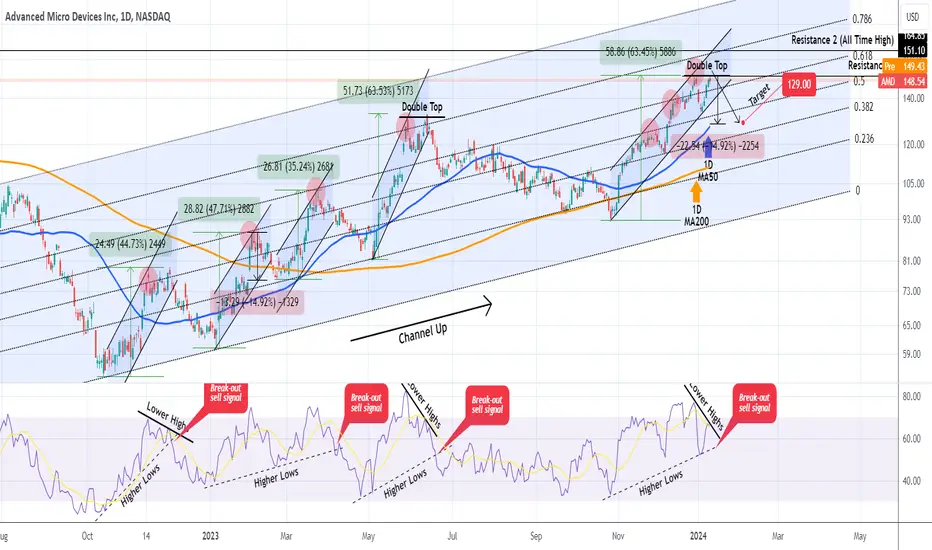
AMD Correction expected on this Double Top.Advanced Micro Devices (AMD) has given excellent pull-back buy opportunities since our last analysis (December 12 2023, see chart below):
We believe though that it is time to take profit on those buy positions as the short-term Channel Up has made a Double Top similar to the June 13 2023 pattern, which started a prolonged correction. Even though the new correction doesn't have to be that long, even a shorter one is plausible as the same 1D RSI Bearish Divergence (on Lower Highs) that we currently have, was seen on all corrections within the 18-month Channel Up, with the shortest of them being -15%.
Assuming this worst case scenario, we turn now bearish and target 129.00 (-15% from the Top). Then as long as the 1D MA200 (orange trend-line) holds, or even if broken when it gets reclaimed, we will buy again for the long-term.
-------------------------------------------------------------------------------
** Please LIKE 👍, FOLLOW ✅, SHARE 🙌 and COMMENT ✍ if you enjoy this idea! Also share your ideas and charts in the comments section below! This is best way to keep it relevant, support us, keep the content here free and allow the idea to reach as many people as possible. **
-------------------------------------------------------------------------------
💸💸💸💸💸💸
👇 👇 👇 👇 👇 👇
Amdsignals
AMD laying path to the All Time High.Advanced Micro Devices (AMD) hit our 133.15 target that we called for a month ago (see chart below):
The price is now extending the rise within the multi-month Channel Up, approaching the 0.618 Fibonacci Channel level. This is where the March 23 High was made with the rejection that followed, approaching the 1D MA200 (orange trend-line). As long as the short-term Channel Up (as you see it is a very common pattern within the wider structure) holds, we will be bullish, targeting 160.00 (Fibonacci 0.786 and close to the All Time High). If the short-term Channel Up breaks, we will sell and target the 0.236 Fibonacci and 1D MA200 at 110.00 (or if contact is made higher, then close on that price).
-------------------------------------------------------------------------------
** Please LIKE 👍, FOLLOW ✅, SHARE 🙌 and COMMENT ✍ if you enjoy this idea! Also share your ideas and charts in the comments section below! This is best way to keep it relevant, support us, keep the content here free and allow the idea to reach as many people as possible. **
-------------------------------------------------------------------------------
💸💸💸💸💸💸
👇 👇 👇 👇 👇 👇

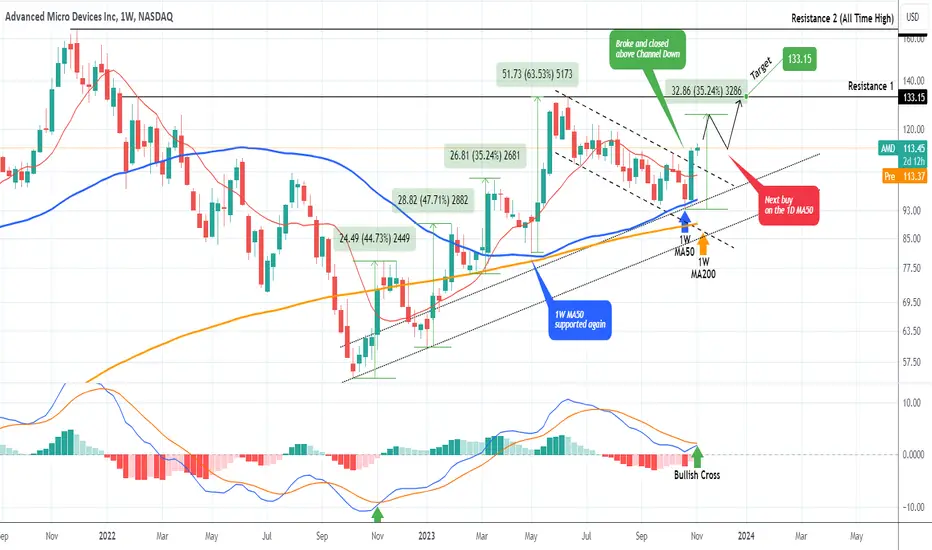
AMD A great long-term buy. First Bullish Cross after 1 year!Advanced Micro Devices (AMD) rose on its most aggressive 1W green candle last week since May 22, as it tested and closed above the 1W MA50 (blue trend-line), which is the long-term Support. This MA level was also tested and held on the week of May 01, which shows that the market has a clear buy zone, despite at times the not so encouraging macro-economics.
Last week's rise also broke above the 5-month Channel Down, which puts it back as a long-term Bull Flag, as it also held the Higher Lows Zone from the October 2022 market bottom.
Perhaps the most important development is the emergence of a Bullish Cross on the 1W MACD, the first since November 14 2022, essentially after a whole year. The minimum rise of AMD's bullish legs since then was +35.24% so we expect this to be fulfilled at $126.00 and then buy the pull-back on the 1D MA50 (red trend-line). With that, we will target $133.15 (Resistance 1). That bullish leg has the potential to test the $164.85 All Time High (ATH) and we will buy it if we close a 1W candle above Resistance 1.
-------------------------------------------------------------------------------
** Please LIKE 👍, FOLLOW ✅, SHARE 🙌 and COMMENT ✍ if you enjoy this idea! Also share your ideas and charts in the comments section below! This is best way to keep it relevant, support us, keep the content here free and allow the idea to reach as many people as possible. **
-------------------------------------------------------------------------------
💸💸💸💸💸💸
👇 👇 👇 👇 👇 👇
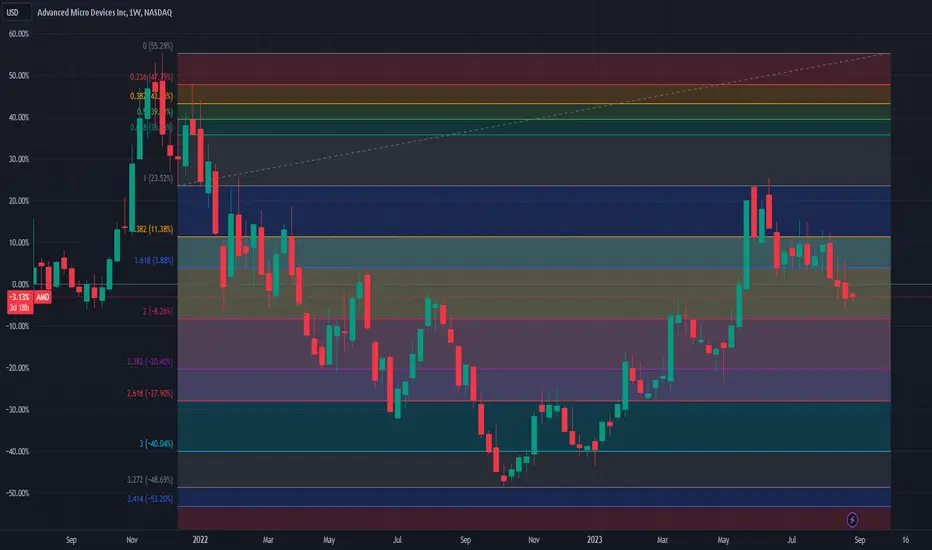
AMD supported by the high point in late March of this year!AMD supported by the high point in late March of this year!
This chart shows the weekly candle chart of AMD's company stocks from May 2021 to the present. The top to bottom golden section at the end of 2021 is superimposed in the figure. As shown in the figure, the recent high point of AMD company's stock has been suppressed by the 1.000 position of the top to bottom golden section in the figure! Then, AMD company's stock engaged in a long short competition between the 1.382 to 1.618 positions in the golden section of the chart from late June of this year to the beginning of this month. In the past three weeks, it has broken down and was supported by the high point in late March of this year! Just use the high point in late March this year (102.43) as the long short watershed for AMD stocks in the future!
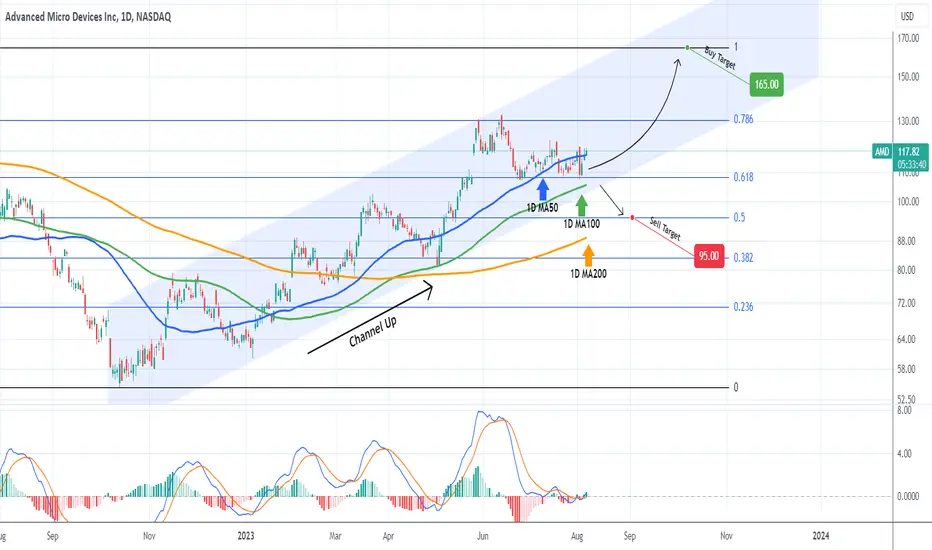
AMD Still a buy as long as the 1D MA100 holds.Advanced Micro Devices (AMD) is trading on its 1D MA50 (blue trend-line), still within the 10 month, maintaining its buy status. As long as the 1D MA100 (green trend-line) holds, we will be long and target the 165.00 All Time High (ATH). If the price closes a 1D candle below the 1D MA100, we will take the loss and open a sell, targeting the 0.5 Fibonacci level at 95.00, on a potential contact with the 1D MA200 (orange trend-line) too, which is intact since March 02.
-------------------------------------------------------------------------------
** Please LIKE 👍, FOLLOW ✅, SHARE 🙌 and COMMENT ✍ if you enjoy this idea! Also share your ideas and charts in the comments section below! **
-------------------------------------------------------------------------------
💸💸💸💸💸💸
👇 👇 👇 👇 👇 👇
AMD Targeting $95.00Advanced Micro Devices (AMD) are trading within a Channel Up pattern since the October 13 Low and is about to form a 1D Golden Cross. The 0.5 Fibonacci retracement level is exactly on the 1W MA100 (red trend-line) and we set a medium-term term target on it at $95.00. We expect every closing above each Fibonacci to target the next above it. The 1D RSI is on Higher Lows and at the moment it is exactly on the trend-line.
-------------------------------------------------------------------------------
** Please LIKE 👍, FOLLOW ✅, SHARE 🙌 and COMMENT ✍ if you enjoy this idea! Also share your ideas and charts in the comments section below! **
-------------------------------------------------------------------------------
💸💸💸💸💸💸
👇 👇 👇 👇 👇 👇

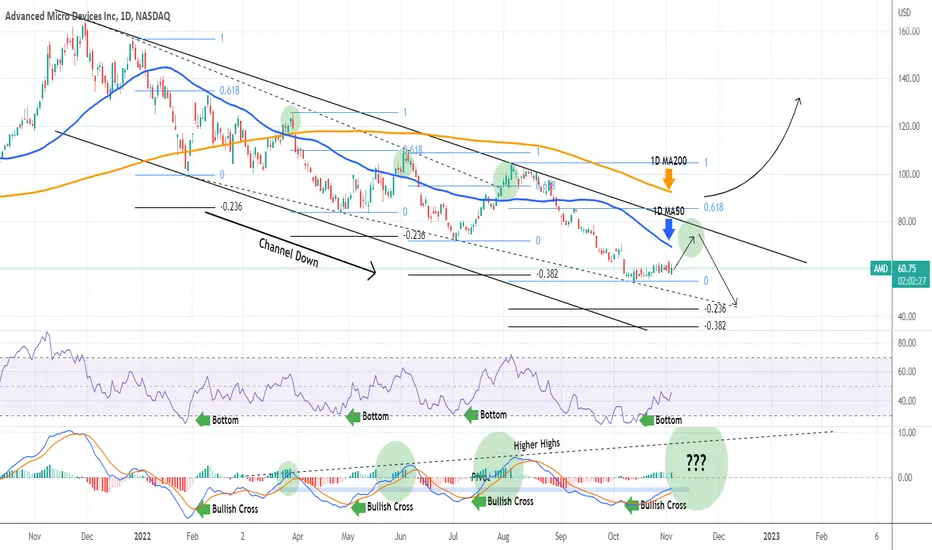
AMD is a strong short-term BuyAdvanced Micro Devices (AMD) has been practically consolidating since the October 13 Low. As the long-term trend has been bearish within a Channel Down pattern since the November 30 2021 Market High, the current consolidation following the rebound on the (dashed) Lower Low (diverging) trend-line can be seen as an Accumulation Phase preparing for the next bullish leg to the top of the Channel.
As you see all previous legs within the Channel Down have been following a certain pattern. After a (near) 30.00 1D RSI reading, and a MACD Bullish Cross, the price rebounds to at least the 0.618 Fibonacci retracement level. That is currently at 85.68 buy is outside the Channel Down, so we will settle for a Target within 73.50 - 77.50. Only a break above the 1D MA200 (orange trend-line) can be considered a long-term trend change to bullish.
See how the 1D MACD prints Higher Highs and each break above the Pivot is larger. More or less this is consistent with the price breaks above the 1D MA50 (blue trend-line).
-------------------------------------------------------------------------------
** Please LIKE 👍, SUBSCRIBE ✅, SHARE 🙌 and COMMENT ✍ if you enjoy this idea! Also share your ideas and charts in the comments section below! This is best way to keep it relevant, support me, keep the content here free and allow the idea to reach as many people as possible. **
-------------------------------------------------------------------------------
You may also TELL ME 🙋♀️🙋♂️ in the comments section which symbol you want me to analyze next and on which time-frame. The one with the most posts will be published tomorrow! 👏🎁
-------------------------------------------------------------------------------
👇 👇 👇 👇 👇 👇
💸💸💸💸💸💸
👇 👇 👇 👇 👇 👇