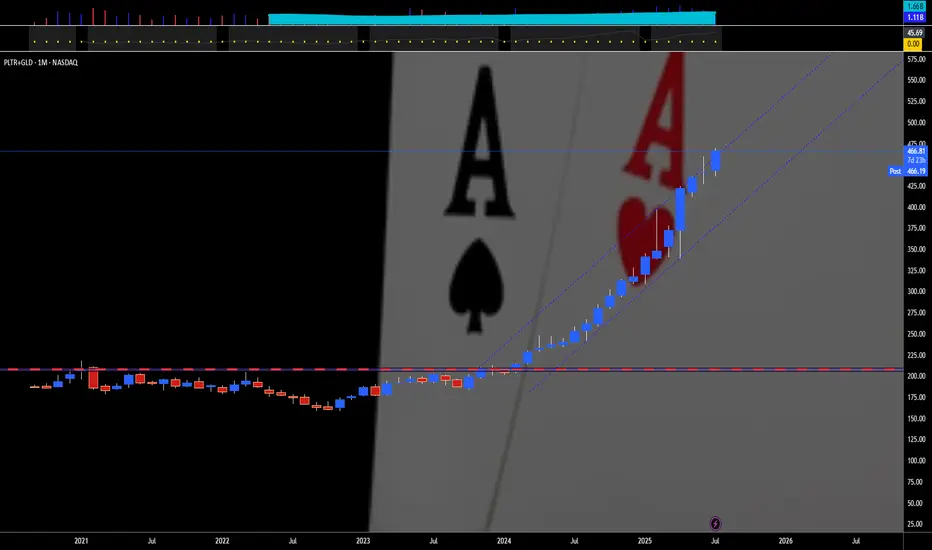
PALANTIR PLUS GOLD — TWO IS A PAIR"Two is a pair" means that the number two represents a set of two identical or closely related items that are used together or considered a unit. For example, a pair of socks, a pair of shoes, or a pair of gloves. It can also refer to two people, animals, or things that are grouped together.
Here's a more detailed breakdown:
Definition:
A pair is a set of two things that are alike, matched, or intended to be used together.
Examples:
"A pair of socks" - two socks designed to be worn on the feet.
"A pair of scissors" - two blades joined together.
"A pair of lovers" - two people romantically involved.
Singular/Plural:
The word "pair" can be singular or plural, depending on how it's used. For example: "This pair is comfortable" (singular) and "These two pairs are comfortable" (plural).
Relationship:
While "pair" often implies a strong connection or matching nature, it can also be used for things that are simply grouped together.
For example, like Palantir NASDAQ:PLTR & Gold AMEX:GLD that match each other, for 18 straight months in a row. 💖
--
Best wishes,
@PandorraResearch Team
Americasucks
MR. COPPER GOES FUN. WITH DONALD TRUMP — IT IS A BULL RUNCopper prices in 2025 are up about 27 percent year-to-date, driven by a complex interplay of technical and fundamental factors, with geopolitical events such as the Trump administration's tariff policies and the escalation of geopolitical tensions in the Middle East having a significant impact.
Fundamental Outlook:
The main driver of copper prices in 2025 is the ongoing global surge in demand driven by the transition to clean energy. Copper is essential for electric vehicles (EVs), renewable energy infrastructure, and grid upgrades, all of which require extensive use of copper due to its superior electrical conductivity.
For example, EVs use about 2-4 times more copper than traditional vehicles, and renewable installations such as wind turbines contain several tons of copper each. This structural growth in demand underpins the optimistic outlook for copper in the medium to long term.
On the supply side, however, copper production is growing. The International Copper Study Group (ICSG) forecasts a global copper surplus of 289,000 tonnes in 2025, more than double the 2024 surplus. This surplus is driven by rising production, particularly from new or expanded operations in the Democratic Republic of Congo, Mongolia, Russia and elsewhere.
Capacity increases in these regions, coupled with smelter growth, could contribute to a supply glut despite strong demand.
Conversely, geopolitical tensions in the Middle East could disrupt bauxite and alumina supply chains, a region that is a strategically important supplier of raw materials.
Impact of Trump Tariffs:
The Trump administration’s threats and actions to impose tariffs on U.S. copper imports have added volatility and complexity to the market. The tariff announcement triggered a sharp sell-off in early April 2025 as concerns about the impact on US manufactured demand and global trade flows grew. London Metal Exchange (LME) copper prices fell to one-month lows following China’s retaliatory tariffs, before partially recovering after some tariff exemptions and reductions were announced.
The tariffs also distorted physical supply chains. Traders rushed to deliver copper to the US ahead of the tariffs, reducing copper availability in other regions such as China. This arbitrage resulted in a significant widening of the price differential between US CME copper contracts and LME copper prices, with US prices trading at a premium of over 10% to London. This premium reflects the tariff risk embedded in the US copper price and expectations of temporary domestic market tensions.
Technical Outlook:
Technically, copper prices have shown resilience despite the tariff shocks. Copper prices sold off after peaking in late March 2025 before the tariffs were announced, but have since begun to recover.
Long-term trendlines and moving averages remain supportive, with the 100-week and 200-week moving averages trending higher and forming a bullish crossover earlier in the year.
Long-term copper prices are once again attacking the 18-year resistance around $4.50/lb ($10/kg) that capped the upside in 2008 and again in the 2010s and first half of the 2020s, with a 1.5x rally in the next 1 to 3 years.
The technical main chart of the COMEX December 2025 copper futures contract COMEX:HGZ2025
points to the possibility of an upside move, all the way to the $7 mark (around $15/kg) as early as H2 2025.
Conclusion
Going forward, copper prices are expected to remain volatile but supported by long-term structural demand growth, with the impact of tariffs likely to cause episodic disruptions rather than a sustained suppression of increasingly hot prices.
--
Best wishes,
@PandorraResearch Team😎

ELON MUSK SAYS: BYE-BYE 300-ish, FOR TESLA INVESTORSTesla's stock has recently suffered a sharp decline, dropping nearly 7% in a single day to about $294, marking a significant fall from its December peak of over $488—a plunge of roughly 40% since then. This downturn is largely attributed to growing investor concerns over CEO Elon Musk's increasing political distractions, particularly his announcement to launch a new U.S. political party, the "America Party," which has intensified his public conflict with former President Donald Trump.
Investors fear Musk's political ambitions could divert his focus from Tesla's core business at a critical time when the company is already grappling with challenges. Tesla recently reported its second consecutive quarterly decline in vehicle deliveries, with a 14% drop year-over-year, and sales slumping amid intensifying competition and production issues. Musk's political entanglements have also alienated key consumer bases, especially in Europe and China, where Tesla's sales have sharply fallen while competitors like BYD have surged.
The stock's technical outlook is bleak, with Tesla's price well below its 50-day and 200-day moving averages, signaling sustained bearish momentum. The combination of disappointing sales, a distracted CEO, and deteriorating investor confidence has made Tesla the worst-performing major growth stock this year, eroding over $80 billion in market value in recent sessions.
In previous posts we have already considered short position scenarios (see related ideas), and in Q3-Q4 2025 we are looking at new Elon Louboutins.
The technical main chart reflects the dynamics of the July Call option on Tesla shares -
OPRA:TSLA250718C275.0 TSLA 18 Jul 2025 Call 275, losing the $30 level, which indicates a continuing loss of the 300 level in Tesla shares.
--
Best Labuten wishes,
@PandorraResearch Team 😎

ELON LABUTENES — BEAR SKETCHES. JUNE 2025 AND HALF A YEAR UPSHOTTesla results in June 2025 draw an alarming picture of the future company. In the second quarter, car supplies were sharply reduced by 14% compared to last year, decreasing to 384,122 units from 443,956 earlier - a clear sign of a decrease in demand and increased competition in the electric car market (EM).
Despite the short-term growth of shares after the results, this happened only because the numbers turned out to be less catastrophic than the most pessimistic forecasts, and not because of any real improvement in fundamental indicators.
Fundamentally key problems include:
The obsolescence of the product line: Tesla cars are increasingly considered as outdated, with minimal innovations in the main models. Widely advertised Cybertruck and Robotaxi programs could not provide a significant volume or excitement, and Model S/X updates could not turn back the drop in sales.
Damage to the brand: the polarizing political participation of the Elon Musk pushed a significant part of the client base, which led to the negative perception of the brand and even the loss of incentives in some regions.
Institutional outflow: Large institutional investors reduce their shares, and the share of ownership falls below 50%, which indicates a lack of trust from “smart money”.
The risks of profitability: due to the fall in sales and reduction of prices undermining the margin, the profitability of Tesla is in jeopardy. Analysts warn of compressing margin and potential negative free cash flow if the trends are preserved.
Technical aspects
In the technical plan, Tesla’s shares completed June 2025 on a low note, among looser components of the S&P 500 index, with a demonstrative decrease in the price of the 1st trading session of July without any obvious V-shope recovery in the following two trading sessions.
In previous publications, we have already examined the scenarios of short positions (see related ideas), and in the III - IV quarters of 2025 we look closely at the new Elon lututs.
The technical main schedule reflects the dynamics of the December Call option for Tesla stocks - OPRA:TSLA251219C300.0 TSLA 19 Dec 2025 Call 300
Resume
Looking ahead, Tesla is faced with a difficult situation, with the further risk of a deterioration in the situation, if it cannot revive demand or restore the image of the brand.
--
With the best Labuten wishes,
@PandorraResearch Team 😎

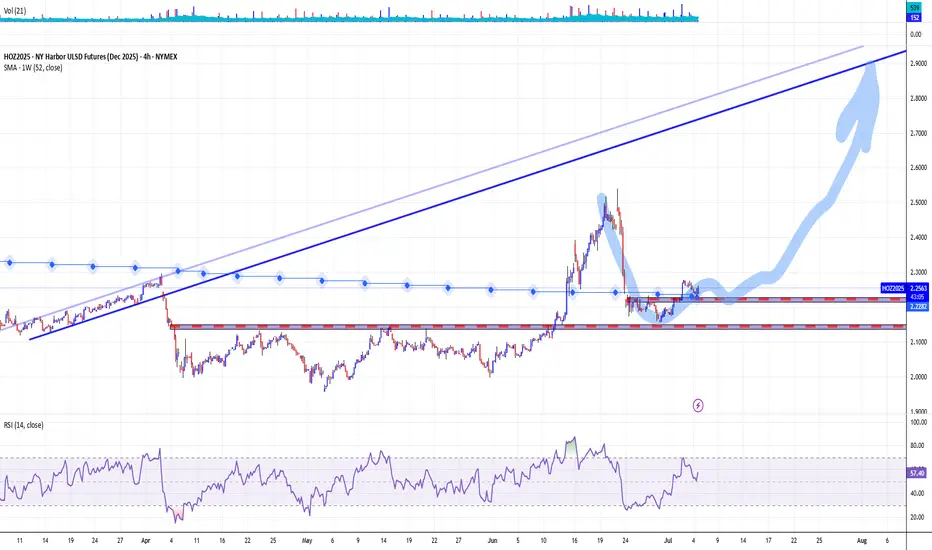
DIESEL OIL GOES 'STILL-RUNNING', AND IT IS NOT A MEME AGAINDiesel Oil NY Harbor ULSD December 2025 futures contracts are trading around $2.25/gallon, once again above its 52-week average, with recent technical ratings indicating a strong buy.
The market has shown a 4.50% rise in the past 5-Day time span, reflecting bullish momentum.
Fundamental Perspective
Supply: Distillate inventories are 20% below the five-year seasonal average, the lowest since 2022. Refinery utilization is high at 94.7%, leaving little buffer for disruptions.
Demand: Distillate consumption has risen to 3.794 million barrels per day, up 260,000 b/d year-over-year, driven by robust industrial activity and summer travel.
Geopolitics: A U.S.-brokered ceasefire in the Middle East has reduced immediate supply risks, but the situation remains fragile and could quickly change.
Macroeconomic Risks: While fundamentals are bullish, potential U.S. recession risks and data reporting delays add uncertainty. Monitoring GDP growth and manufacturing PMIs is crucial.
Summary
ULSD futures are technically strong and fundamentally supported by tight inventories and robust demand, but traders should remain vigilant for macroeconomic and geopolitical shifts.
--
Best wishes,
@PandorraResearch Team 😎
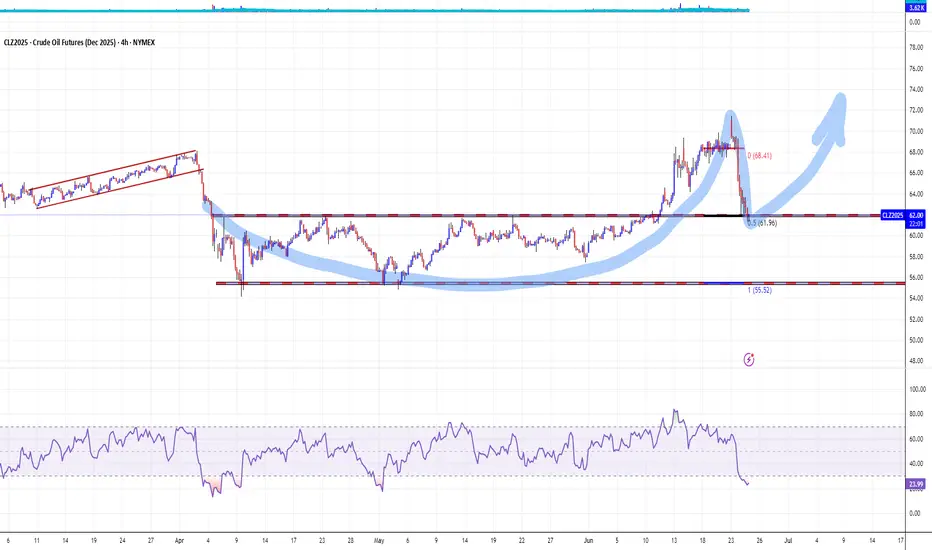
Oil Went Back to 'Pre-conflict' Level on Israel-Iran Ceasefire The Israel-Iran ceasefire has triggered a sharp reversal in global oil markets, sending prices tumbling back to levels seen before the recent conflict. Brent crude ICEEUR:BRN1! fell below $70 per barrel and West Texas Intermediate NYMEX:CL1! dropped to around $65, erasing the risk premium that had built up during nearly two weeks of hostilities. This rapid decline—nearly 17% from the conflict’s peak—reflects investor relief that the threat of major supply disruptions, especially through the vital Strait of Hormuz, has receded for now.
However, the outlook remains uncertain. While the ceasefire has calmed immediate fears, the truce is fragile, with both sides accusing each other of violations within hours of its announcement. Shipping activity through the Strait of Hormuz is still subdued, insurance costs for tankers remain elevated, and some shipowners are steering clear of the region, indicating persistent caution in energy logistics.
If the ceasefire holds, markets may stabilize further, supporting global economic recovery and easing inflationary pressures.
But any renewed escalation or disruption in the Strait of Hormuz could quickly reverse these gains, keeping energy markets on alert for further geopolitical shocks.
The main technical graph for Dec'25 WTI Futures NYMEX:CLZ2025 indicates on 'cup and handle' technical structure with the nearest support around $62 per bll, and further 'double top' price action in upcoming development.
--
Best wishes,
@PandorraResearch Team 😎
GOLD GOES 'PREPARING FOR SCORCHING-HOT JULY'. UPSHOT OF 1H 2025Gold market shines bright in first half of 2025, with nearly 25 percent year-to-date gain, which becomes one of the best start of the year in history ever following 1H 2016 (became a launching pad for Gold to more than Triple in price over next decade) and 1H 1973 (where Gold bugs sharply skyrocketed to infinity and beyond, printed more than 10x over next decade).
The gold spot market in July 2025 is shaped by both fundamental and technical factors supporting a cautiously bullish outlook.
Fundamental perspectives
Were you ready or not, Gold prices have surged significantly in 2025, driven by persistent global uncertainties including geopolitical conflicts (e.g., Middle East tensions), trade disputes, and inflation concerns.
Central banks, notably the Federal Reserve, are expected to cut interest rates later in 2025, reducing the opportunity cost of holding gold, a non-yielding asset. This monetary easing alongside continued inflation worries and safe-haven demand underpins strong gold fundamentals.
Major financial institutions like J.P. Morgan and UBS forecast gold prices averaging around $3,500–$3,675 per ounce in late 2025, with potential to reach $4,000/oz by mid-2026.
Central bank gold purchases and diversification away from US dollar assets also support demand.
Technical perspectives
Technically, gold has experienced volatile but mostly sideways trading in a roughly $300 range around $3,200–$3,500 since mid-2025, reflecting consolidation after a strong rally earlier in the year.
Key support lies near $3,000 and $3,200 levels (125-Day, or 6-Month SMA), with resistance around $3,500 to $3,800. Indicators such as moving averages and RSI suggest an upward trend with possible short-term corrections.
A breakout above $3,500 could trigger further gains toward $3,800, while a drop below $3,200 may lead to testing $3,000 support.
Overall, July is expected to see continued range-bound trading amid new external uncertainties, with bullish momentum intact.
In summary, gold’s fundamentals remain robust due to macroeconomic and geopolitical drivers, while technicals point to consolidation with potential for renewed upward moves in the July 2025 spot market.
--
Best #GODL wishes,
@PandorraResearch Team 😎
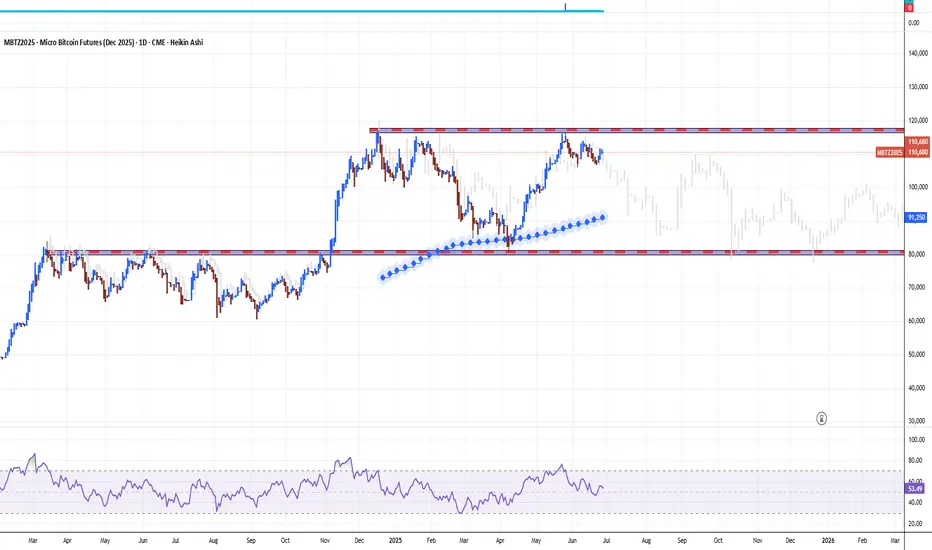
Strategy H2 2025. BTC Airless Plot Near $100'000 Choking PointOver the past 6 months, Bitcoin (BTC) has demonstrated a very mixed up/down performance, marked by significant price fluctuations, appreciation and volatility.
From late December 2024 to June 2025, BTC's price rose from approximately $92,000 to around $108,000, representing a gain of about 17.26% over this period.
On the other hand. the price fluctuated between last price in 2024 $92,000 and BTC' low near $74,491 achieved in early April 2025, posting the similar, nearly 20 percent year-to-date decline.
Bitcoin's price trajectory during this time was influenced by several factors. Early in 2025, BTC reached a new all-time high near $109,000 but faced a pullback triggered by profit-taking and macroeconomic uncertainties, dropping nearly 30% to about $74,000 by April. This decline was short-lived, as Bitcoin quickly rebounded by roughly 24%, climbing back to mid-$90,000 levels and eventually surpassing $100,000 again by June, signaling wide range fluctuations are getting for longer.
The technical setup suggests that Bitcoin is poised for further swings around $100'000 choking point.
In summary, Bitcoin’s performance over the last six months has been characterized by sharp correction, mixed technical buy and sell signals, with no any solid fundamental support from institutional investors.
These factors collectively indicate a mixed outlook for BTC, with further price fluctuations in wide range, as a mid-term pricе action perspective for H2 2025 and for longer.
Similar like a year ago 52-week SMA could be considered as major support level.
--
Best wishes,
@PandorraResearch Team 😎
Canadian Dollar vs. US Dollar. The Spring Is Compressing.In previous posts, we have already begun to look at the key drivers of the US outperformance over the past decade.
The US market dominance has been largely driven by the rapid rise of tech giants (such as Apple, Microsoft, Amazon and Alphabet), which have benefited from strong profit growth, global market reach and significant investor inflows.
Unsatisfactory International Performance
Markets outside the US have faced headwinds including multiple stifling sanctions and tariffs, slowing economic growth, political uncertainty (especially in Europe), a stronger US dollar and the declining influence of high-growth tech sectors.
The Valuation Gap
By 2025, US equities will be considered relatively expensive compared to their international peers, which may offer more attractive valuations in the future.
Recent Shifts (2025 Trend)
Since early 2025, international equities have begun to outperform the S&P 500, and European and Asian equities have regained investor interest. Global market currencies are also widely dominated by the US dollar.
Factors include optimism around the following three big themes.
DE-DOLLARIZATION. DE-AMERICANIZATION. DIVERSIFICATION.
De-dollarization is the process by which countries reduce their reliance on the US dollar (USD) as the world's dominant reserve currency, medium of exchange, and unit of account in international trade and finance. This trend implies a shift away from the central role of the US dollar in global economic transactions to alternative currencies, assets, or financial systems.
Historical context and significance of the US dollar
The US dollar became the world's primary reserve currency after World War II, as enshrined in the Bretton Woods Agreement of 1944. This system pegged other currencies to the dollar, which was convertible into gold, making the dollar the backbone of international finance. The United States became the world's leading economic power, and the dollar replaced the British pound sterling as the dominant currency for global trade and reserves.
The dollar has been the most widely held reserve currency for decades. As of the end of 2024, it still accounts for about 57% of global foreign exchange reserves, far more than the euro (20%) and the Japanese yen (6%). However, this share has fallen from over 70% in 2001, signaling a gradual shift and prompting discussions about de-dollarization.
How De-Dollarization Works
Countries looking to reduce their reliance on the dollar are pursuing several strategies:
Diversifying reserves: Central banks are holding fewer U.S. dollars and increasing their holdings of other currencies, such as the euro, yen, British pound, or new alternatives such as the Chinese yuan. While the yuan's share remains small (about 2.2%), it has grown, especially among countries like Russia.
Using alternative currencies in trade: Countries are entering into bilateral or regional agreements to conduct trade in their own currencies rather than using the dollar as an intermediary. For example, China has introduced yuan-denominated oil futures (the "petroyuan") to challenge the petrodollar system. Increasing gold reserves: Many countries, including China, Russia and India, have significantly increased their purchases of gold as a safer reserve asset, reducing their dollar holdings.
Developing alternative financial systems: Some countries and blocs, such as BRICS, are working to develop alternatives to the US-dominated SWIFT payment system to avoid the risk of sanctions and gain true economic and political independence.
Reasons for de-dollarization
The move towards de-dollarization is driven by geopolitical and economic factors:
Backlash against US economic hegemony: The US often uses dollar dominance to impose sanctions and exert political pressure, encouraging countries to seek financial sovereignty.
Rise of new economic powers: Emerging economies like China and groups like the BRICS are seeking to reduce their vulnerability to U.S. influence and promote regional integration and alternative financial infrastructures.
Geopolitical tensions: Conflicts like the war in Ukraine have intensified efforts by countries like Russia to remove the dollar from their reserves to avoid sanctions.
Implications and outlook
While the dollar remains dominant, a more de-dollarized world is already changing global economic power. The U.S. may lose some advantages, such as lower borrowing costs and geopolitical influence. For the U.S. economy, de-dollarization could lead to a weaker currency, higher interest rates, and reduced foreign investment, although some effects, such as inflation from a weaker dollar, could belimited .
For other countries, de-dollarization could mean greater economic independence and less exposure to U.S. policy risks. However, no currency currently matches the dollar’s liquidity, stability, and global recognition, so a full transition is unlikely in the near future .
Summary
De-dollarization is a complex, ongoing process that reflects a gradual shift away from the global dominance of the U.S. dollar. It involves diversifying reserves, using alternative currencies and assets, and creating new financial systems to reduce dependence on the dollar.
Driven by geopolitical tensions and the rise of emerging economic powers, de-dollarization challenges the entrenched role of the dollar but is unlikely to completely replace it anytime soon.
Instead, it is leading to a more multipolar monetary system in international finance, increasing demand for alternative investments to the U.S.
Technical task
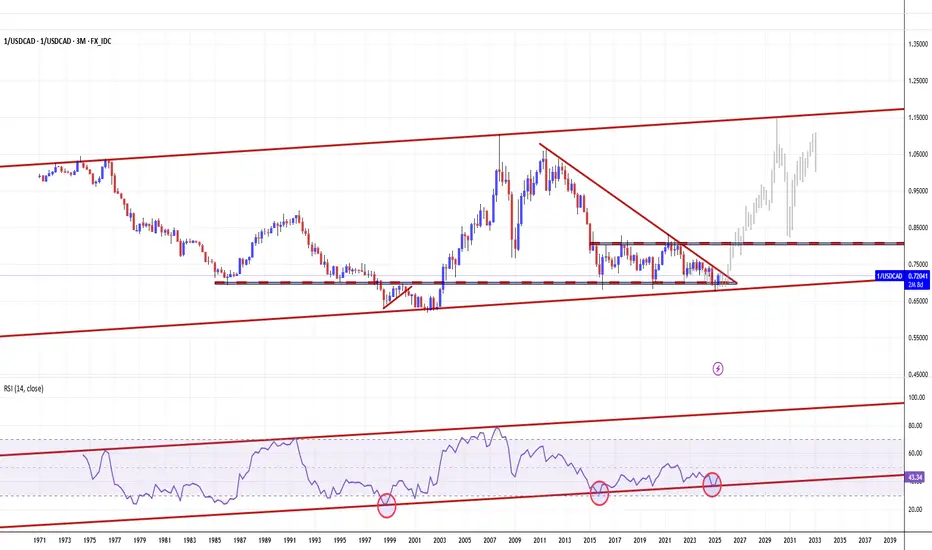
The main technical chart is presented in a quarterly breakdown, reflecting the dynamics of the Canadian dollar against the US dollar FX_IDC:CADUSD in the long term.
With the continued positive momentum of the relative strength indicator RSI(14), flat support near the level of 0.70 and a decreasing resistance level (descending top/ flat bottom) in case of a breakout represent the possibility of price growth to 0.80, with the prospect of parity in the currency pair and strengthening of the Canadian dollar to all-time highs, in the horizon of the next five years.
--
Best wishes,
Your Beloved @PandorraResearch Team 😎
NYSE COMPOSITE INDEX. BACK TO 20 000 MARK — KEY RESISTANCE LINEThe NYSE Composite TVC:NYA is a stock market index, that covering all common stock listed on the New York Stock Exchange, including American depositary receipts, real estate investment trusts, tracking stocks, and foreign listings.
Over 2,000 stocks are covered in the index, of which over 1,600 are from United States corporations and over 360 are foreign listings.
However foreign companies are very prevalent among the largest companies in the index: of the 100 companies in the index having the largest market capitalization (and thus the largest impact on the index), more than half (55) are non-U.S. issues.
Thanks to many non-U.S. components, NYSE Composite index shows nearly 5 per cent return in 2025 so far, outperforms major U.S. stock indices like Dow Jones Industrial (+0.24%), S&P500 (+1.91%), as well as Nasdaq-100 (+3.21%).
Trade negotiations and tariff expectations have been central drivers of the NYSE Composite Index's recent recovery, shaping both market sentiment and underlying corporate fundamentals.
Trade Negotiations. Market Sensitivity and Relief Rallies
Financial markets, including the NYSE Composite, have reacted sharply to developments in trade negotiations. Historically, when trade talks break down or new tariffs are announced, U.S. stocks tend to sell off due to concerns over higher costs, supply chain disruptions, and reduced global demand. Conversely, when negotiations resume or tariffs are delayed, markets often rebound. For example, during the 2018–2019 U.S.–China trade war, U.S. stocks experienced heightened volatility, but rallied strongly after the announcement of the Phase I trade deal, as uncertainty eased and the threat of further escalation diminished. This pattern has repeated in 2025: the NYSE Composite has staged recoveries following signs of progress in trade talks or delays in tariff implementation, as investors anticipate less disruption to global commerce and corporate earnings.
Tariff Expectations. Impact on Earnings, Valuations, and Sentiment
Tariffs directly affect corporate earnings by raising input costs for companies that rely on imported goods. According to Goldman Sachs Research, every five-percentage-point increase in the U.S. tariff rate is estimated to reduce S&P 500 earnings per share by roughly 1-2%. If companies absorb these costs, profit margins are squeezed; if they pass them on to consumers, sales may decline. The NYSE Composite, which tracks a broad swath of U.S. and international companies, is similarly exposed.
Expectations around tariffs also influence equity valuations.
Elevated policy uncertainty—driven by unpredictable tariff announcements—raises the risk premium investors demand, often compressing price-to-earnings multiples and weighing on stock prices. When clarity emerges, such as the announcement of a tariff pause or the prospect of a negotiated settlement, uncertainty recedes, and valuations can recover, fueling index gains.
The Role of Policy Announcements and Market Psychology.
Trade policy announcements have acted as economic shocks, affecting global trade relationships and growth forecasts. For instance, after the U.S. announced new tariffs in early 2025, recession odds rose and GDP growth forecasts were slashed, prompting a broad market sell-off. However, the subsequent announcement of a 90-day tariff pause and renewed negotiations led to a stabilization and partial recovery in equities, as investors reassessed the likelihood of a severe downturn.
Market psychology amplifies these moves.
As trade rhetoric intensifies, investor sentiment can become excessively pessimistic, sometimes overshooting the actual economic impact of tariffs. This creates conditions for relief rallies when negotiations show progress or when the tariff outlook becomes less severe than feared.
Technical challenge
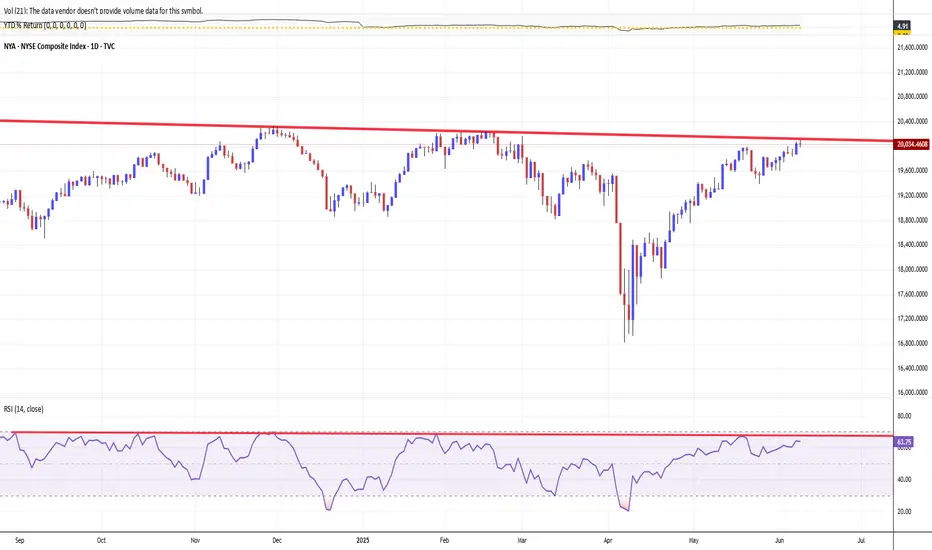
NYSE Composite index has experiencied record values on Friday, November 29, 2024, following so-called Trump-a-Rally.
The best Closing high was 20,272.04 ponts at those day and the best Intraday high was 20,332.50 points, also at the same day.
However unability to finish the year 2024 firmly above 20 000 round number, sharply pushed stock market bulls into fart and double-digit decline earlier in 2025.
The main chart indicates on major resistance again, near 20 000 point while technical indicator RSI (14) still goes sluggish.
Conclusion
The NYSE Composite Index's recovery has been closely tied to the ebb and flow of trade negotiations and tariff expectations. Positive developments in negotiations and reduced tariff threats have alleviated uncertainty, supported earnings expectations, and improved investor sentiment, all of which have contributed to the index's rebound.
--
Best wishes,
@PandorraResearch Team 😎
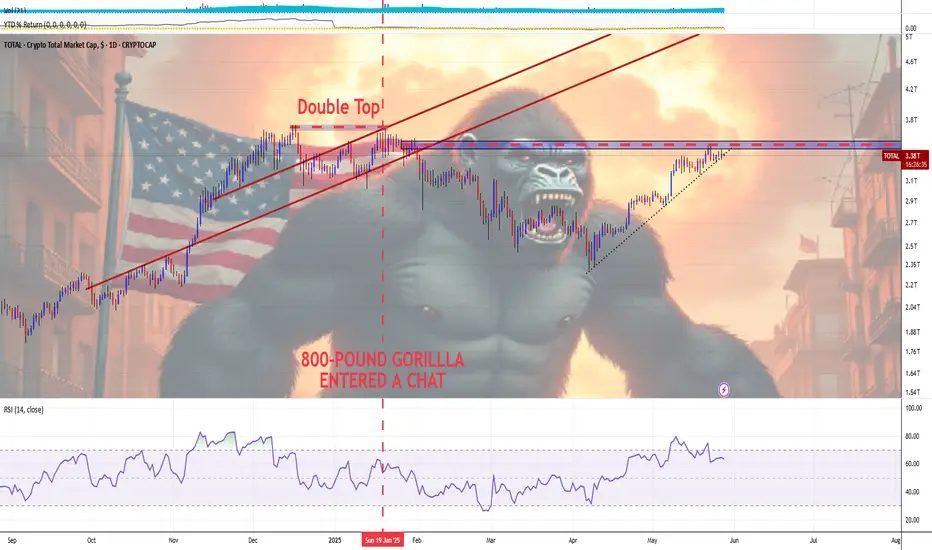
TOTAL Crypto Market. Games with the 800-Pound Gorilla. Series IIOver the 4 months since Donald Trump’s inauguration in January 2025, his administration’s policies have had a complex and in many ways negative impact on cryptocurrency markets, despite the overall pro-crypto agenda.
Short-Term Market Volatility Due to Tariff Policy
One of the most significant negative impacts has been caused by Trump’s aggressive tariff policy. The announcement and subsequent implementation of new tariffs sent shock waves through global financial markets, including cryptocurrencies.
The immediate effect has been increased volatility, with Bitcoin down a third from its highs, Ethereum and many other major coins also falling by more than half, and crypto futures seeing liquidations of over $450 million in a single day.
This turbulence was not isolated — experts noted that broader “risk aversion,” in which investors flee volatile assets for safer havens like gold, led to sharp declines in both the stock and crypto markets.
Uncertainty around tariffs — particularly reciprocal tariffs affecting up to 25 countries — created short-term headwinds for cryptocurrencies. As institutional and foreign investors pulled billions out of U.S. stocks, the resulting market volatility spilled over to cryptocurrency, which remains closely tied to tech indexes like the NASDAQ. This risk aversion delayed potential rallies and led to a volatile, unpredictable trading environment.
Regulatory Rollbacks and Market Integrity Concerns
The Trump administration has aggressively rolled back regulatory oversight in an attempt to create a more crypto-friendly environment. Key steps include disbanding the Justice Department’s National Cryptocurrency Enforcement Team (NCET), appointing pro-crypto officials to regulatory bodies, and directing agencies to streamline or repeal existing crypto regulations. While these actions have reduced the compliance burden on crypto businesses and spurred innovation, they have also raised serious concerns about the integrity of the market.
Critics argue that loosening oversight increases the risks of money laundering, fraud, and illegal transactions, which could undermine investor protections and the overall reputation of U.S. crypto markets.
Consumer advocacy groups warn that rapid deregulation could encourage abuse and undermine trust, especially since the Trump administration has also banned the development of a U.S. central bank digital currency (CBDC), setting the U.S. apart from other major economies pursuing digital currency initiatives.
Conflicts of Interest and Ethical Controversies
Another negative impact has been the perception — if not the reality — of conflicts of interest and ethical dilemmas. The Trump family’s direct involvement in crypto projects, including the launch of a stablecoin and investments in mining, has fueled suspicions of market manipulation and blurred the lines between personal and presidential interests.
Such controversies have further undermined investor confidence and contributed to a sense of unpredictability in regulatory and market outcomes.
Summary Table: Key Negative Impacts
Policy/Action =>> Negative impact on crypto markets
Rising Tariffs and Trade Uncertainty =>> Increased volatility, risk aversion, falling prices.
Regulatory Rollbacks/NCET Dissolution =>> Weakened oversight, higher risk of fraud and abuse.
CBDC Development Ban =>> US Lagging Global Digital Currency Innovation
Trump Family’s Direct Involvement in Crypto =>> Alleged Conflicts of Interest, Market Manipulation Concerns.
Technical Challenge
The technical picture in the main crypto market cap chart CRYPTOCAP:TOTAL points to the end of the recovery period, reaching a key resistance near the $3.5 trillion mark.
Conclusion
While the Trump administration has promoted a more liberal environment for crypto innovation, the last four months have seen significant negative effects: increased market volatility due to tariff policy, increased risk due to deregulation, and growing concerns about conflicts of interest.
These factors have combined to create an atmosphere of uncertainty and skepticism, which is undermining the stability and trust in the US crypto markets in the short term.
--
Best wishes,
@PandorraResearch Team 😎
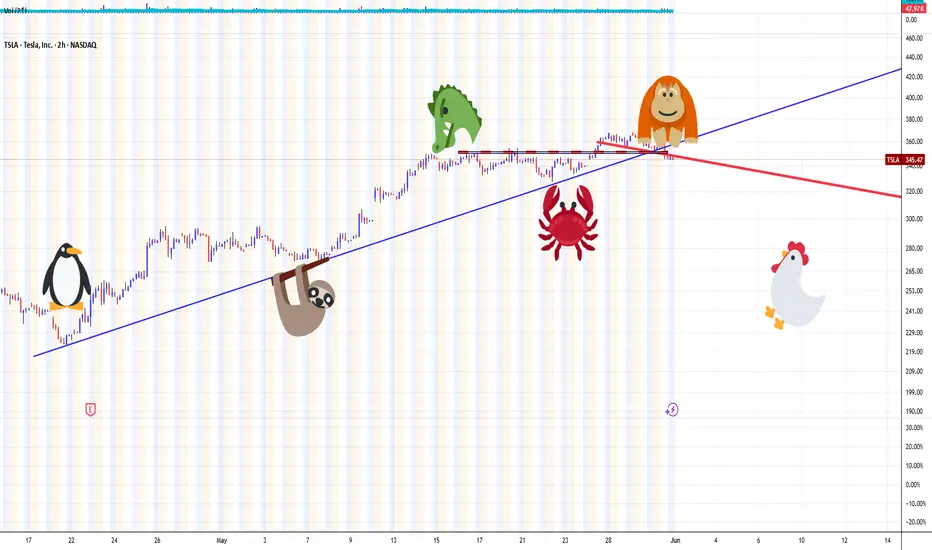
TESLA GOES READY FOR ITS NEW LEG DOWN. HERE'S WHAT WE KNOW ABOUTTesla stock declined after Elon Musk’s departure from the Trump administration due to a combination of reputational, operational, and market factors:
Political Backlash and Brand Damage. Musk’s close association with the Trump administration and his leadership of the Department of Government Efficiency (DOGE) generated widespread protests and alienated many of Tesla’s traditional, progressive customer base. This political controversy led to a decline in consumer interest and unsettled investors who were concerned about the brand’s long-term appeal.
Sales and Profit Declines. Tesla faced falling sales and profits, with deliveries dropping in key markets like China and Europe, partly due to intensifying competition and partly due to the backlash against Musk’s political activities. The company reported a 13% year-over-year decline in deliveries, and operating profits fell as well.
Investor Concerns Over Leadership Focus. Investors grew worried that Musk’s political involvement was distracting him from Tesla’s core business at a critical time. There was a perception that the company was losing its competitive edge and that Musk’s attention was divided, which amplified concerns about Tesla’s future growth.
Market Correction After “Trump Bump”. Tesla’s stock had surged after Trump’s election, buoyed by expectations of favorable policies. However, as Musk’s political involvement became a liability and operational challenges mounted, the post-election gains evaporated, and the stock corrected sharply downward.
In summary, Musk’s controversial political role, combined with operational headwinds and shifting investor sentiment, triggered a significant decline in Tesla’s stock after his exit from the Trump administration.
--
Best wishes
@PandorraResearch Team
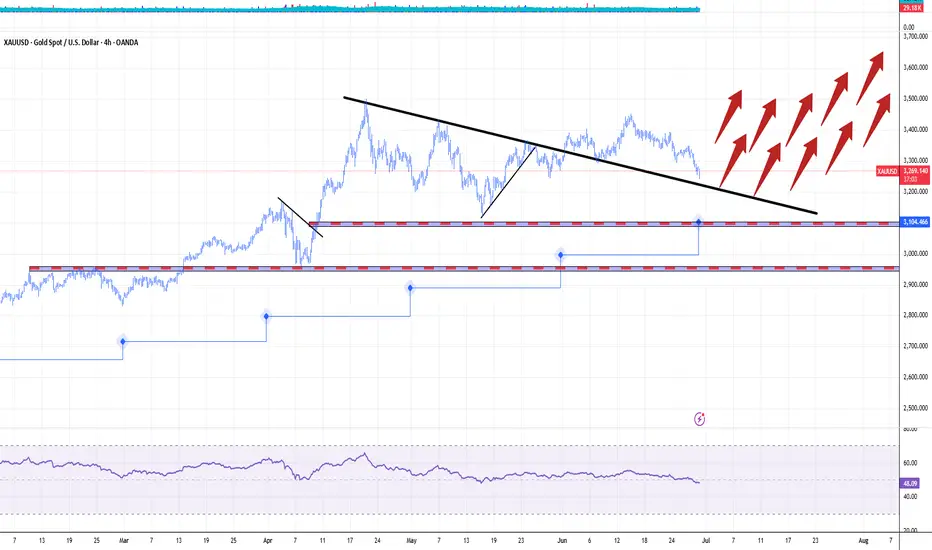
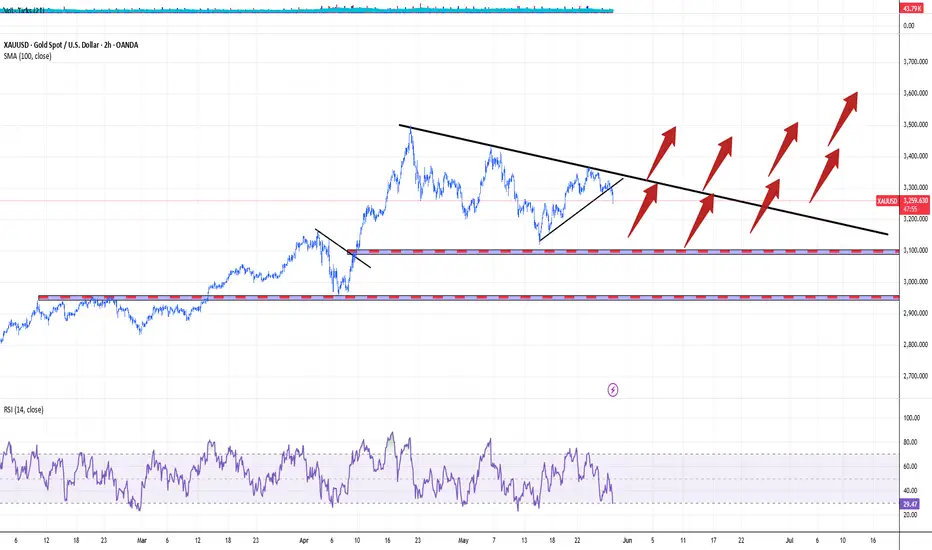
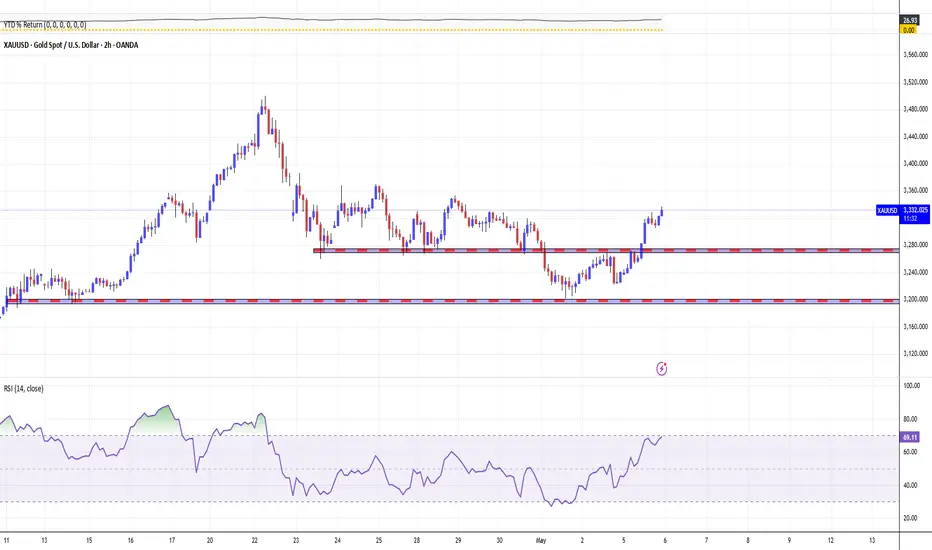
XAUUSD BULLISH SETUP. GOLD GOES 'PREPARING FOR SUMMER'Gold spot prices have experienced significant volatility and notable technical developments over the past several months. Since the start of 2025, gold surged by over 25%, reaching an all-time high of $3,500 per troy ounce in April before retracing to hover near $3,300 by late May.
This rally was fueled by persistent geopolitical tensions, particularly in the Middle East, and a weaker US dollar, which made gold more attractive to international buyers.
Technically, gold entered a parabolic upswing earlier in the year, becoming extremely overbought before breaking below its parabolic trend, signaling a potential top and the start of a corrective phase.
The Relative Strength Index (RSI) has recently dropped below 52, its lowest since February, reflecting weakening bullish momentum. The Average Directional Index (ADX) near 15 also indicates a lack of strong trend direction.
Key support levels are identified at $3,196 (55-day SMA), $3,120 (May low), and $3,031 (100-day SMA), while resistance sits at $3,350.
We are looking forward to further Gold accumulation, ahead of scorching hot summer months.
--
Best wishes,
@PandorraResearch Team 😎
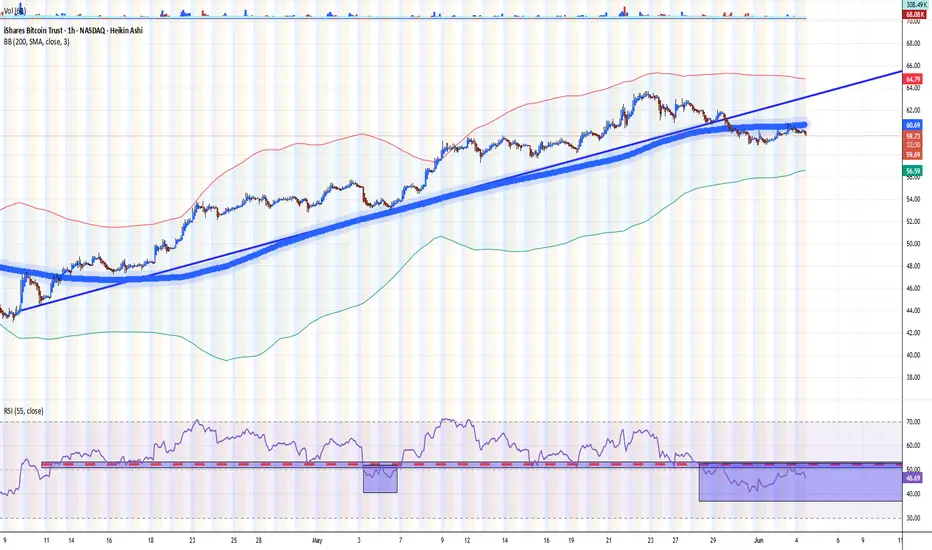
IBIT — Ishares Bitcoin Trust. Under Bearish PressureThe iShares Bitcoin Trust ETF (IBIT) has been a mixed performer year to date, with its price up and down around 20 percent this year and currently tracking for low double-digit returns in 2025.
The ETF currently trades around $59.36–$60.40, with assets under management of around $68 billion and a 0.1 percent premium to net asset value (NAV).
1-Hour Technical Outlook
On the 1-hour time frame, technical indicators are mixed but generally bearish:
Moving Averages: Short-term moving averages (e.g. 200-hour SMA/EMA) are currently signaling a Sell signal as the price moved below these averages in late May.
Support and resistance: The ETF faces resistance around $61, corresponding to the broken 200-hour SMA, and support around $54, with stronger volume-based support around $47, corresponding to the beginning of the April rally.
RSI indicator: Over the last 20 days, the RSI(55) indicator has already been briefly noted below the baseline of 50, highlighting the need for more active risk management, since, as we can see from the chart, the indicator has again moved into the risk zone in late May and early June (where it currently remains), accordingly, for a longer term.
Volatility: During the recovery period in April-May 2025, the ETF demonstrated moderate intraday volatility (with half the 200-hour sigma value (σ) of about 3.5 percent), while the 20-hour decline on May 22-23, which exceeded this value, has provided at that time clear arguments for more active risk management.
To summarize, we can say that NASDAQ:IBIT is experiencing a pullback, technical indicators point to local persistence of bearish sentiment, following the classic, empirically proven adage of the financial market "Sell in May - and Go away."
--
Best wishes,
@PandorraResearch Team
CHILE Stock Market Technical and Fundamental PerspectivesChile’s stock market is primarily represented by several key indices, each with distinct characteristics and coverage:
IGPA (Índice General de Precios de Acciones) BCS:SPCLXIGPA
The IGPA is the broadest and most representative index, covering the majority of stocks traded on the Santiago Stock Exchange. It is a capitalization-weighted index, revised annually, and includes companies across all major sectors of the Chilean economy. As of May 2025, the IGPA reached a historic high of over 42,000 points, reflecting robust market performance.
IPSA (Índice de Precios Selectivo de Acciones) BCS:SP_IPSA
The IPSA is a more focused index, comprising the 40 most heavily traded stocks on the Santiago Stock Exchange. It is revised quarterly and serves as the benchmark for large-cap Chilean equities.
S&P/CLX INTER Index 10 BCS:SPCLXIN10
This index tracks the 10 main Chilean stocks that also have American Depositary Receipts (ADRs) listed abroad, providing a bridge between local and international investors.
STOXX® Chile Total Market Index
This index aims to cover approximately 95% of Chile’s free-float market capitalization, with top components including major companies such as Falabella, Banco de Chile, LATAM Airlines Group, Cencosud, Banco Santander Chile, Empresas Copec, and Sociedad Química y Minera de Chile (SQM).
Key Components
The leading companies in Chile’s indices span various sectors:
Financials: Banco de Chile, Banco Santander Chile, Banco de Crédito e Inversiones
Retail: Falabella, Cencosud
Utilities/Energy: Enel Américas, Empresas Copec
Mining/Chemicals: Sociedad Química y Minera de Chile (SQM)
Forestry/Paper: Empresas CMPC
Airlines: LATAM Airlines Group
Long-Term Technical Perspective and Recent Trends
The Chilean stock market, as reflected by the IGPA and IPSA, has experienced a strong rally in 2025, with the major indices gaining over 25% year-to-date
The MSCI Chile index currently presents a mixed technical picture. While long-term moving averages (200-day) signal a "buy," shorter-term indicators (5-100 day) are on "sell," and several oscillators (RSI, Stochastic, MACD) indicate oversold conditions or continued selling pressure.
This suggests that, despite the recent rally, some short-term consolidation or correction could occur, but the long-term trend remains constructive.
Fundamental breakdown
The Santiago Stock Exchange’s market capitalization stands at approximately $187 billion, with a price-to-earnings (P/E) ratio of 12.08, which is below both the emerging markets average (14.3) and the global average (22.12).
This relatively low valuation, even after a significant rally, suggests Chilean equities remain attractive on a fundamental basis.
The Chilean economy is projected to grow by 2.3% in 2025. Inflation has moderated to 4.5%, and the central bank’s benchmark interest rate is stable at 5%.
The banking sector is particularly robust, with Banco de Chile reporting a 14.2% year-over-year increase in net income for Q1 2025.
The mining sector, especially lithium, is poised for growth following major investments and Chile’s strategic push to regain global leadership in lithium production.
The combination of strong fundamentals, sectoral diversity, and attractive valuations positions Chile’s stock market for steady long-term growth, though short-term volatility is possible as global and local conditions evolve.
Conclusion
Chile’s stock market demonstrates strong long-term potential, underpinned by solid economic fundamentals, sectoral strengths, and attractive valuations, though investors should remain mindful of cyclical corrections and global market influences.
Thу main technical chart for CBOE:ECH - iShares MSCI Chile ETF (total return) points on massive 200-months SMA breakthrough, attempts to break long term 'descending top/ flat bottom' technical figure.
--
Best wishes,
@PandorraResearch Team 😎

GOLD Regains Above 3'300, since US stocks "Relief Rally" is OverGold prices recently surged above $3,300 per ounce due to a confluence of geopolitical, economic, and monetary factors driving strong safe-haven demand:
Heightened geopolitical tensions, particularly the Israel-Hamas conflict and ongoing US-China trade disputes, have increased uncertainty, prompting investors to seek Gold as a secure store of value amid instability.
The US dollar's weakness, nearing a three-year low, has further boosted gold's appeal for holders of other currencies, making Gold relatively cheaper and more attractive globally.
What is most important also, U.S. stock rally has overed recently its tedious 10-Day winning strike (fortunately which finished not at all the history peaks). That's why investors may be turning back to tried-and-true assets like Gold.
Central banks, notably China’s, have been consistently buying gold to diversify reserves away from the US dollar, supporting prices significantly. China increased its Gold reserves for the 17th consecutive month, signaling sustained institutional demand.
Additionally, gold-backed exchange-traded funds (ETFs) have seen record inflows, reflecting growing investor interest beyond traditional buyers.
Market expectations of Federal Reserve interest rate cuts later in 2025 have also played a key role. Lower interest rates reduce the opportunity cost of holding non-yielding gold, enhancing its investment appeal amid inflation concerns and economic growth uncertainties.
This combination of geopolitical risk, a weaker dollar, central bank purchases, and anticipated monetary easing has propelled gold prices to historic highs, with forecasts suggesting further gains toward $3,500 per ounce.
--
Best #GODL wishes,
@PandorraResearch Team 😎
The Walt Disney Stock Future Goes 'Shining Bright as Never'The Walt Disney Company’s stock (DIS) has demonstrated robust performance following its Q2 2025 earnings release a week ago, with both fundamental and technical indicators reflecting positive momentum.
Here’s a detailed analysis:
Fundamental Perspective
Disney’s Q2 2025 results exceeded expectations, driven by strong execution across its entertainment, streaming, and experiences segments. Key financial highlights include:
Revenue Growth. Revenues rose 7% year-over-year (YoY) to $23.6 billion, surpassing estimates of $23.14 billion.
Profitability Surge. Adjusted EPS jumped 20% YoY to $1.45, beating forecasts of $1.20. Net income swung to $3.3 billion from a $20 million loss in Q2 2024.
Streaming Strength. Disney+ added 1.4 million subscribers (reaching 126 million globally), defying expectations of a decline. Combined Disney+ and Hulu streaming operations generated $336 million in profit, a sevenfold increase from $47 million YoY.
Guidance Upgrade. Disney raised its fiscal 2025 adjusted EPS forecast to $5.75 (up 16% YoY), citing confidence in double-digit operating income growth for entertainment and sports, and 6%-8% growth for experiences.
Growth Drivers:
Entertainment. Segment operating income rose $0.5 billion YoY to $1.3 billion, fueled by streaming profitability and box office success (e.g., Moana 2).
Experiences. Theme parks and consumer products saw higher attendance, guest spending, and cruise demand, though international parks faced headwinds in Shanghai and Hong Kong.
Strategic Initiatives. The upcoming Abu Dhabi theme park and ESPN’s direct-to-consumer launch are expected to drive long-term growth.
Technical Perspective
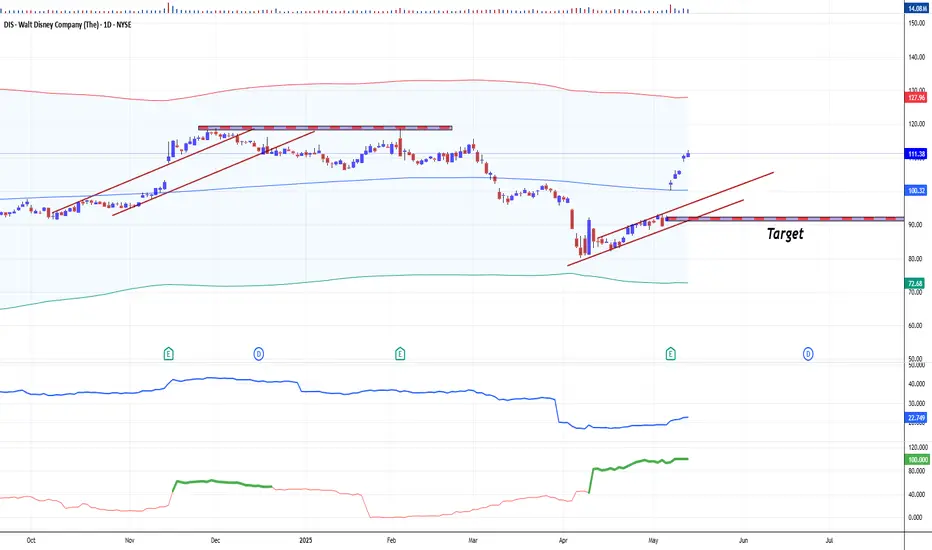
Disney’s stock firstly reacted positive to the earnings beat, reflecting renewed investor confidence:
Price Action. Shares surged 10-12% post-earnings, hitting an intraday high of $103.31. Over the past month, DIS gained 31%, including a 20% rally in five days.
Valuation. The stock trades at 18.4x forward earnings and 2.1x sales, a premium to industry averages but below its historical norms.
Analyst Sentiment. The average price target stands at $126.50 (14% upside), with a Street-high target of $148 (33% upside).
Technical Indicators:
Momentum. The breakout above key resistance levels (e.g., $100) signals bullish sentiment, supported by high trading volume.
Volatility. Beta of 1.01 aligns with market volatility, while short interest remains low at 1.24% of float.
Risks and Considerations
Macroeconomic Uncertainty. Disney acknowledged potential impacts from tariffs and global economic conditions.
Valuation Premium. While growth prospects justify some premium, prolonged macroeconomic stress could pressure multiples.
Investors challenge
Disney’s Q2 2025 results underscore its ability to execute on streaming monetization, theme park innovation, and content-driven growth.
Fundamentally, raised guidance and streaming profitability signal a turnaround, while technically, the stock’s breakout suggests locally bullish momentum.
Following historical patterns we are Bearishly tuned at this time, with targets to fill the gap at $92.17 per share (left after Earnings report), and drilling all the way below.
--
Best wishes,
@PandorraResearch Team
Crypto Markets: “Sell in May, and Go Away” — What Does It MeanThe historical pattern known as the “Sell in May, and Go Away” seasonal divergence was popularized by the Stock Trader’s Almanac, which stated that investing in stocks represented by the Dow Jones Industrial Average from November to April and switching to fixed income for the other six months “has delivered reliable returns with reduced risk since 1950.”
What is “Sell in May, and Go Away”?
“Sell in May, and Go Away” is a well-known saying in finance. It is based on the historical underperformance of stocks over the six-month period from May to October.
According to Fidelity Investments, the divergence has been most pronounced in recent years, with the S&P 500 (SPX) gaining an average of about 2% from May to October from 1990 onwards over the next 30 years, compared with an average of about 7% from November to April.
The Halloween Indicator, 'Sell in May and Go Away': Everywhere and All the Time*, a research paper examining stock markets outside the US, found the same pattern, calling the seasonal divergence trend "surprisingly resilient."
Key Takeaways
👉 "Sell in May and go away" is a saying that refers to the historically weaker performance of financial markets from May to October compared to the other half of the year.
👉 Investors can try to capitalize on this pattern by switching to less risky assets from May to October, based on historical data.
Seasonality in investment flows may persist as a result of year-end bonuses from the financial industry and businesses, perhaps helped by the mid-April deadline for filing U.S. income tax returns.
Whatever the underlying fundamentals, the historical pattern was made more pronounced by the October stock market crashes of 1987 and 2008.
Final Points
👉 The problem with historical patterns is that they do not reliably predict the future. This is especially true for well-known historical patterns. If enough people became convinced that the “Sell in May and Walk Away” pattern would persist, it would essentially begin to disappear immediately. All the early sellers would try to sell in April and bid against each other to buy back the assets before everyone else in October.
👉 At the same time, certain considerations regarding the development of geopolitical events in the period from May to October 2025 reasonably give reason to think about the prospects of such a scenario for the next 6 months.
* The Halloween Indicator, 'Sell in May and Go Away': Everywhere and All the Time
>> Ben Jacobsen Tilburg University - TIAS School for Business and Society; Massey University
>> Cherry Yi Zhang. Nottingham University Business School China; Massey University - School of Economics and Finance.
--
Best wishes,
@PandorraResearch Team 😎

Canadian Dollar vs US Dollar: Recovering from The Bearish HugsIn previous posts, we have already begun to look at the key factors that have driven the U.S. outperformance over the past decade.
The U.S. market dominance is largely due to the rapid rise of tech giants (such as Apple, Microsoft, Amazon, and Alphabet), which have benefited from strong profit growth, global market reach, and significant investor inflows.
Underperforming Internationally
Markets outside the U.S. have faced challenges such as multiple stifling sanctions and tariffs, slowing economic growth, political uncertainty (especially in Europe), a stronger U.S. dollar, and the decline of high-growth tech sectors.
The Valuation Gap
By 2025, U.S. equities will be considered relatively expensive compared to their international peers, which may offer more attractive valuations in the future.
Recent Shifts (2025 Trend)
Since early 2025, international equities have begun to outperform the S&P 500, and European and Asian equities have regained investor interest. Global market currencies are also heavily dependent on the US dollar.
Factors include optimism around the following three main themes.
DE-DOLLARIZATION. DE-AMERICANIZATION. DIVERSIFICATION.
De-dollarization is the process by which countries reduce their reliance on the US dollar (USD) as the dominant global reserve currency, medium of exchange, and unit of account in international trade and finance. This trend involves a shift away from the centrality of the US dollar in global economic transactions and towards alternative currencies, assets or financial systems.
Reasons for De-dollarization
The move towards de-dollarization is driven by geopolitical and economic factors:
Backlash against US economic hegemony: The US often uses the dollar's dominance to impose sanctions and exert political pressure, encouraging countries to seek financial sovereignty.
Rise of emerging economic powers: Emerging economies such as China and groups such as the BRICS are seeking to reduce their vulnerability to US influence and promote regional integration and alternative financial infrastructures.
Geopolitical tensions: Conflicts such as the war in Ukraine have increased efforts by countries such as Russia to withdraw dollars from their reserves to avoid sanctions.
Summary
De-dollarization is a complex, ongoing process that reflects a gradual shift away from the global dominance of the US dollar. It involves diversifying reserves, using alternative currencies and assets, and creating new financial systems to reduce reliance on the dollar.
Driven by geopolitical tensions and the rise of emerging economic powers, de-dollarization is challenging the entrenched role of the dollar, but is unlikely to completely replace it anytime soon.
Instead, it is leading to a more multi-polar monetary system in international finance, increasing demand for alternative investments in the US.
Technical Test
The main technical chart is presented in a weekly perspective, reflecting the performance of the Canadian dollar against the US dollar FX_IDC:CADUSD over the long term.
With the positive dynamics of the relative strength indicator RSI(14) continuing, a breakout of flat resistance near the level of 0.72 is noted, with the prospect of a possible price increase to 0.80, parity in the currency pair and strengthening of the Canadian dollar to historical maximums, in the horizon of the next five years.
--
Best wishes,
@PandorraResearch Team 😎

Bull in a China Shop. The S&P 500 Index After 100 Days of TrumpPresident Donald Trump's first 100 days in office were the worst for the stock market in any postwar four-year U.S. presidential cycle since the 1970s.
The S&P 500's 7.9% drop from Trump's inauguration on Jan. 20 to the close on April 25 is the second-worst first 100 days since President Richard Nixon's second term.
Nixon, after taking office as President of the United States (for the second time) on January 20, 1973, witnessed the S&P 500 index fall by 9.9% in his first 100 days in office, due to the unsuccessful economic measures he took to combat inflation, which led to the recession of 1973-1975 when the S&P 500 index losses of nearly to 50 percent.
It all started in January 1973 in the best soap opera traditions of Wall Street, at the historical peaks of the S&P 500 index..
..But less than two years later it quickly grew into a Western with a good dose of Horror, because the scenario of a 2-fold reduction of the S&P 500 index was unheard those times for financial tycoons and ordinary onlookers on the street, since the Great Depression of the 1930s, that is, for the entire post-war time span since World War II ended, or almost for forty years.
Nixon later resigned in 1974 amid the Watergate scandal.
On average, the S&P 500 rises 2.1% in the first 100 days of any president's term, according to CFRA, based on data from election years 1944 through 2020.
The severity of the stock market slide early in Trump's presidency stands in stark contrast to the initial "The Future is Bright as Never" euphoria following his election victory in November, when the S&P 500 jumped to all-time highs on the belief that Mr. Trump would shake off the clouds, end the war in Ukraine overnight, and deliver long-awaited tax cuts and deregulation.
Growth slowed and then, alas, plummeted as Trump used his first days in office to push other campaign promises that investors took less seriously, notably an aggressive approach to trade that many fear will fuel inflation and push the U.S. into recession.
The S&P 500 fell sharply in April, losing 10% in just two days and briefly entering a bear market after Trump announced “reciprocal” tariffs, amid a national emergency that gave him free rein to push through tariffs without congressional oversight.
Then Trump began yanking the tariff switch back and forth, reversing part of that tariff decision and giving countries a 90-day window to renegotiate, calming some investor fears.
Many fear more downside is ahead.
Everyone is looking for a bottom. But it could just be a bear market rally, a short-term bounce of sorts.
And it's not certain that we're out of the woods yet, given the lack of clarity and ongoing uncertainty in Washington.
Time will tell only...
--
Best 'China shop' wishes,
@PandorraResearch Team

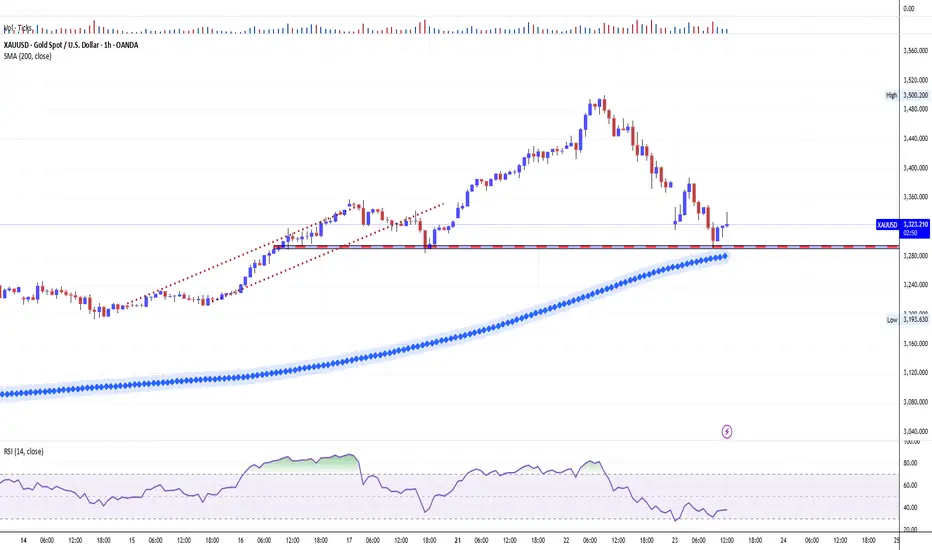
GOLD Follows "Buy The Dip" Mode, Being Supported by 200-hour SMAGold prices have experienced significant volatility over the last days, with conflicting reports on the current trend. According to some sources, gold prices have increased, with spot gold reaching $3,500 per troy ounce, new all the history high on Tuesday, April 22, 2025.
The $3,500 milestone has sparked increased interest from investors and market analysts, meaning that Gold spot doubled in price over the past 5 years, 3rd time in history ever.
Despite the short-term volatility, gold has shown a strong performance since the beginning of 2025, with an increase of approximately 30-35% year-to-date. Market analysts remain bullish on gold, with some forecasting prices to reach $ 4'000 per ounce in the near term.
The main 1-hour graph indicates on 200-hours SMA technical support, with further upside opportunity due to forming on the chart descending triangle (flat bottom/ descending top) breakthrow.
--
Best #GODL wishes,
Your Beloved @PandorraResearch Team 😎

GOLD Goes "Buy The Dip", Following 200-hour SMA Major SupportGold prices have experienced significant volatility over the last days, with conflicting reports on the current trend. According to some sources, gold prices have increased, with spot gold reaching $3,500 per troy ounce, new all the history high on Tuesday, April 22, 2025.
The $3,500 milestone has sparked increased interest from investors and market analysts, meaning that Gold spot doubled in price over the past 5 years, 3rd time in history ever.
Despite the short-term volatility, gold has shown a strong performance since the beginning of 2025, with an increase of approximately 30-35% year-to-date. Market analysts remain bullish on gold, with some forecasting prices to reach $ 4'000 per ounce in the near term.
The main 1-hour Gold spot OANDA:XAUUSD graph indicates on 200-hours SMA technical support, with further upside opportunity due to forming on the chart descending triangle (flat bottom/ descending top) breakthrow.
--
Best #GODL wishes,
💖 Your Beloved @PandorraResearch Team
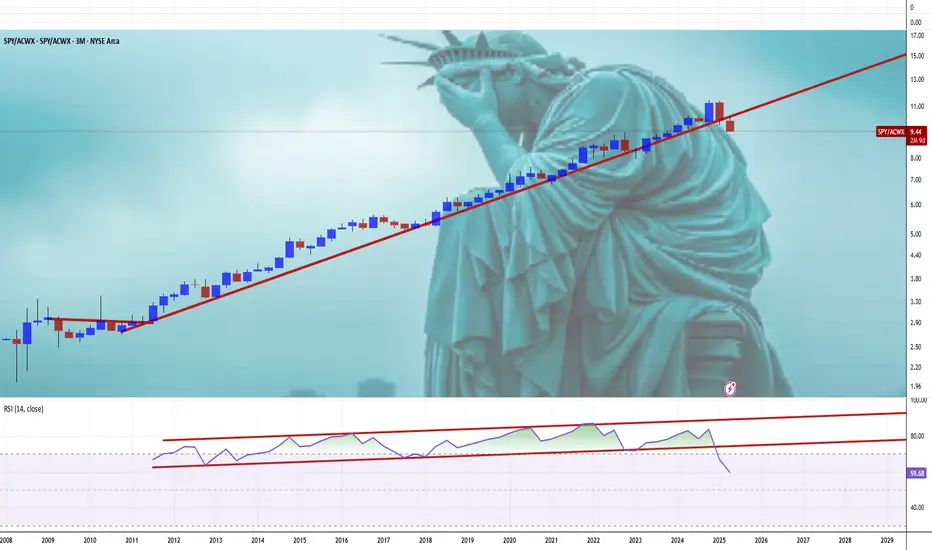
Tears of Liberty. Lets Make America Sell Again.Over the past decade, the U.S. stock market has significantly outperformed global stock markets excluding the United States. This divergence in returns has been one of the defining features of global investing since 2015, with U.S. equities—especially large-cap technology stocks—driving much of the outperformance.
Annualized Returns (2015–2025)
AMEX:SPY , S&P 500 Index(U.S.):
The S&P 500 delivered an average annualized return of 13.8% over the past ten years.
NASDAQ:ACWX , MSCI All World ex U.S. (Rest of World):
Global stocks outside the U.S. returned an average of 4.9% annually over the same period
Year-by-Year Breakdown
Year | SPX | World ex U.S. | U.S. Surplus
2024 23.9% 4.7% +19.2%
2023 23.8% 17.9% +5.8%
2022 -19.6% -14.3% -5.4% (!)
2021 26.6% 12.6% +14.0%
2020 15.8% 7.6% +8.2%
2019 30.4% 22.5% +7.9%
2018 -6.6% -14.1% +7.5%
2017 18.7% 24.2% -5.5% (!)
2016 9.8% 2.7% +7.1%
2015 -0.7% -3.0% +2.3%
Key Drivers of Performance
U.S. Outperformance
The U.S. market’s dominance was driven largely by the rapid growth of technology giants (such as Apple, Microsoft, Amazon, and Alphabet), which benefited from strong earnings growth, global market reach, and significant investor inflows.
International Underperformance
Non-U.S. markets faced headwinds such as multiply choking sanctions and tariffs, slower economic growth, political uncertainty (notably in Europe), a stronger U.S. dollar, and less exposure to high-growth technology sectors.
Valuation Gap
By 2025, U.S. stocks are considered relatively expensive compared to their international counterparts, which may offer more attractive valuations going forward.
Recent Shifts (2025 Trend):
As of early 2025, international stocks have started to outperform the S&P 500, with European and Asian equities seeing renewed investor interest. Factors include optimism over economic recovery in China and strong performance in European defense and technology sectors.
Long-Term Perspective
Historical Context
While the past decade favored U.S. equities, this has not always been the case. For example, during the 2000s, international stocks outperformed the U.S. following the dot-com bust.
Market Weight
The U.S. accounts for roughly 60% of global stock market capitalization and about 25% of global GDP, so its performance has a substantial impact on global indices.
Conclusion
From 2015 to 2025, the U.S. stock market delivered nearly triple the annualized returns of global markets excluding the U.S., primarily due to the outperformance of large-cap technology stocks.
While this trend has persisted for most of the decade, early 2025 shows signs of a potential shift, with international equities beginning to close the performance gap. Investors should remain aware of valuation differences and the cyclical nature of global market leadership.
The main technical chart for U.S./ ex U.S. ratio indicates the epic reversal is in progress.