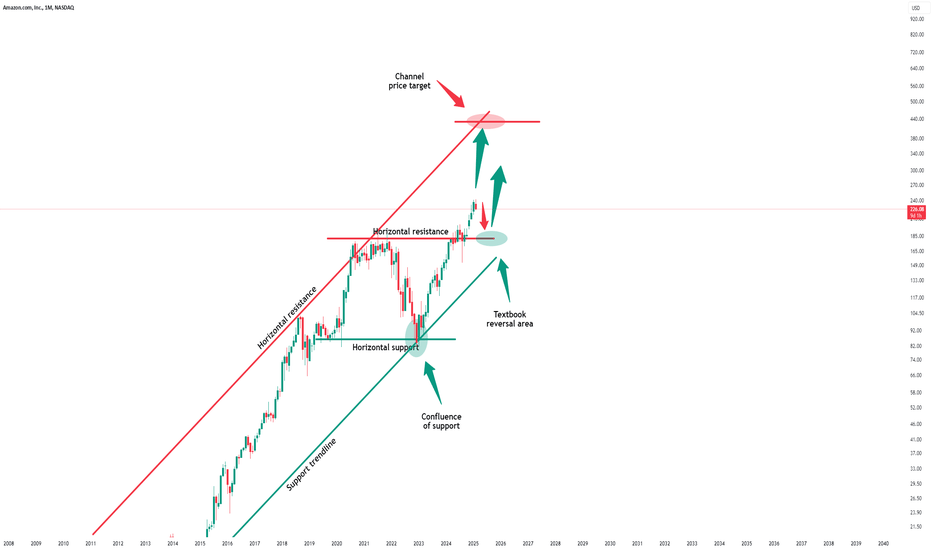
Amazon - Catch The Parabolic Rally Now!Amazon ( NASDAQ:AMZN ) will start the parabolic rally:
Click chart above to see the detailed analysis👆🏻
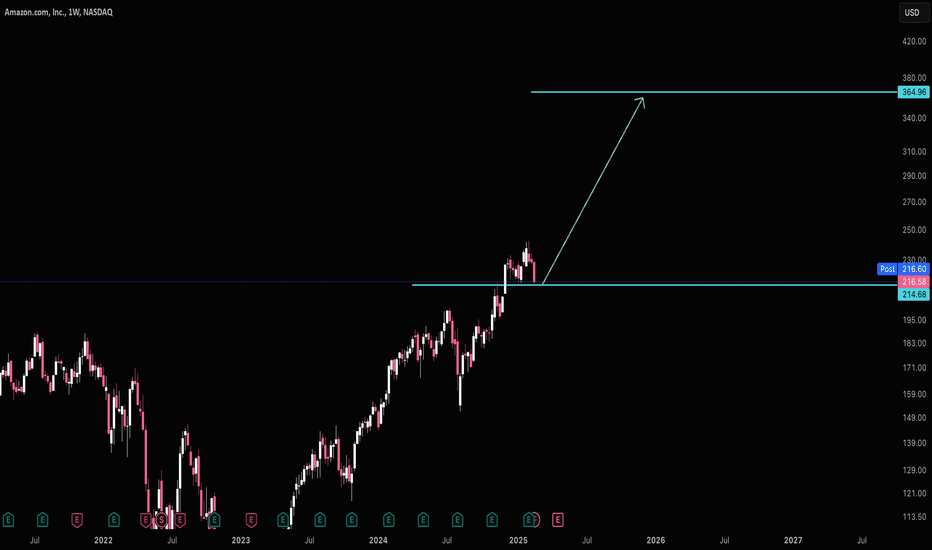
Just a couple of months ago, we finally saw the expected all time high breakout on Amazon. Following the overall governing rising channel pattern, I simply do expect the acceleration of the current rally, the creation of a parabolic rally, but maybe we will see a bullish retest first.
Levels to watch: $180, $400
Keep your long term vision,
Philip (BasicTrading)
AMZN
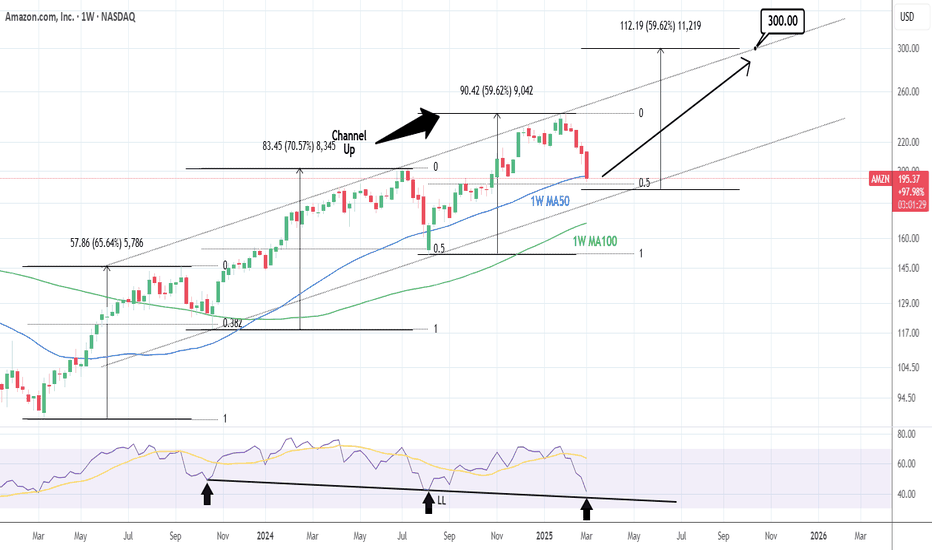
AMAZON: Oversold on 1D. Massive buy opportunity.Amazon is oversold on its 1D technical outlook (RSI = 27.320, MACD = -7.090, ADX = 63.698) and this is best displayed on the 1W timeframe where the price hit this week its 1W MA50 for the first time in 7 months. The decline since the January top is technically the bearish wave of Amazon's 2 year Channel Up. The previous HL was priced on the 0.5 Fibonacci level and the one before on the 0.382. We are now just over the 0.5 Fib again, while the 1W RSI is about to hit its LL trendline. All those form massive support levels for the stock, which translate into the best buy opportunity since the early August 2024 bottom. We are expecting a similar +59.62 bullish wave to begin. The trade is long, TP = 300.
## If you like our free content follow our profile to get more daily ideas. ##
## Comments and likes are greatly appreciated. ##
+405% day from $0.35 to $1.77 for $PSTV WOW 🔥 +405% from $0.35 to $1.75 NASDAQ:PSTV 🚀 What market sell off 🤷🏻♂️ we don't know anything about that, our strategy is getting us paid no matter the overall market circumstances 💪 It's been like this for over a decade
P.S. AMEX:SPY is at 200 moving average, if it cracks below it we could see NASDAQ:TSLA NASDAQ:NVDA NASDAQ:AMZN NASDAQ:GOOG NASDAQ:META and many others go way lower.
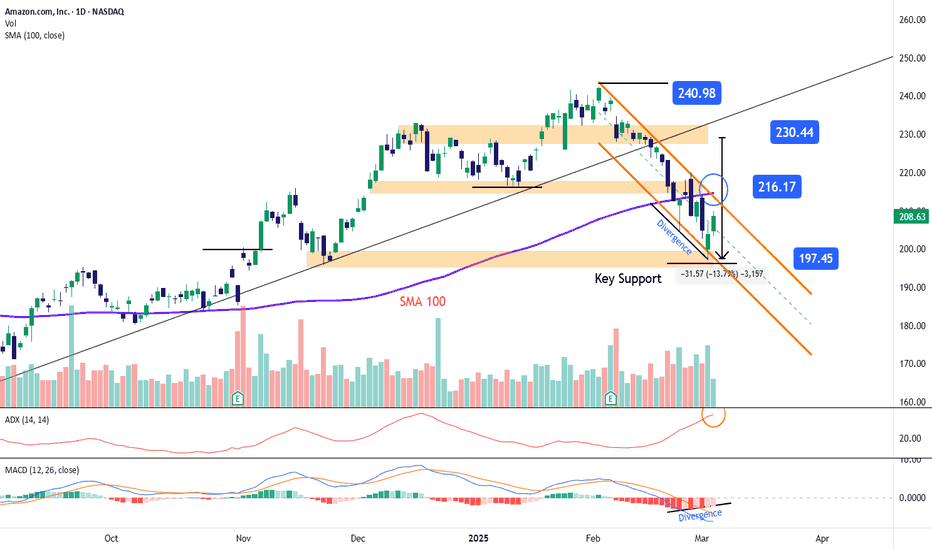
Amazon Stock Trapped in a Bearish ChannelOver the past two weeks, Amazon's stock has declined by more than 13% , forming a new bearish channel. Selling pressure has intensified as concerns about potential tariffs begin to affect investor confidence in Amazon's multinational operations. The possible onset of a new trade war could seriously impact some of Amazon’s business model, which relies on importing products from other countries into the United States. This could eventually reduce demand and continue to reinforce the bearish bias in stock movements.
Bearish Channel
Since late February, shortly after the earnings report, Amazon's stock has entered a clear short-term bearish channel, reaching a low of $197 per share. Currently, a minor bullish correction is emerging, approaching the upper boundary of the bearish channel. However, as long as bullish momentum fails to break this upper level, it is likely that the channel will remain the dominant formation, maintaining downward pressure on the stock.
ADX Indicator
The ADX line continues to rise above the neutral level of 20, reaching levels not seen since December 2024. This reflects the momentum of current price movements and the increase in volatility affecting the stock. If the ADX line remains elevated, volatility could either support or challenge the current trend, depending on market dynamics.
MACD Indicator
Lower lows in price movements and higher lows in the MACD histogram have formed a divergence between the indicator and price movements. This imbalance of forces could signal the continuation of short-term bullish corrections.
Key Levels:
$230: Major resistance. This level corresponds to the highest price zone recorded in December 2024. If the stock returns to this level, it could reactivate a previously forgotten uptrend.
$216: Current key resistance. This level aligns with the upper boundary of the bearish channel and the 100-period simple moving average. Sustained buying pressure above this level could put the bearish channel at risk.
$197: Near-term support. This level corresponds to November 2024 lows. If the stock breaks below this support, it could lead to new lows on the chart, reinforcing the ongoing downtrend.
By Julian Pineda, CFA – Market Analyst
AMZN to snap back
Hi
I am very encouraged by my PLTR trade idea to test 116, 121 in my previous post. They certainly do respect the Fib Extension levels.
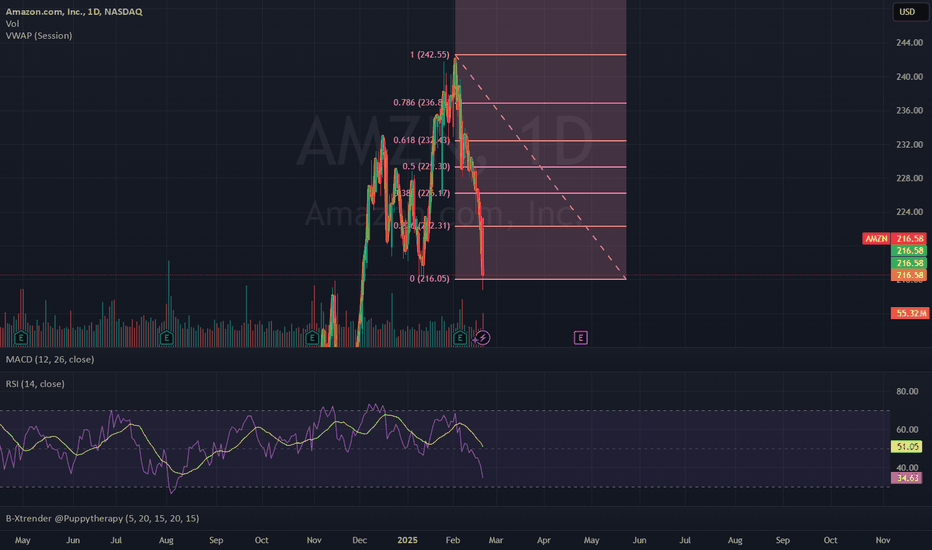
This time, I am applying Fib Retracement to AMZN, which I think will bounce back to 0.28 (222) , 0.38 (226) and even 0.5 (229) , from it current levels of 216.
Secondly if you observe the daily charts, everytime RSI dips below 30, it's a buying opportunity.
(Do note: there are a couple of times when RSI double dipped to present a buying opportunity.)
All the best!!!!
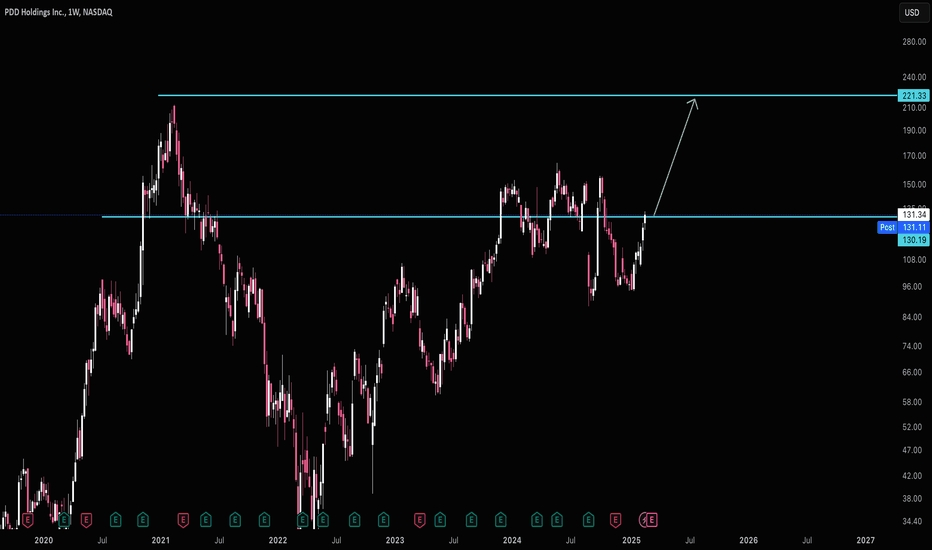
Pinduoduo $220PDD has a lot of potential to rise to $220 and above. China has been battered and this stock trades with a 12 PE ratio. That's about as cheap of a stock with revenue growth like this you're going to find.
The CSI 300 index has finished it's 2022 correction and is in a uptrend likely supporting PDD rising.
Good luck!
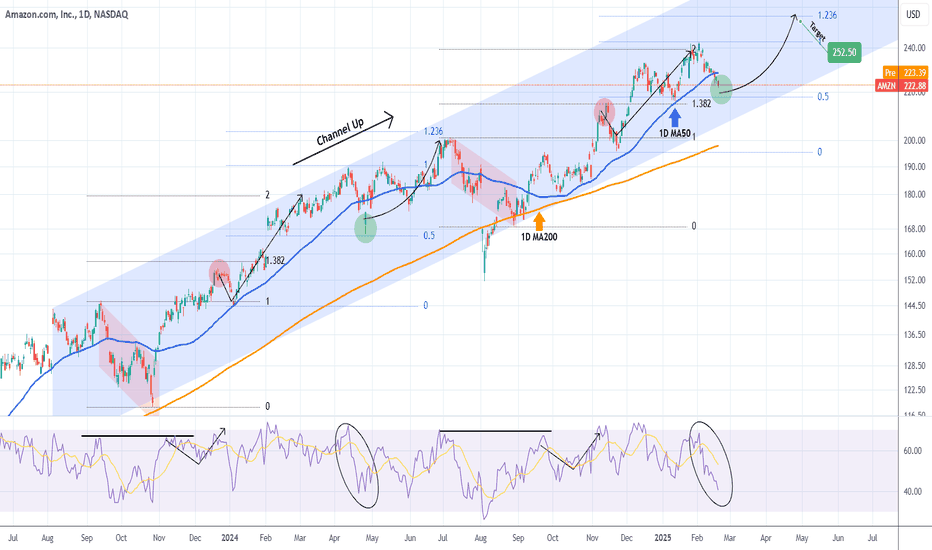
AMAZON Excellent buy opportunity for a new ATH.Last time we looked at Amazon Inc. (AMZN) was three months ago (November 13 2024, see chart below), giving a pull-back buy signal:
The price action couldn't have followed this more accurately as after a short-term pull-back, the stock hit our $240.00 Target at the end of January.
Since then the price started to pull-back again to a point where this week it broke below its 1D MA50 (blue trend-line) for the first time since September 11 2024. With the 1D RSI on the 40.00 mark, this pull-back resembles the April 25 2024 Low, made near the 0.5 Fibonacci retracement level.
We expect a similar medium-term rebound to start towards the 1.236 Fibonacci extension. Our Target is marginally below it at $252.50.
-------------------------------------------------------------------------------
** Please LIKE 👍, FOLLOW ✅, SHARE 🙌 and COMMENT ✍ if you enjoy this idea! Also share your ideas and charts in the comments section below! This is best way to keep it relevant, support us, keep the content here free and allow the idea to reach as many people as possible. **
-------------------------------------------------------------------------------
💸💸💸💸💸💸
👇 👇 👇 👇 👇 👇
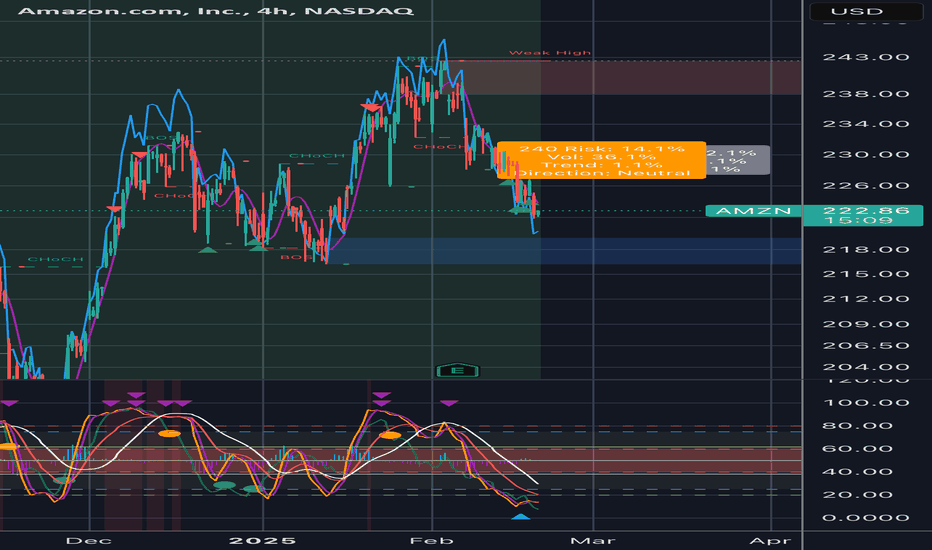
Amazon is about seem summer growth shoots againWhy? Because my crystal TA balls say so.
Seriously though, here is my reasoning, given the indicator momentum
Price Action & Trend Analysis
• The stock is currently at $222.42, down -1.86%.
• The price recently broke down from a local high near $244 and is in a downtrend.
• Break of Structure (BoS) and Change of Character (CHoCH) labels indicate trend shifts.
• A weak resistance zone around $244 suggests prior buying exhaustion.
• A demand/support zone appears near $218, with previous price reactions in this range.
Momentum Indicators (Lower Panel)
• The stochastic-based oscillator in the lower panel shows oversold conditions (~below 20 level).
• Previous rebounds occurred at similar oversold levels, suggesting a potential bounce.
• Multiple purple downward arrows (sell pressure) have recently printed, aligning with declining momentum.
Short-Term Outlook (Next Few Days)
• Bullish Case: If support at $218-$220 holds, a relief bounce could push prices towards $226-$230 (~50% retracement of the drop).
• Bearish Case: A break below $218 could accelerate downside momentum towards $210-$212.
Now - let’s talk Probabilities:
• Bounce towards $226-$230: ~60% if support holds. This is the more prevailing wind in my view.
• Further drop to $210-$212: ~40% if selling is strong.
Summary & Trading Plan
• Short-term traders: Watch $218-$220 support for a bounce trade to $226-$230.
• Swing traders: A breakout above $230 strengthens a bullish case towards $240+.
• Risk Management: A clear break below $218 suggests a potential breakdown towards $210-$212.
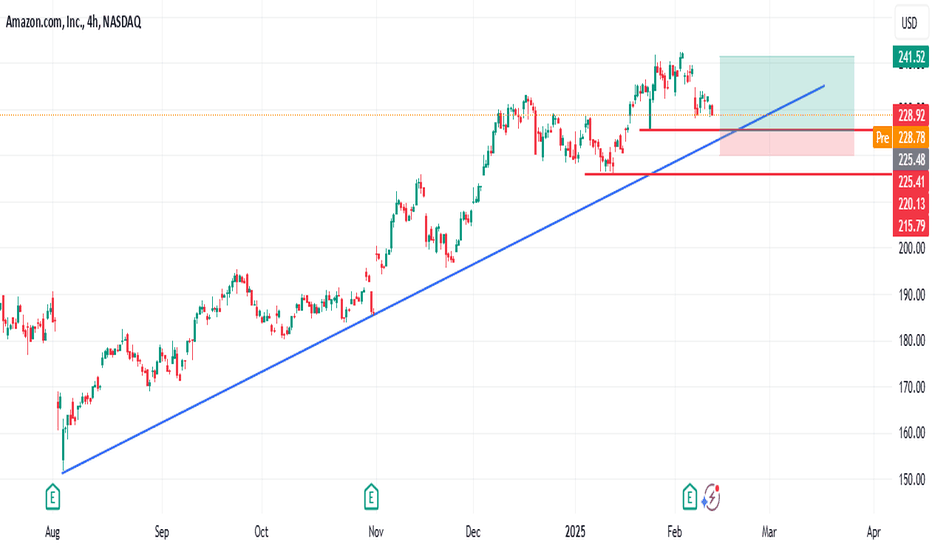
Amazon (AMZN) Stock Analysis & ForecastAmazon (AMZN) Stock Analysis & Forecast
The U.S. stock market has experienced a notable downturn recently, and Amazon (NASDAQ: AMZN) is no exception. Currently trading at $228, I am closely monitoring the stock for a potential pullback to $220, where I plan to enter.
Entry Strategy
My entry point of $220 is based on a confluence of key technical levels:
An ascending trendline indicating ongoing bullish momentum.
A horizontal support level, reinforcing this area as a strong demand zone.
Target & Exit Strategy
If fundamental catalysts align in my favor, my price target (TP) will be the all-time high (ATH) zone around $240, with the potential to extend beyond.
As always, risk management remains a priority—trade cautiously and adapt to market conditions.
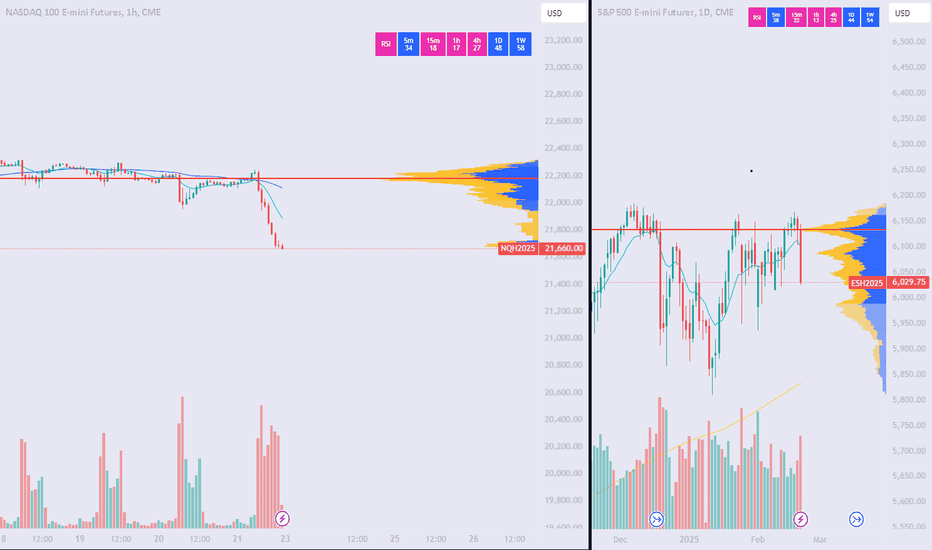
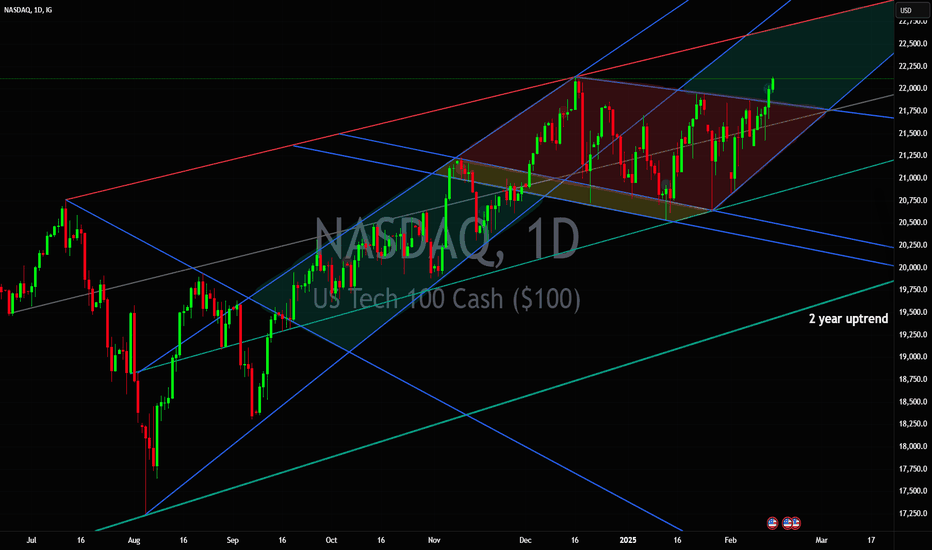
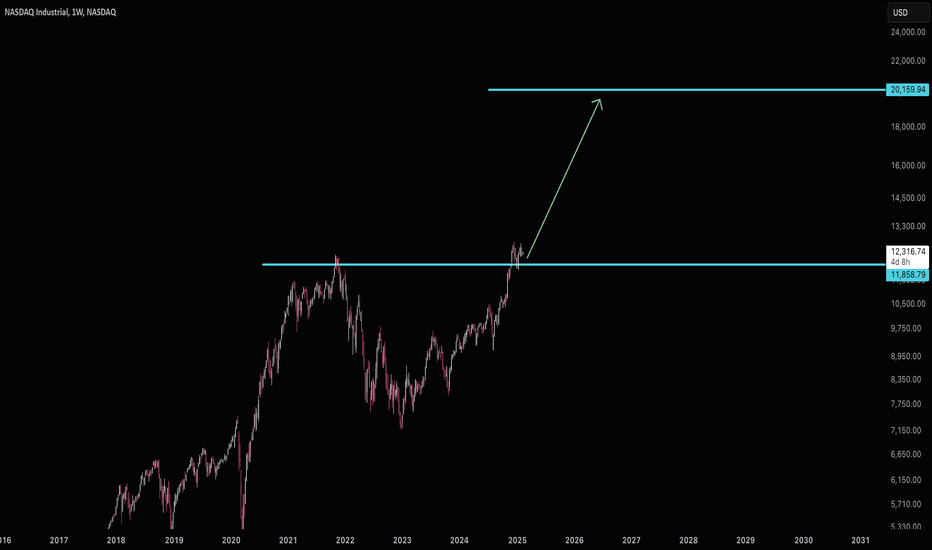
New highs area +$1,000/share unlocked for NasdaqSeems like 2 months of sideways downtrending (since mid December) is over for Nasdaq.
Unless any surprise political shock news come out (we all know that can be a challenge with Trump) we could see Nasdaq reach $23,000 per share area in drawn upcoming green period.
This would also reflect directly on upward momentum for several bluechip stocks:
Apple Inc. NASDAQ:AAPL
Microsoft Corporation NASDAQ:MSFT
Amazon.com Inc. NASDAQ:AMZN
Alphabet Inc. NASDAQ:GOOGL
Meta Platforms Inc. NASDAQ:META
NVIDIA Corporation NASDAQ:NVDA
Tesla Inc. NASDAQ:TSLA
Intel Corporation NASDAQ:INTC
Amazon’s Short-Term Outlook: Navigating Key Support LevelsAmazon remains a market powerhouse, yet its stock is no stranger to short-term fluctuations.
Support levels are indicated on chart. A move below these levels could trigger deeper short-term weakness, whereas a bounce off these supports would underscore Amazon’s robust fundamentals. As always, such volatility is typical in dynamic, high-growth stocks, and traders should watch these key levels closely when planning their next move.
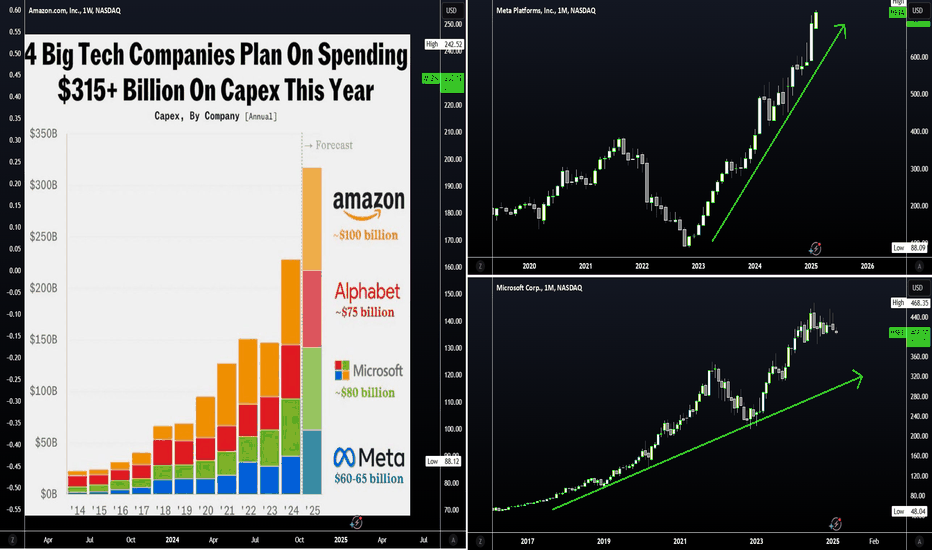
STOCKS | AI | Amazon, Meta & MSFTPeople who are saying that AI is just a bubble are missing the big picture. Huge tech companies are pouring serious money into it, which shows they believe AI is here to stay.
We're talking massive investments – like over $320 billion in AI infrastructure by 2025, according to the Financial Times. Amazon is planning over $100 billion in capital expenditures in 2025, mainly focused on AI infrastructure. This could be huge not only for NASDAQ:AMZN as a whole but also for the AI industry.
Alphabet is also throwing in around $75 billion this year to boost its AI capabilities. These kinds of investments from the top players make it clear: they know you have to spend big to win in the AI game and clearly there is a race going on, especially after the release of DeepSeekAI. American companies don't want to be left behind, and it's likely that they will pour money into integrating AI to improve their business operation - with the ultimate aim to improve profit - which is great for stock prices. How they make money from AI might change over time, but the overall direction is obvious – AI is changing everything and driving innovation.
According to Statista, the global AI market is predicted to reach around $826 billion by 2030. That kind of growth tells you AI is going to be a major force in just about every industry. And therefore I believe that all the companies making major investment in AI will also see exponential growth over the next 5 years - meaning it may be a longer term game play.
_______________
NASDAQ:MSFT NASDAQ:META
Amazon (AMZN) Shares Retreat from All-Time HighAmazon (AMZN) Shares Retreat from All-Time High After Earnings Report
As shown in the Amazon (AMZN) stock chart, the price reached an all-time high of around $242 per share on 4 February. However, following the earnings report on 6 December, AMZN shares declined despite the company exceeding analysts' expectations:
→ Earnings per share: Actual = $1.86, Forecast = $1.48
→ Revenue: Actual = $187.8bn, Forecast = $187.3bn
Investor disappointment may have stemmed from:
→ Signs of slowing cloud business growth. Amazon, a pioneer in public cloud services with Amazon Web Services (AWS), now reports annual cloud revenue growth of around 20%, down from over 50% five years ago.
→ Soaring capital expenditure on AI data centres with uncertain profitability prospects. Amazon has projected approximately $105bn in capital spending for 2025, up 27% from 2024 and 57% from 2023.
Technical Analysis of Amazon (AMZN) Stock
AMZN remains within an upward trend, indicated by the blue channel on the chart. However, bullish momentum appears vulnerable as:
→ The price struggles to reach the upper boundary of the channel.
→ A bearish "head and shoulders" (SHS) pattern is visible on the chart.
→ A bearish gap (marked with an arrow) has formed post-earnings, suggesting a potential resistance area ahead.
This points to a possible pullback. If it occurs, AMZN stock could correct, potentially towards the parallel orange line, drawn based on the blue channel’s width. A test of the $217 support level is also possible.
Should You Buy AMZN Shares Now?
Following the earnings report, AMZN has underperformed the S&P 500 (US SPX 500 mini on FXOpen). However, analysts remain optimistic. According to TipRanks:
→ 45 out of 46 analysts recommend buying AMZN stock.
→ The average 12-month price target for AMZN is $267.
Trade on TradingView with FXOpen. Consider opening an account and access over 700 markets with tight spreads from 0.0 pips and low commissions from $1.50 per lot.
This article represents the opinion of the Companies operating under the FXOpen brand only. It is not to be construed as an offer, solicitation, or recommendation with respect to products and services provided by the Companies operating under the FXOpen brand, nor is it to be considered financial advice.
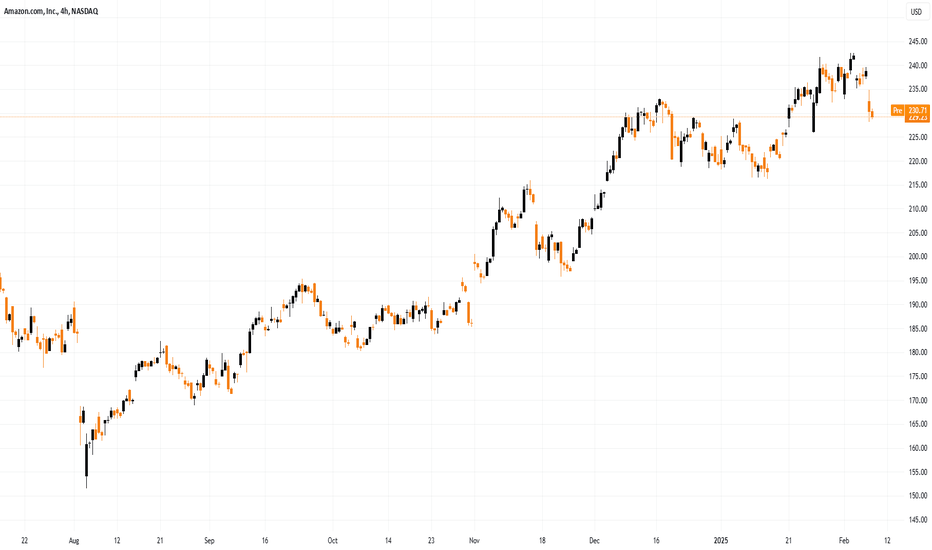
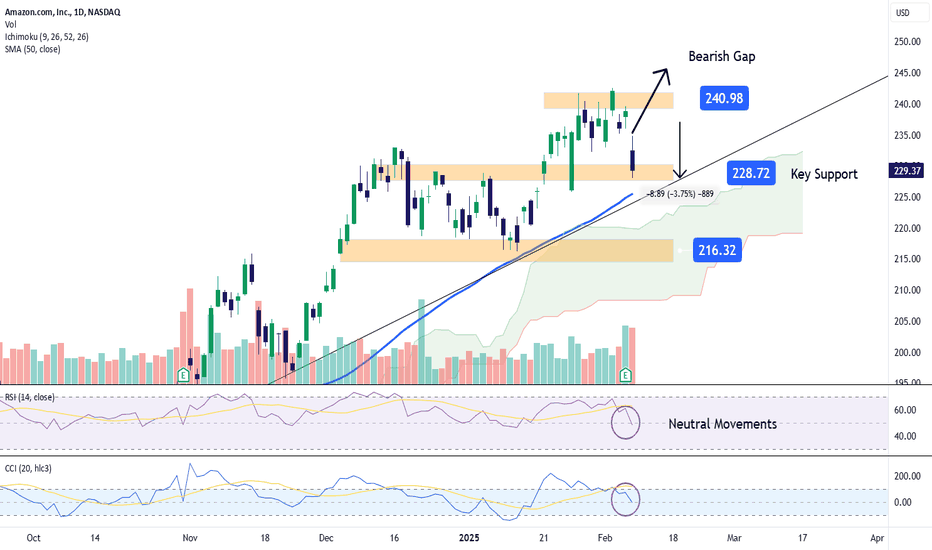
Amazon Stock Plummets After Earnings ReportDuring the last trading session, Amazon's stock dropped by more than 3.5% , bringing its price below $230 per share. This sharp decline followed the company's quarterly earnings release yesterday, where it reported earnings of $1.86 per share , surpassing the expected $1.49 , and revenue of $187.79 billion , slightly above the $187.30 billion projected.
However, investors were disappointed by the company’s sales growth forecast of only 5% for the first quarter of this year, along with a warning about a negative foreign exchange impact exceeding $2 billion. This has led to a decline in confidence, reinforcing a persistent bearish bias in Amazon’s stock price.
Bearish Trend Strengthens
Currently, a significant downward trendline has been in place since the last months of 2024. But the recent sell-off has raised doubts about the buying strength seen in previous sessions. If bearish pressure continues to increase, it could pose a considerable risk to the current market structure in the short term.
Neutrality Begins to Take Over
Both the RSI and CCI indicators have quickly dropped to their respective neutral levels— 50 for RSI and 0 for CCI. This suggests that recent price movements have turned neutral, making it unclear which force is currently dominating the market. If these indicators continue to hold within neutral territory, a potential sideways consolidation could emerge on the daily chart.
Key Levels to Watch:
$240 – The most important resistance level, representing the latest highs recorded by the stock. A breakout above this zone could reignite the long-term uptrend from last year and trigger sustained buying pressure.
$228 – A critical support zone that aligns with previous lows, as well as the uptrend line. If sellers push the price below this level, the bearish bias could strengthen, leading to a deeper downside correction in the short term.
$216 – Final support level, corresponding to the January lows and the Ichimoku cloud barrier in the short term. If selling pressure drags the price to this level, it could invalidate the current bullish structure on the chart.
By Julian Pineda, CFA – Market Analyst

