AMAZON -- Results of Buying before the SplitSharing some insights of when I bought Amazon before the split, It was a great decision as it has given my portfolio a great boost. It has been very bullish trending higher, and February started off on a good note so far. Ideally I would love to see it take the Previous months highs and keep pumping.
I would not be surprised if it reached MIL:1K per stock again. BUT NOT FINANCIAL ADVICE, and I also have no real data to support this theory yet. It is just my biased beliefs.
Stocks, Forex, Crypto and Futures Trading Risk Disclosure:
The National Futures Association (NFA) and Commodity Futures Trading Commission (CFTC), the regulatory agencies for the forex and futures markets in the United States, require that customers be informed about potential risks in trading these markets. If you do not fully understand the risks, please seek advice from an independent financial advisor before engaging in trading.
Trading forex and futures on margin carries a high level of risk and may not be suitable for all investors. The high degree of leverage can work against you as well as for you. Before deciding to trade, you should carefully consider your investment objectives, level of experience, and risk appetite.
There is a possibility of losing some or all of your initial investment, and therefore, you should not invest money that you cannot afford to lose. Be aware of the risks associated with leveraged trading and seek professional advice if necessary.
BDRipTrades Market Opinions (also applies to BDelCiel and Aligned & Wealthy LLC):
Any opinions, news, research, analysis, prices, or other information contained in my content (including live streams, videos, and posts) are provided as general market commentary only and do not constitute investment advice. BDRipTrades, BDelCiel, and Aligned & Wealthy LLC will not accept liability for any loss or damage, including but not limited to, any loss of profit, which may arise directly or indirectly from the use of or reliance on such information.
Accuracy of Information: The content I provide is subject to change at any time without notice and is intended solely for educational and informational purposes. While I strive for accuracy, I do not guarantee the completeness or reliability of any information. I am not responsible for any losses incurred due to reliance on any information shared through my platforms.
Government-Required Risk Disclaimer and Disclosure Statement:
CFTC RULE 4.41 - HYPOTHETICAL OR SIMULATED PERFORMANCE RESULTS HAVE CERTAIN LIMITATIONS. UNLIKE AN ACTUAL PERFORMANCE RECORD, SIMULATED RESULTS DO NOT REPRESENT ACTUAL TRADING. ALSO, SINCE THE TRADES HAVE NOT BEEN EXECUTED, THE RESULTS MAY HAVE UNDER-OR-OVER COMPENSATED FOR THE IMPACT, IF ANY, OF CERTAIN MARKET FACTORS, SUCH AS LACK OF LIQUIDITY. SIMULATED TRADING PROGRAMS IN GENERAL ARE ALSO SUBJECT TO THE FACT THAT THEY ARE DESIGNED WITH THE BENEFIT OF HINDSIGHT. NO REPRESENTATION IS BEING MADE THAT ANY ACCOUNT WILL OR IS LIKELY TO ACHIEVE PROFIT OR LOSSES SIMILAR TO THOSE SHOWN.
Performance results discussed in my content are hypothetical and subject to limitations. There are frequently sharp differences between hypothetical performance results and the actual results subsequently achieved by any particular trading strategy. One of the limitations of hypothetical trading results is that they do not account for real-world financial risk.
Furthermore, past performance of any trading system or strategy does not guarantee future results.
General Trading Disclaimer:
Trading in futures, forex, and other leveraged products involves substantial risk and is not appropriate for all investors.
Do not trade with money you cannot afford to lose.
I do not provide buy/sell signals, financial advice, or investment recommendations.
Any decisions you make based on my content are solely your responsibility.
By engaging with my content, including live streams, videos, educational materials, and any communication through my platforms, you acknowledge and accept that all trading decisions you make are at your own risk. BDRipTrades, BDelCiel, and Aligned & Wealthy LLC cannot and will not be held responsible for any trading losses you may incur.
AMZN

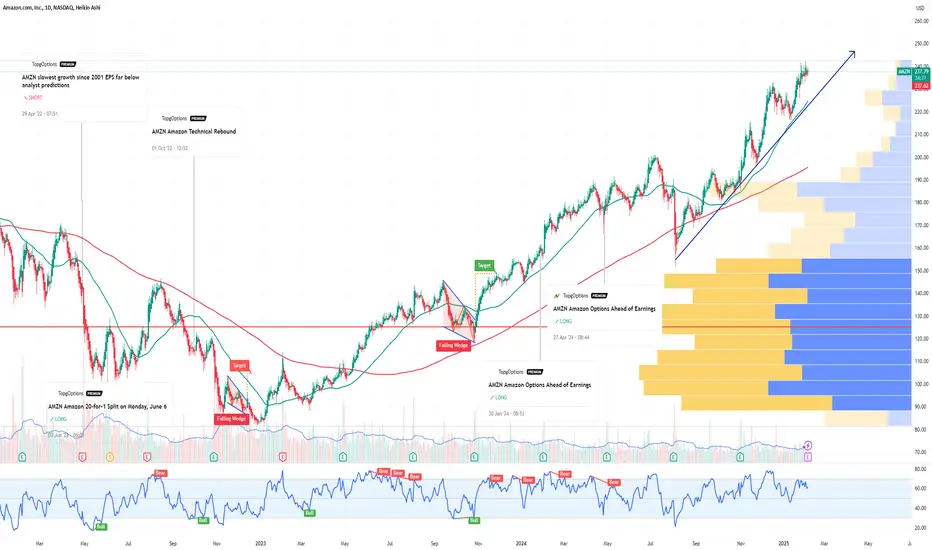
Amazon (NASDAQ:$AMZN) Slides 4% Amidst Cloud Growth SlowdownAmazon (NASDAQ: AMZN) shares slid nearly 4% in pre-market trading on Friday, as investors reacted to a slowdown in the company's cloud growth and a subdued sales forecast for the current quarter. The dip comes despite strong performance in Amazon's retail segment and a broader technical breakout that suggests the stock may be poised for a significant upward move in the coming months. Let’s dive into the technical and fundamental factors driving Amazon’s current market dynamics and why this dip could be a buying opportunity for long-term investors.
Cloud Growth Slowdown Weighs on Sentiment
Amazon Web Services (AWS), the company’s cloud computing division and a key profit driver, reported a 19% year-over-year revenue increase to $28.79 billion for the quarter. While this growth is impressive, it fell slightly short of analyst expectations of $28.87 billion, according to LSEG data. This miss has raised concerns about the competitive pressures AWS faces from rivals like Microsoft Azure and Google Cloud, as well as emerging low-cost competitors such as China’s DeepSeek.
Technical Outlook
From a technical perspective, Amazon’s stock chart tells an intriguing story. As of Friday’s pre-market trading, AMZN was down 2.78%, but the stock recently broke out of a falling trend channel, signaling a potential reversal of its previous downtrend. While the stock has yet to capitalize on this breakout, the current dip could be interpreted as a "shakeout" before a significant upward move.
Key technical indicators support this bullish thesis:
- Relative Strength Index (RSI): The RSI remains strong at 60, indicating that the stock is neither overbought nor oversold and has room to climb.
- Moving Averages: AMZN is trading well above its 50-day, 100-day, and 200-day moving averages, a sign of strong underlying momentum and bullish sentiment.
This technical setup suggests that the pre-market dip may be a temporary pullback rather than the start of a sustained downtrend. For traders and investors, this could present an attractive entry point.
Strong Revenue and Earnings Growth
Amazon’s financial performance in 2024 has been impressive, with revenue reaching $637.96 billion, a 10.99% increase compared to the previous year’s $574.79 billion. Earnings surged by 94.73% to $59.25 billion, reflecting the company’s ability to scale profitability even as it invests heavily in growth areas like AI and cloud infrastructure.
The company’s 12-month forward price-to-earnings (P/E) ratio of 37.3 is higher than peers like Alphabet (22.7) and Microsoft (30.1), but this premium is justified given Amazon’s diversified business model, dominant market position, and long-term growth potential.
Analyst Sentiment: Strong Buy Rating
Wall Street remains overwhelmingly bullish on Amazon. According to 43 analysts, the average rating for AMZN stock is a "Strong Buy," with a 12-month price target of $254.3, representing a 6.48% upside from the latest price. At least seven brokerages raised their price targets following the earnings report, bringing the median target to $260.
Analysts are optimistic about Amazon’s ability to navigate near-term challenges and capitalize on long-term growth opportunities in AI, cloud computing, and e-commerce. The company’s heavy investments in AI infrastructure, while weighing on margins in the short term, are expected to pay off handsomely in the coming years.

The strongest stock of the day $LTRYVolume tripled since morning and it jumped from $1 area "on air" to $1.30 area which means hundreds of million of shares are still trapped in this trade on the shortsell side and will have to exit one way or another without risking holding overnight and getting their accounts blown out.
We know when shortseller wants to exit he needs to cover to buy so it gives further buying to the stock.

AMZN Amazon Options Ahead of EarningsIf you haven`t bought AMZN before the previos earnings:
Now analyzing the options chain and the chart patterns of AMZN Amazon prior to the earnings report this week,
I would consider purchasing the 240usd strike price Calls with
an expiration date of 2025-2-7,
for a premium of approximately $6.40.
If these options prove to be profitable prior to the earnings release, I would sell at least half of them.
$AMZN is at risky area going into the earningsAmazon's last six earnings moves:
🟢 +7.5%
🔴 -12.7%
🟢 +3.4%
🟢 +8.2%
🟢 +8.7%
🟢 +11.4%
Options market expecting a 6.6% swing for NASDAQ:AMZN
Cloud drives 70% of profits
Retail? Barely profitable.
Amazon's market cap: $2.5T
For that price, you could own:
The entire Bitcoin market 5 times over
Every billionaire in the world’s top 500 list

BANGER $5 to $8+ on steadiest uptrend of 2025 so far!BANGER $5 to $8+ on steadiest uptrend of 2025 so far! 📈
Buy & Hold 💬
Told you about it in chat while it was still in $6's
Doesn't get any easier than this, just waiting for the money to pile as it keeps uptrending NYSE:BBAI
Everyone that listened got paid, it was the only stock bought and held yesterdy 1/1 for a fat win.

AMZN is looking for an uptrendAMZN hits the target of double top. After reaching the target area, it will form a V-shaped bottom, and if it is maintained, it will form two double bottoms, which makes the stock set for an upward trend.

Stock Market Forecast | TSLA NVDA AAPL AMZN META MSFT GOOGLStock Market Forecast | QQQ SPY
Mag 7 Forecast | TSLA NVDA AAPL AMZN META MSFT GOOGL

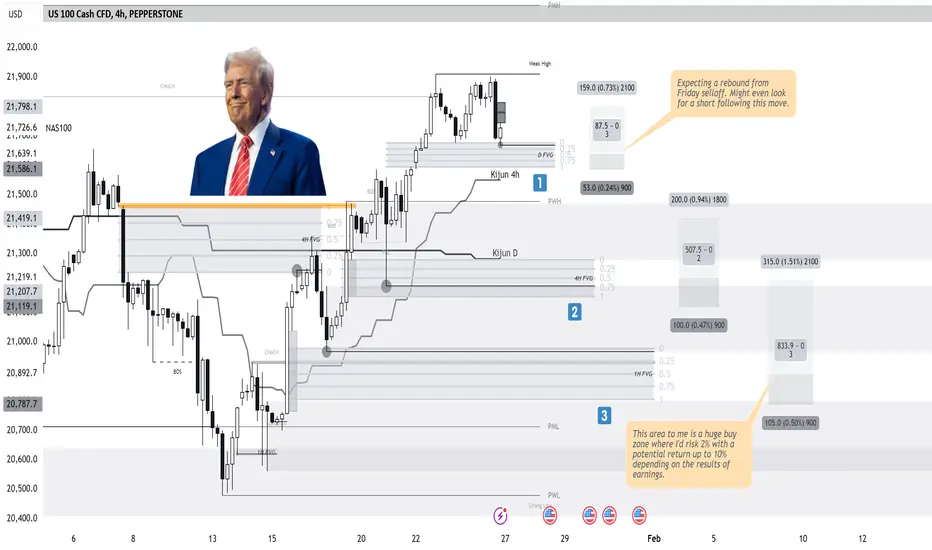
US100 Trade LogUS100 analysis: Three "buy zones" identified for potential entries with distinct risk levels.
1. "Zone 1" : Near the "4H Kijun" and prior weak high, aiming for short-term rebound with controlled risk.
2. "Zone 2" : Aligns with deeper "4H FVG" support. This setup offers a higher conviction for a reversal targeting the mid-range.
3. "Zone 3" : Major buy zone with strong confluence at the "PML" and "1H FVG" . Willing to risk 2% for a potential return of up to 10%, depending on upcoming earnings.
Each zone represents escalating risk-reward setups, ensuring precise risk management across macro support structures. Consider macro headwinds and earnings season's volatility.
AMAZON going for a DIP on the 4HCrystal ball has spoken, AMZN is due for a small DIP.
Trend Analysis:
• The price is trading in an overall uptrend, respecting the 50 EMA (yellow) and 20 EMA (gold), indicating strong bullish momentum.
• Recent price action has formed higher highs and higher lows, maintaining bullish structure.
JP StochDemark Indicator Insights:
• The indicator is approaching overbought levels, currently crossing above the 80 threshold, which signals potential exhaustion in the short term.
• Bearish divergence is forming as price makes new highs while the indicator fails to confirm.
• Previous occurrences of such setups led to short-term pullbacks before continuation.
Support & Resistance Levels:
• Immediate resistance at $236-$238, aligning with recent highs.
• Short-term support at $ 225 , where moving averages align.
• Strong demand zone around $210-$215, coinciding with prior consolidation.
Trade Signal & Probability:
Bullish Bias : Continuation likely if price sustains above $ 230 with momentum confirmation.
Bearish Pullback : A corrective dip to the $225 zone is probable if momentum weakens.
Target Levels : Upside targets at $240 (psychological resistance) and $250 if momentum persists.
Risk Levels : Watch for breakdown below $225, which could trigger further downside to $215.
Conclusion :
Momentum remains bullish but overbought signals suggest caution.
Monitor for a healthy retracement before continuation. A break above $238 could confirm further bullish momentum.
Like the analysis? Follow, Subscribe for more...

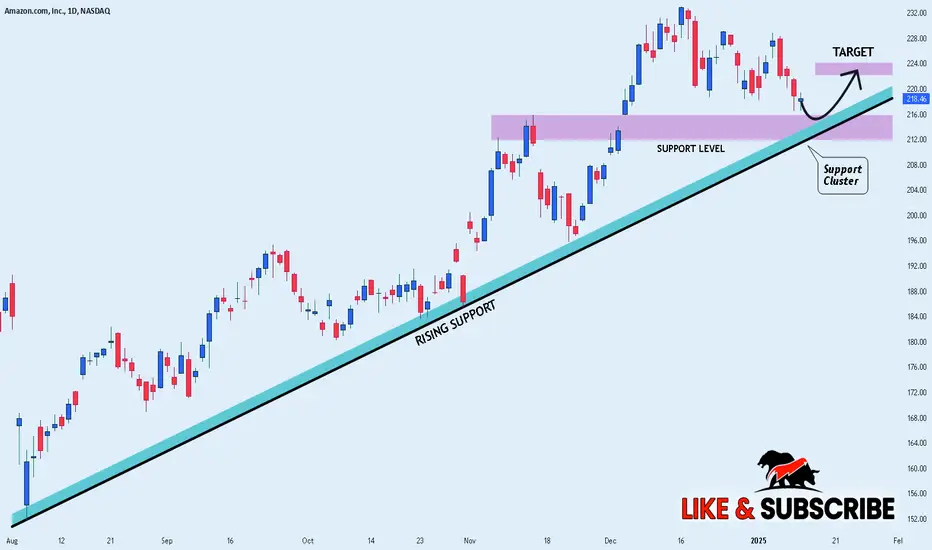
Amazon (AMZN) Continuation Breakout in FocusChart Analysis:
Amazon's price action showcases a breakout from a consolidation channel (green shaded area), confirming the resumption of its broader uptrend.
1️⃣ Rising Trendline Support (Blue):
The price continues to respect the ascending trendline originating from September 2024 lows.
This trendline acts as a dynamic support zone, reinforcing the bullish structure.
2️⃣ Consolidation Channel Breakout:
After a brief consolidation in a descending channel, the price has broken out to the upside, signaling bullish continuation.
A decisive daily close above the channel confirms renewed buying interest.
3️⃣ Moving Averages:
50-day SMA (blue): Positioned at $217.48, rising and providing strong dynamic support.
200-day SMA (red): Positioned at $192.35, further underpinning the long-term bullish trend.
4️⃣ Momentum Indicators:
RSI: At 60.32, signaling strong upward momentum but still below overbought levels.
MACD: Positive crossover continues to support the bullish momentum.
What to Watch:
Sustained trading above the breakout level to confirm the continuation of the rally.
Potential resistance near $240-$250, the next significant zone to watch.
Pullbacks to the 50-day SMA or the ascending trendline could provide buying opportunities for trend followers.
Amazon's breakout from consolidation and its adherence to the ascending trendline suggest the stock is poised for further gains, supported by strong momentum and rising moving averages.
-MW

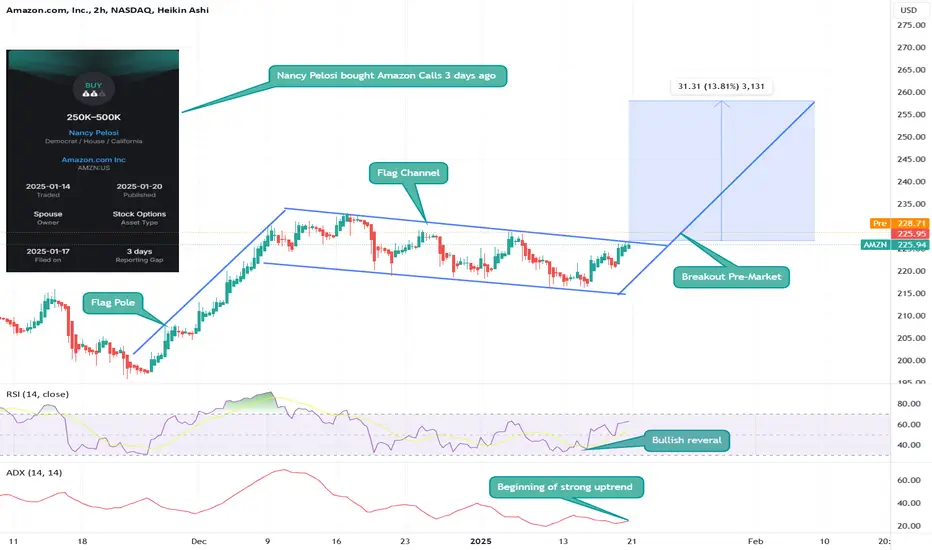
Nancy Pelosi bought Amazon Calls! 📈 Bullish Opportunity: Amazon (AMZN)
1️⃣ Bullish Flag Pattern with Premarket Breakout:
Amazon has formed a classic bullish flag pattern, which is a reliable continuation signal in an uptrend. The price has already broken out of the flag channel in the premarket session, signaling strong bullish momentum and potential for significant upside.
2️⃣ Amazon’s Cloud Leadership is Poised to Strengthen:
AWS (Amazon Web Services) continues to lead the cloud infrastructure market, controlling 33% of the market—more than Azure and Google Cloud combined, according to Canalys.
CEO Andy Jassy noted four consecutive quarters of reaccelerating AWS growth, with an annualized revenue run rate of $110 billion.
3️⃣ AI Advancements Reasserting Dominance:
While Microsoft is seen as the leader in the AI revolution, Amazon is catching up fast. Over the past 18 months, AWS released nearly twice as many machine learning and generative AI features as competitors combined.
These advancements are expected to make Amazon a leader in AI throughout 2025, further enhancing its cloud and technology business.
4️⃣ E-commerce Profitability Soaring:
CEO Andy Jassy’s focus on cost-cutting and logistics efficiency is delivering results:
Operating income in Amazon’s North American e-commerce segment grew by 87% in the first nine months of 2024.
Automation advancements, like robotics in fulfillment centers, have reduced processing times and improved cost efficiency by 25% during peak times.
These measures are driving higher profitability in its flagship e-commerce business, helping Amazon increase margins and drive long-term growth.
5️⃣ Undervalued and Strong Growth Potential:
Simply Wall Street estimates Amazon is trading at 40.5% below fair value, offering an attractive entry point for investors.
6️⃣ Smart Money Confidence:
Nancy Pelosi recently purchased Amazon calls 3 days ago!
7️⃣ Analyst Ratings:
Consensus: Strong Buy from top analysts.
Average Price Target: $245 (near-term expectations).
High Price Target: $280 (bullish scenario).
🎯 Strategy:
Enter now : $225.94 - $228.50
First Target : $240 (First resistance after breakout).
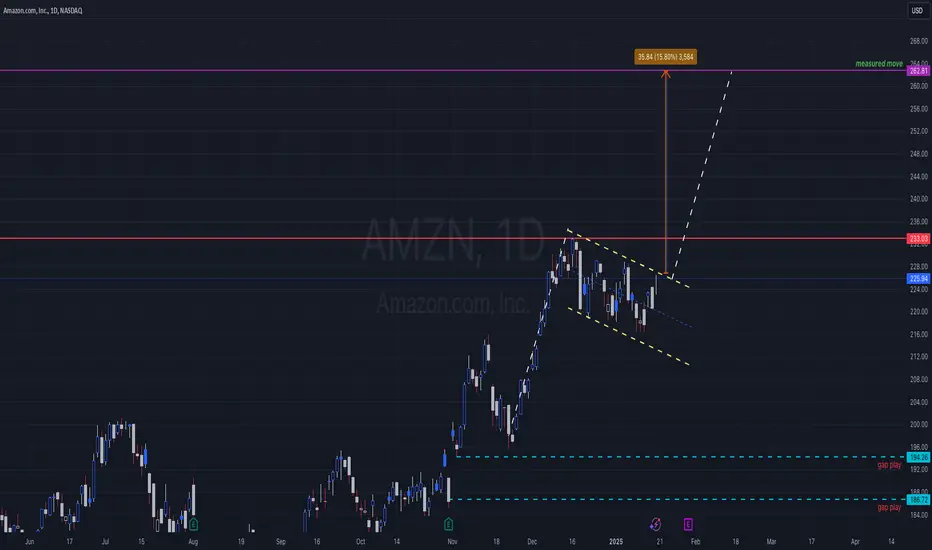
Second Target : $260 (Measured move from the flagpole).
Third Target : $280 (High-end analyst expectations).
Stop Loss: Based on the risk management.
AMAZON - Next day delivery of GAINS!NASDAQ:AMZN 📦
🔹Green H5 Indicator
🔹9ema Bullish Cross
🔹Bull Flag
🔹Bullish Wr%
🔹Volume Shelf Launch
🎯$233🎯$243 before March! ⏲️
Not financial advice
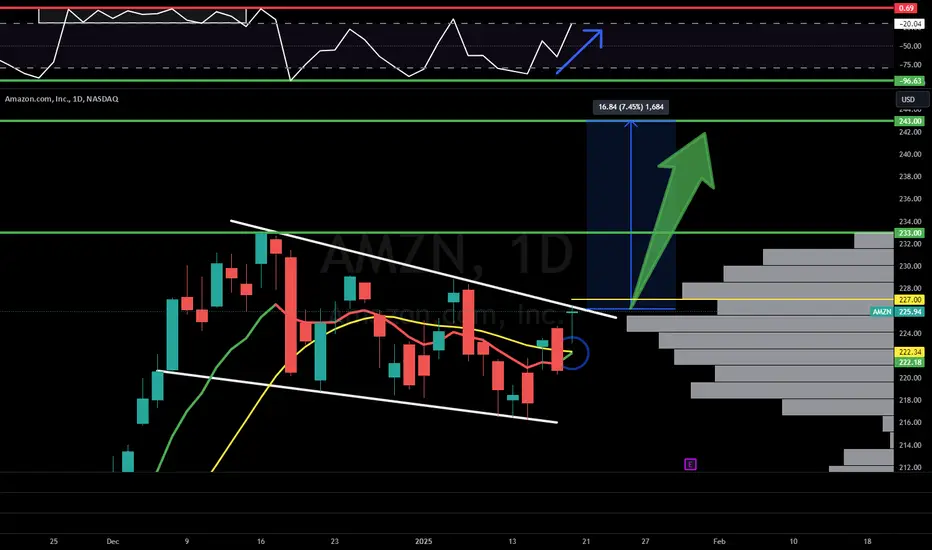
Mo money Mo money AMZN to the moon ? AMZN: Bull Flag on Daily Chart
Amazon (AMZN) is forming a bullish flag pattern on the daily chart, indicating potential for further upward movement. This pattern typically suggests a continuation of the prior uptrend after a period of consolidation.
Key observations:
Bull Flag Structure: After a strong upward surge, AMZN has entered a consolidation phase, creating a flag-like formation with parallel downward-sloping lines.
Volume Dynamics: The initial breakout was accompanied by high volume, while the consolidation phase has seen diminishing volume, a classic characteristic of a bull flag.
Support and Resistance Levels: The resistance level is observed around , with support at , defining the flag boundaries.
Moving Averages: AMZN is holding above the , which may provide additional support and align with the bullish outlook.
Potential Breakout: A breakout above the upper boundary of the flag could propel AMZN toward , based on the flagpole's length projection.
Watch for a breakout with increasing volume to confirm the bullish continuation. Keep an eye on broader market trends and any news that may influence AMZN's price action.
Amazon’s Stock Stuck in a Downhill Slope or Ready to Escape ?Amazon's stock price movement on a 4-hour timeframe, presenting a descending channel pattern. This pattern is often associated with bearish sentiment, as it reflects a market structure characterized by lower highs and lower lows, signaling a consistent effort by sellers to dominate price action.
Currently, the price is trading near the upper boundary of the channel, which acts as a dynamic resistance level. Historically, such resistance zones within descending channels tend to attract selling pressure, reinforcing the bearish outlook. If the price fails to break above this resistance and shows rejection signs (e.g., long wicks or bearish candlesticks), it could confirm a continuation of the downtrend, targeting the lower boundary of the channel as the next support level.
It is crucial to monitor this resistance area closely, as a breakout above the channel could shift the sentiment from bearish to bullish. For such a breakout to be credible, it must be accompanied by strong volume and decisive candlestick patterns, such as a bullish engulfing or a breakout gap. In that scenario, the price could invalidate the descending channel and initiate a reversal, targeting higher resistance levels.
Additionally, the broader market context and fundamental factors should be considered. If the stock is supported by positive catalysts or market sentiment, it could strengthen the likelihood of a breakout. Conversely, weak sentiment or negative news could intensify the bearish momentum, leading to further downside.
The chart currently reflects a bearish bias due to the descending channel structure. However, the key to determining the next move lies in the price action and volume near the upper resistance line, which will decide whether the pattern continues or reverses.

AMAZON WILL KEEP GROWING|LONG|
✅AMAZON is trading in an
Uptrend along the rising
Support line and we are
Already seeing a bullish rebound
And a move up from the support
Just as I predicted so we are
Bullish biased and we will be
Expecting a further
Bullish continuation
LONG🚀
✅Like and subscribe to never miss a new idea!✅

Stock Market Forecast | TSLA NVDA AAPL AMZN META GOOGL MSFTStock Market Forecast QQQ SPY
Mag7 Forecast TSLA NVDA AAPL AMZN META MSFT GOOGL

AMAZON Bullish Flag Pattern! Buy!
Hello,Traders!
AMAZON is trading in an
Uptrend and the stock
Has formed a bullish flag
Pattern so IF we see a
Bullish breakout then we
Will be expecting a
Further bullish continuation
Buy!
Comment and subscribe to help us grow!
Check out other forecasts below too!

AMAZON: Neutral on 1D signals a buy opportunity.AMAZON is neutral on its 1D technical outlook (RSI = 52.618, MACD = 1.360, ADX = 32.455) and is trading under its 4H MA50. With the long term pattern being a Channel Up and the price already hitting its bottom, this emerges as a medium term buy opportunity. The Channel's pullback has already met the 0.382 Fibonacci retracement condition, which is the level all three prior pullbacks hit before rebounding on a new bullish wave. Those waves hit at least the -0.382 Fibonacci extension on their way up, so that is our target (TP = 247.00).
See how our prior idea has worked out:
## If you like our free content follow our profile to get more daily ideas. ##
## Comments and likes are greatly appreciated. ##

Amazon Stock Analysis: Navigating the Path Between E-Commerce
Amazon Stock Analysis: Navigating the Path Between E-Commerce Strength and Market Volatility
Introduction
Hello, traders and investors! It’s Denis Mikheev from TheWaved™, here to deliver an in-depth analysis of Amazon’s stock (NASDAQ: AMZN). With the help of our premium tools and techniques, we’re diving deep into technical, VSA, and fundamental analysis to uncover the best strategies for the upcoming market movements. Let’s break down what’s happening with AMZN and set clear targets for trading this powerhouse of e-commerce.
Recent Performance and Market Context
Amazon’s current price sits at $219.27, with a noticeable decline from its 2024 absolute high of $233. This 5.89% drop aligns with recent sell-offs driven by macroeconomic headwinds and profit-taking from the December highs.
The stock is trading in a consolidation phase, sitting between strong support zones at $214.99 and $209.11 and resistance levels at $223 and $228. With the broader NASDAQ index displaying mixed momentum, Amazon remains a critical stock to watch.
Support Levels:
-
1. 214.99
2. 209.11
3. 198.78
4. 182.62
5. 177.95
Resistance Levels:
-
1. 214.99
2. 209.11
3. 198.78
4. 182.62
5. 177.95
Powerful Resistance Levels:
-
1. 180.095
2. 151.49
3. 116.04
4. 87.57
Technical Analysis: Key Levels and Trends
Support Levels: 214.99, 209.11, 198.78
Resistance Levels: 223.00, 228.00, 233.00
Key Moving Averages:
- MA50 (Hourly): 220.01
- MA200 (Hourly): 223.16
RSI Insights: The RSI-14 currently reads 52.91, indicating a neutral market condition but leaning towards bullish potential on strong volume signals.
These technical indicators suggest price consolidation, but with bullish potential as the RSI edges upward and MA200 looms as a key dynamic resistance level.
Volume Spread Analysis (VSA): Detecting Market Intentions
Analyzing VSA patterns from recent trading sessions reveals mixed signals. A notable “Buy Volumes Take Over” pattern on January 10 suggested short-term buying strength, but was quickly followed by a reversal due to increased sell volumes. This signals that smart money may be accumulating positions before a larger move.
Price Action and Patterns
On January 6, a strong “Buy Volumes Max” pattern indicated bullish intentions, but resistance at $228.23 capped further growth.
On January 7, a “VSA Sell Pattern 3rd” hinted at a bearish reversal, driving prices back to support levels.
Key takeaway: The interaction between support at $214.99 and resistance at $223 will be pivotal in determining the next directional breakout.
Fundamental Factors to Watch
Amazon’s fundamentals remain strong, with steady revenue growth driven by AWS (cloud services) and robust e-commerce performance during the holiday season. However, rising interest rates and inflationary pressures continue to dampen consumer spending and could act as a headwind.
Trading Plan: Targets and Stop-Loss Levels
Based on the current setup, here’s a practical trading roadmap:
Short-Term Bullish Scenario:
Entry: Above $223 after confirmation of a breakout.
Targets: $228, $233.
Stop-Loss: $220.
Bearish Alternative:
Entry: Below $214 with strong bearish candles.
Targets: $209, $198.78.
Stop-Loss: $217.
Forecast: Where Are We Headed?
In the short term, Amazon is poised for a potential bullish breakout if it clears resistance at $223. However, caution is warranted if macroeconomic conditions shift. Our long-term view remains cautiously optimistic, with a forecast targeting $240+ by Q2 2025 as the broader market stabilizes.
Conclusion and Call to Action
This analysis is powered by TheWaved™, utilizing advanced tools and methodologies. If you have any questions or want a deeper dive into our methods, feel free to reach out via direct messages. Remember, all the professional indicators and insights are available in the profile header. Follow for more ideas, and let’s trade smarter, not harder!
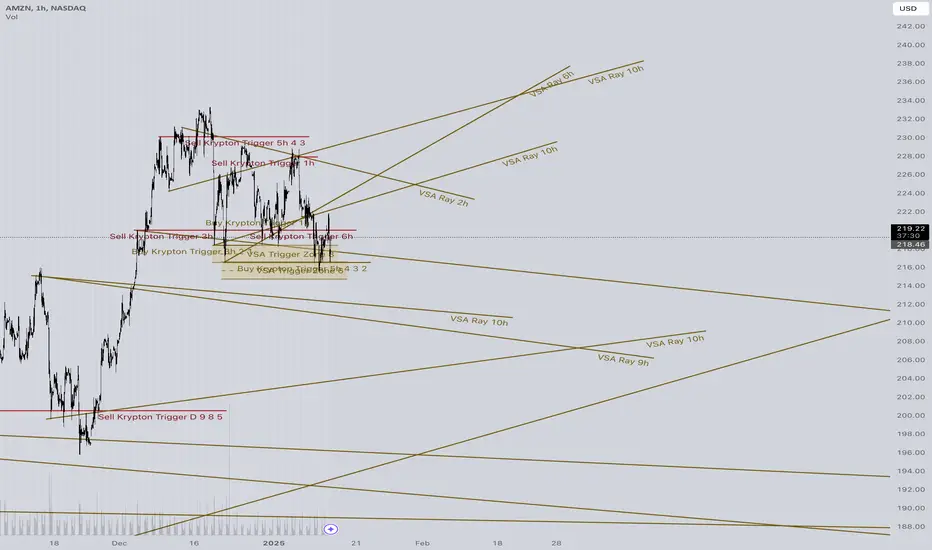
Concept of Rays
Explanation of the "Rays from the Beginning of Movement" Concept
Core Idea
My proprietary analysis method is based on using rays constructed on Fibonacci mathematical and geometric principles. These rays create a system of dynamic levels that help predict precise asset movements and identify key zones where price interactions occur. Price interaction with these rays signals probable scenarios: either a reversal or a continuation of movement, but only after interaction and the appearance of dynamic factors and patterns.
Why Predicting Specific Levels is Not Possible
Financial markets are nonlinear systems, where price movement is determined by numerous variables, including market volumes, liquidity, macroeconomic factors, and participant psychology. Instead of attempting to predict specific levels, I propose analyzing probabilities of price reaction at pre-calculated key zones. Price interaction with rays provides additional insights into the direction and strength of movement.
Stay sharp, trade safe, and may the markets favor your strategy!
AMAZON Will Keep Growing! Buy!
Hello,Traders!
AMAZON is trading in a
Strong uptrend along the
Rising support line so
After the retest of the
Support we will be expecting
A further bullish move up
Buy!
Comment and subscribe to help us grow!
Check out other forecasts below too!

AMAZON SUPPORT CLUSTER|LONG|
✅AMAZON is trading in an
Uptrend and the stock is
Now making a local correction
But will soon hit a support
Cluster of the rising and
Horizontal support lines
Around the 213.83$ area
So we are bullish biased
And we will be expecting
A further bullish move up
LONG🚀
✅Like and subscribe to never miss a new idea!✅
Stock Market | TSLA NVDA AAPL AMZN META GOOGL MSFTStock Market QQQ and SPY Analysis
Mag 7 Analysis | TSLA NVDA AAPL AMZN META GOOGL MSFT
