The Time to Accumulate and Buy Great Companies is Here
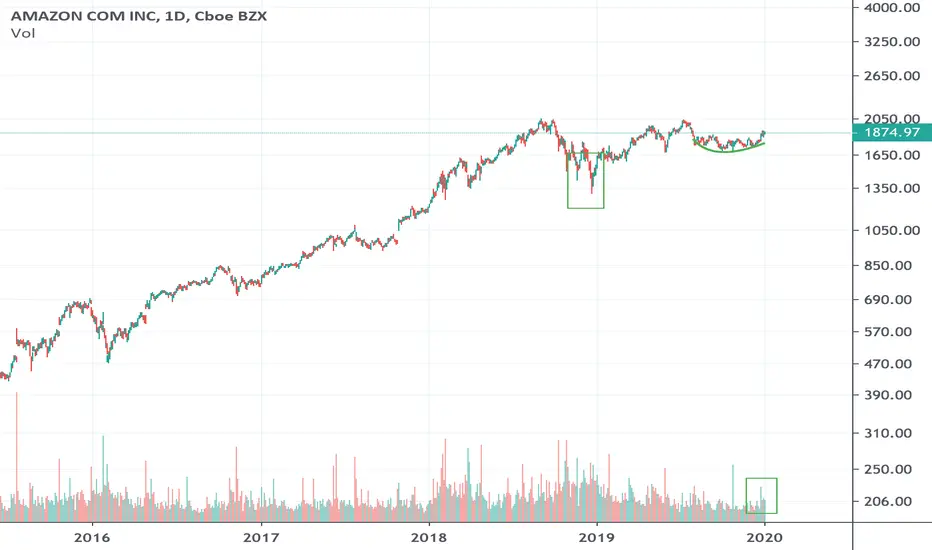
After witnessing the largest drop in S&P 500 in a week since the global financial crisis in 2008, we have seen the prices of many fundamentally good companies tumbling from being overbought such as AMZN. Thus, with AMZN prices falling to its support at 1850 as well as being supported by its long-term trendline, we can expect prices rising back to 2030 then to its all-time high. This provides an excellent for both short-term traders and long term investors to ride a potential rebound to the upside.
Amznlong

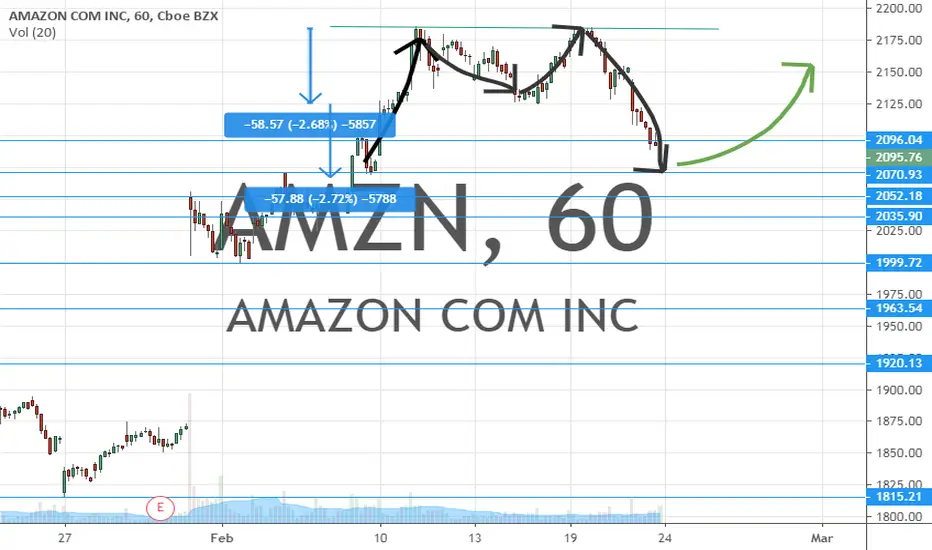
AMZN long update Amazon broke my earlier patter as I expected but the market had a huge sell-off today. My chart is showing a great squeeze set up. I think the bulls will buy the dip.

AMZN Pennant PatternSame Author- Different Account
AMZN forming a lovely pennant pattern. Respecting upper and lower bounds of support and resistance. This goes higher. The UpTrend continues. NASDAQ:AMZN
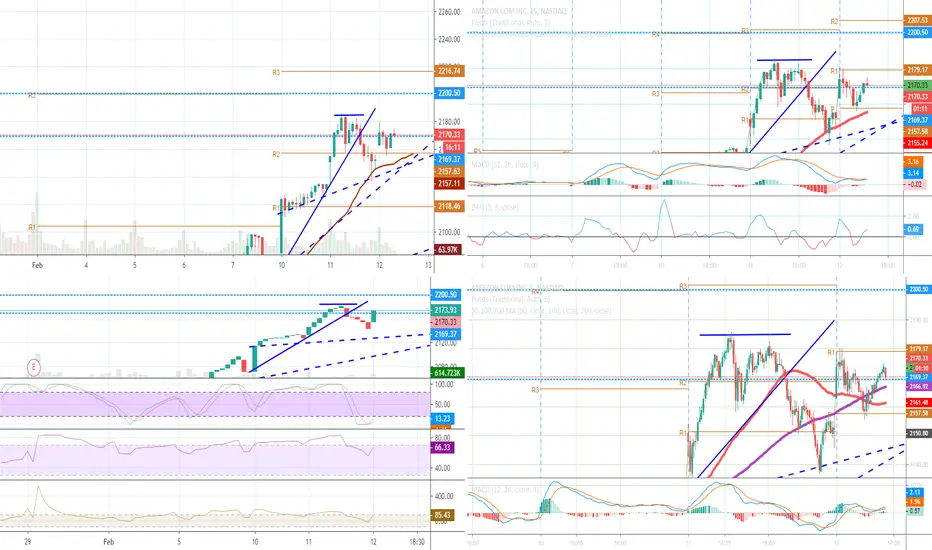
AMZN Long, awaiting large up move Today's big move was met with a lot of choppiness, a lot of firms taking profits, not allowing the stock to move up as much. Showing a pattern of chop before a big move. Still targeting 2200 by the end of the week.

AMZN Breakout Confirmed. Charts below. Same Author, Different Account
Amazon has officially broken out of Symmetrical triangle dating back from 2018. Looking for a move to 2700 over the oncoming months. Definitely taking profits along the way. NASDAQ:AMZN
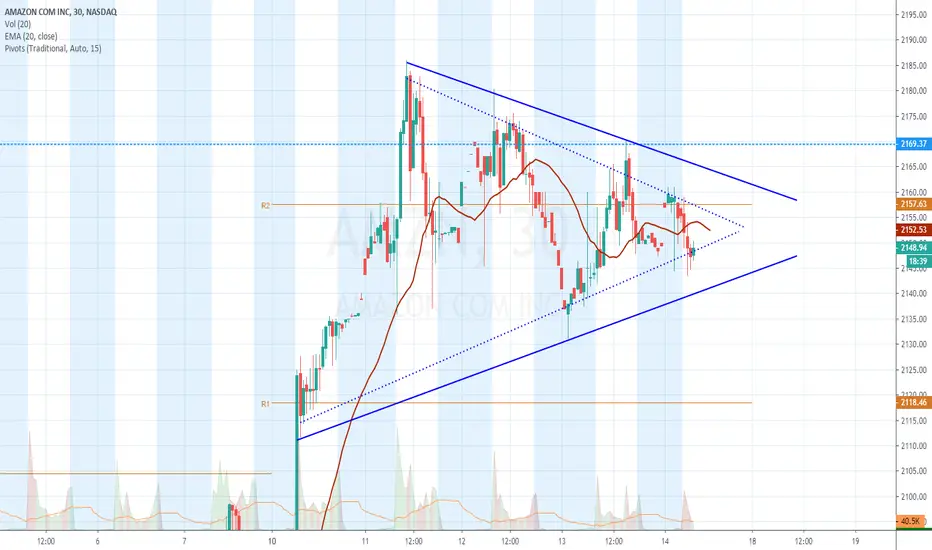
You can catch the bounce in smaller time frame Price may pullback up to this level where there is a previous support. You can catch the bounce in the smaller time frame like 30Mints.
#Amazon - 30% increase ahead? #amznLooks like there'll be no more Stocks left tomorrow. A 30% rise wouldn't surprise me.
$AMZN MASSIVE Cup With Handle$AMZN forming a huge cup with handle pattern on the weekly and just broke out of its base. Price targett $2300

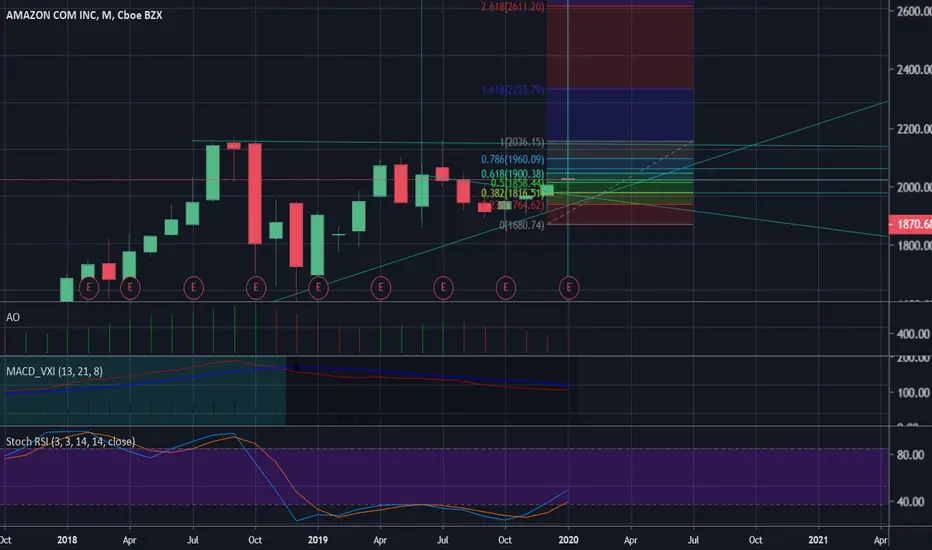
AMZN | Ascending Triangle + Strong FundamentalPlease support this idea with LIKE if you find it useful.
Initiate Long.
Entry - 2045.68
TP1 - 2225.41
TP2 - 2357.57
TP3 - 2455.36
SL - 1995.46
Reason: Price formed an Ascending Triangle and now trading near Resistance. We have strong fudamental reason for the Resistance to be broken. It's company earnings report, as CNN says "Amazon blew Wall Street's expectations out of the water"
Thank you for reading this idea! Hope it's been useful to you and some of us will turn it into profitable.
Remember this analysis is not 100% accurate. No single analysis is. To make a decision follow your own thoughts.
The information given is not a Financial Advise.

AMZN, Amazon.com Inc. - Cup & HandleNASDAQ:AMZN
We are getting closer and closer to the endurance breakout of this splendid Cup & Handle.
Despite the speculations in which we think that sooner or later there is a big retracement in the market, our focus is always on researching the classic patterns of technical analysis, and our study of price action is never influenced by external informations or medias.
We have the backtest that guides us in managing the position, and if we operate outside the parameters we studied, we would not replicate the results we expect.
The key is to be a trader who operates in a totally mechanical, not emotional way.

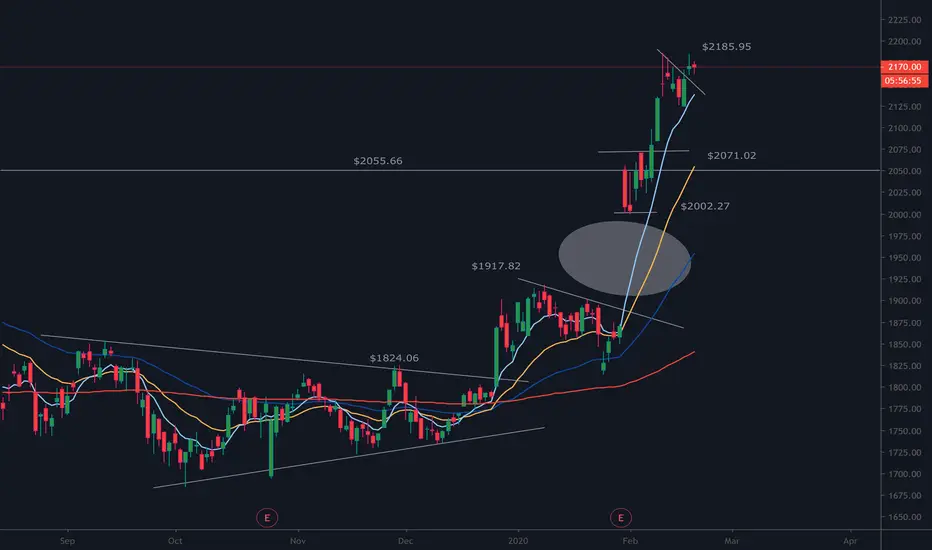
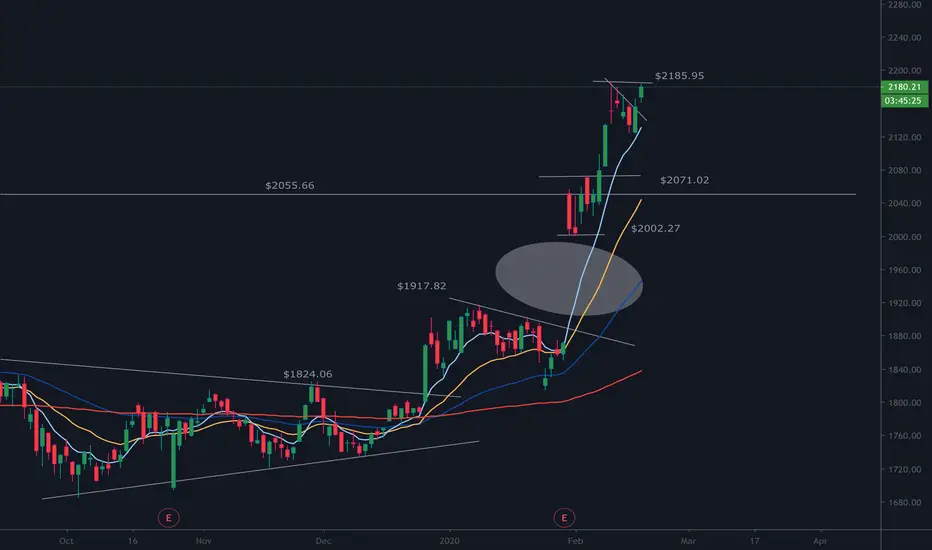
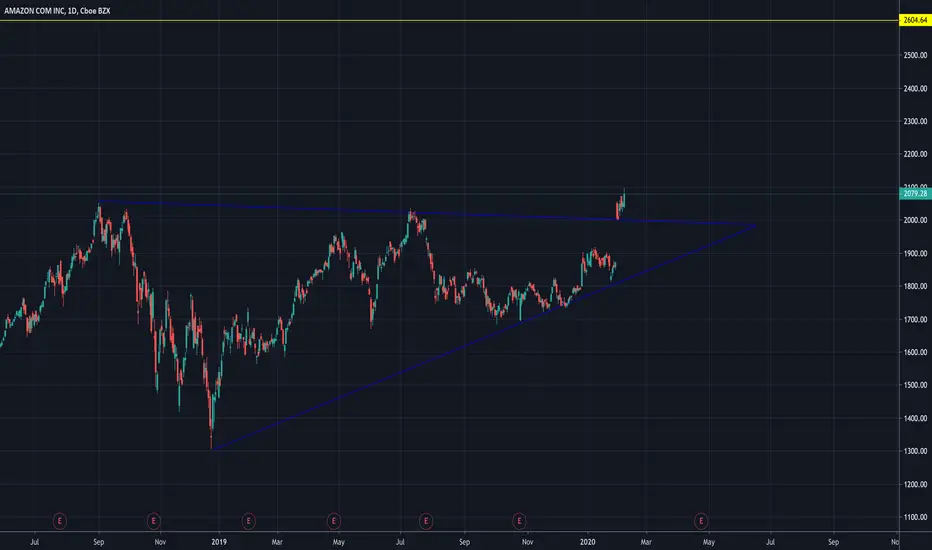
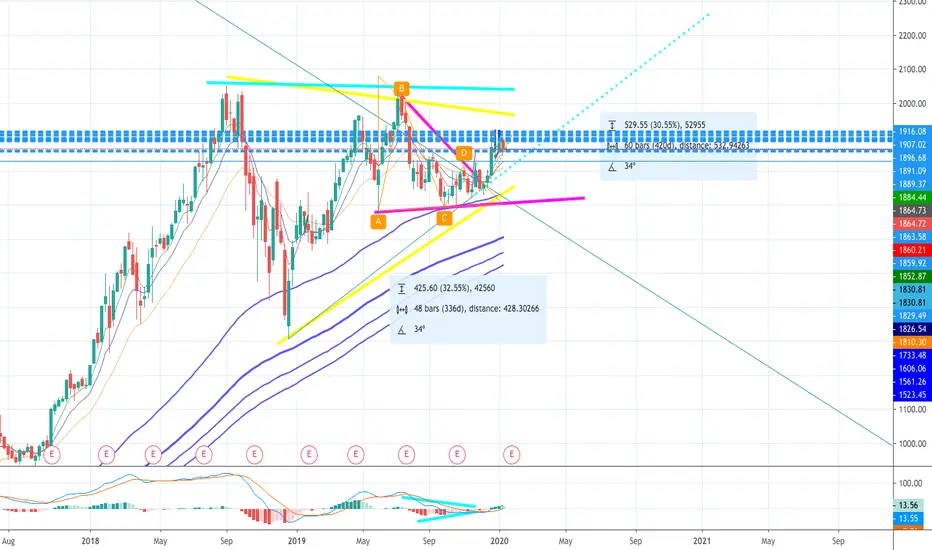
AMZN with Possible Long Term BreakoutAMZN failed to stay above fairly new established trendline on the short time intervals but refused to break and hold below key resistance levels around 1855-1860. On the larger interval charts price action is respecting trendlines well. In fact, we see what looks a breakout from a triangle on the Daily chart. We also see what looks like a MASSIVE ascending triangle forming on the weekly. (1st resistance hit back in September 2018, 2nd resistance hit back in July 2019, 3rd resistance hit TBD- Estimating a touch between late January and early March). If both triangles do justice, then we should see a breakout from the smaller triangle with a strong upward run to the resistance line of the larger ascending triangle, a slight break above, a retest of this new Resistance-turned Support, then a major unparalleled bullish uptrend for AMZN sending the price shattering the $2000 ceiling. From there onwards, the possibilities of price targets are nearly limitless. AMZN will have numerous tightly packed walls of resistances to break through initially to first make it to 1917 though. Currently looking for a break and hold above 1880 for a run to 1900; a break and hold above 1900 for a run to 1917-1920; then a break and hold above 1920 for a run to somewhere in the ballpark around 1960. Currently confirmation coming from upward trending MAs on the Weekly Chart and a bull flag on the daily. Keeping an eye out for major upcoming catalysts (ex: Earnings report coming up on 1/30/2020). NASDAQ:AMZN
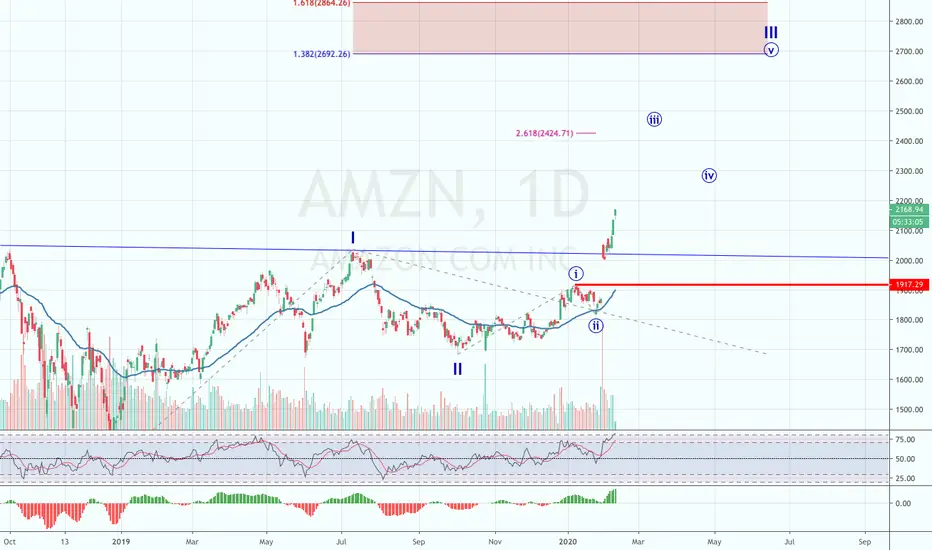
AMZN long. Obviously.AMZN obviously beat. Looking at the 1.618 fib level of 2230ish next. Will take profit along the way.
Congrats to all who are bullish on AMZN.
Alex Vieira Doubles Amazon Price Target On Shopify ValuationAmazon is the second cheaper tech stock on the exchange after Tesla

AMZN RSI ContinuationBullish RSI continuation. Strong regression trend, Pearson's R value of 0.93 on the monthly chart. A possible cup and handle also.

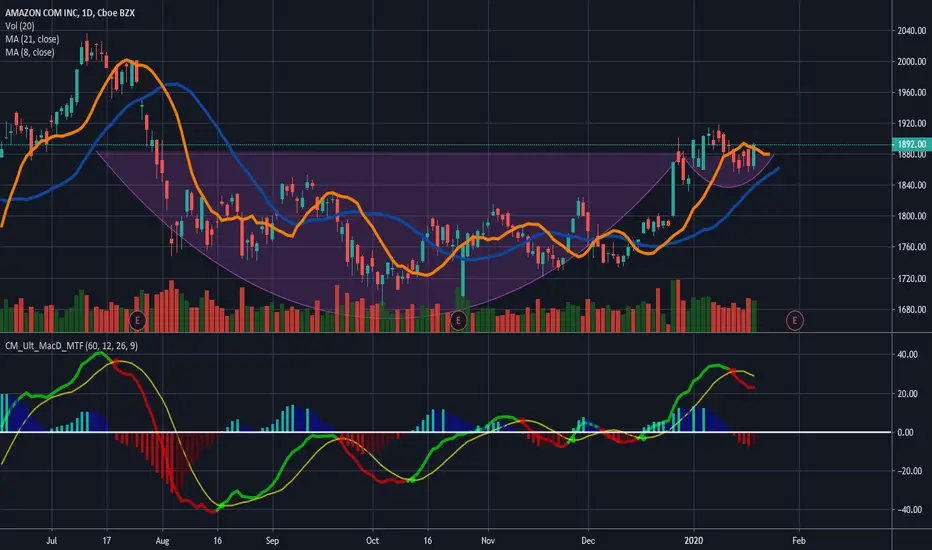
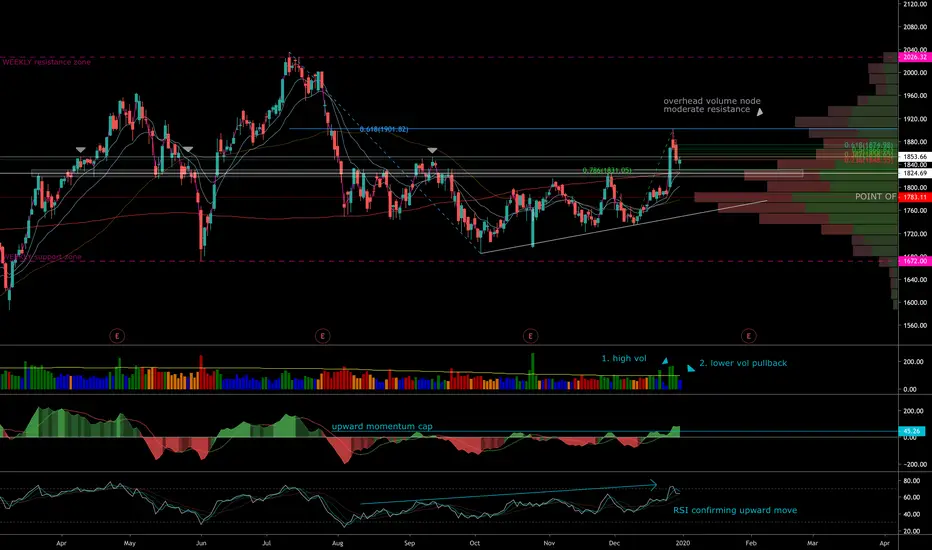
AMZN - retesting breakout consolidation area, good setupSummary
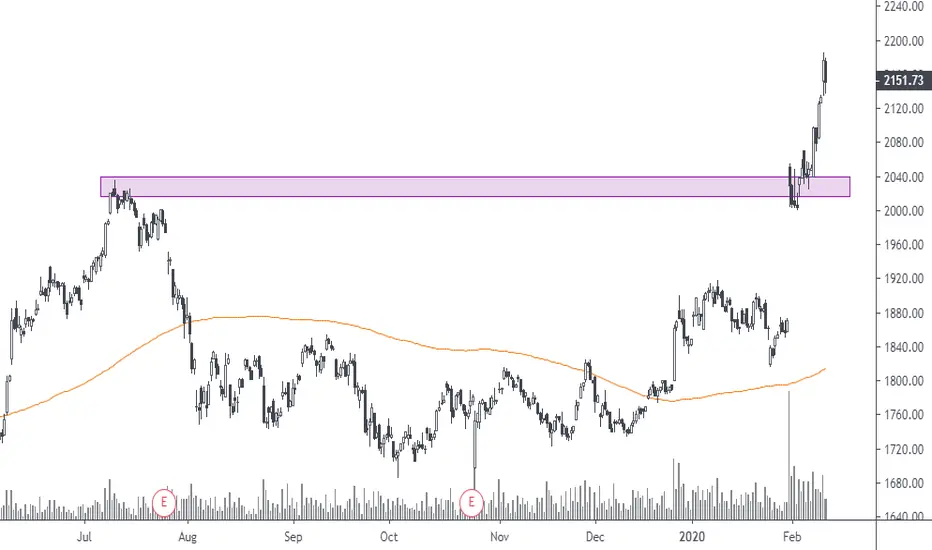
Provided market stays bullish I believe AMZN poses a good risk reward setup based on an extended consolidation period and high volume breakout with retest.
Analysis
Let's focus on this light gray box I've drawn that ranges from 1818.89 to 1830.77 and spans the width of the chart. Support and resistance are often fuzzier than one specific line, in this situation, we have about a $12 range where price responds. Observe for yourself how price reacts to this area.
Last August we fell below this level and attempted to break back above without success. Note the lower volume breakout attempt on Sept. 5th where price traded sideways and failed to hold above this level.
I also want to point out my OBVX v2 Oscillator, note how upward momentum has been capped since last August. Decent selling pressure and very little continuation on upward moves.
So, price consolidates for about 5 months, putting in slightly higher lows in an ascending triangle pattern.
Finally, on Dec. 26th we get a high volume break (1) and a large up candle. The following session we gap up and explode on high volume, then sell off closing near the previous sessions close. Interestingly, this candles highest price rejected almost exactly at the 61.8% retracement of the July 11th swing high, to the October 3rd swing low (blue fibs). When I see something like this I look to the volume profile, I want more clues. On the right of the chart you'll see a larger volume node. This has and will continue to serve as moderate resistance, so keep this area in mind while trading. Check out the OBVX, finally breaking out of that capped range.
The most recent session ended in an interesting place. We have a spinning top doji, which indicates indecision, bears are waiting for more information & so are the bulls.
Once again, we have some interesting fib respect. This time using a fib extension we see we've retraced almost exactly to the 78.6% retracement. This level also has confluence with our light gray box area we started this discussion with.
We also have a very near test to the well respected 200 sma. Look back on this chart to how well AMZN respects the 200 sma, and here we are sitting just above that level, on top of our gray box, above our point of control area.
I like the risk reward from this level, though I don't advise haste while entering. The spinning top doji warrants some caution here. But I do believe we have upside potential.
AMZN Buy Opportunity AMZN has formed a large double bottom buy, continuation of the bullish uptrend is likely, with the recent formation of this rounded bottom.
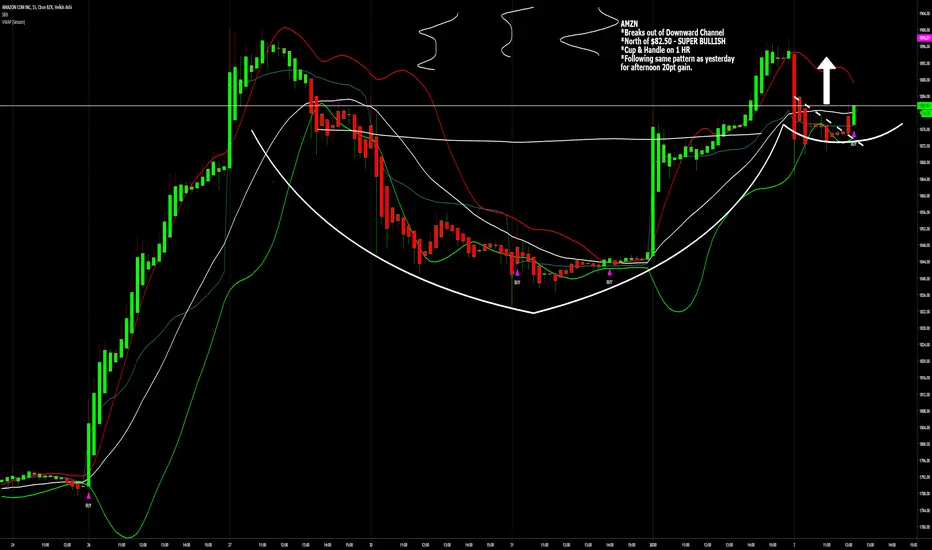
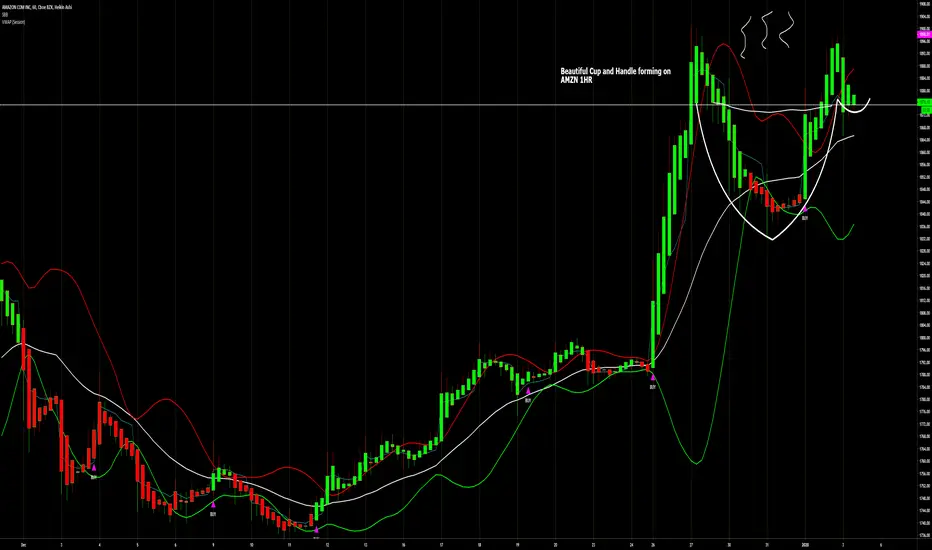
AMZN 1-Hour Cup & Handle Nice SetupNice setup on the 1 hour for amazon. looks like we're forming the upward half of the handle. Bolinger band contraction on 15m shows a jump to the upside also looks imminent.