AMZN: Top end of expanding triangle Couple of Trump deadlines coming up, the Chinese 25% tariffs and the funding for the wall/slate/whatever. As previously mentioned, I am of the opinion Trump is over promising and will continue to under deliver. He will be reluctant to look like he caved again. Which company will be the biggest victim of higher tariffs and maybe another shutdown? AMZN. AMZN works off low pricing and no prizes for guessing how much of AMZN products are sourced from China. The potentially higher tariffs coupled with weak consumer sentiment mixed with the probability of another government shutdown will be painful for AMZN.
Technically speaking, AMZN is:-
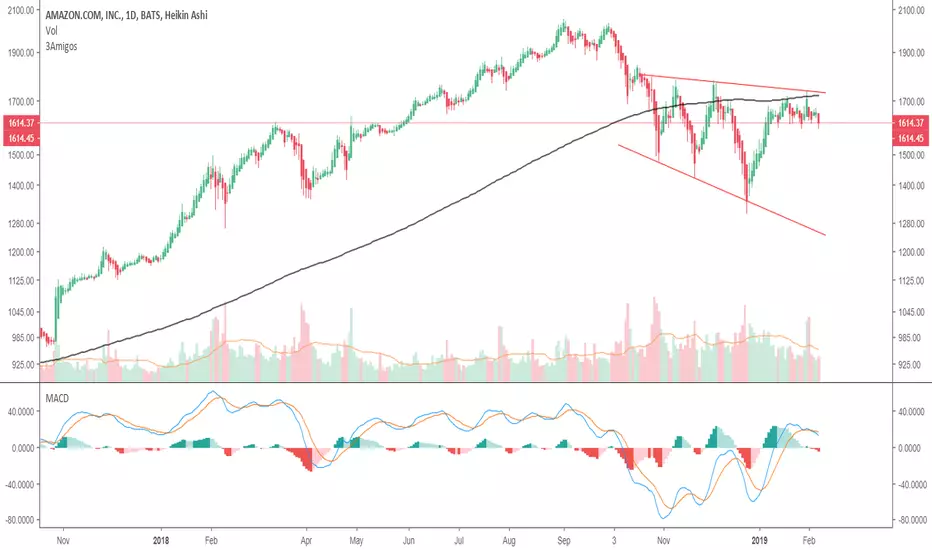
- hemmed in an expanding triangle formation or commonly known as megaphone pattern. This is a bearish pattern
- hemmed in by the 200-days MA
- MACD has reversed
- the 50-dma, 100-dma are trading below the 200-dma. Pick your favorite version of the death cross, AMZN got them all.
Top end risk of c.$1780 vs. lower end of megaphone pattern at c.$1250 gives a c.1:2 risk reward.
Amznshort
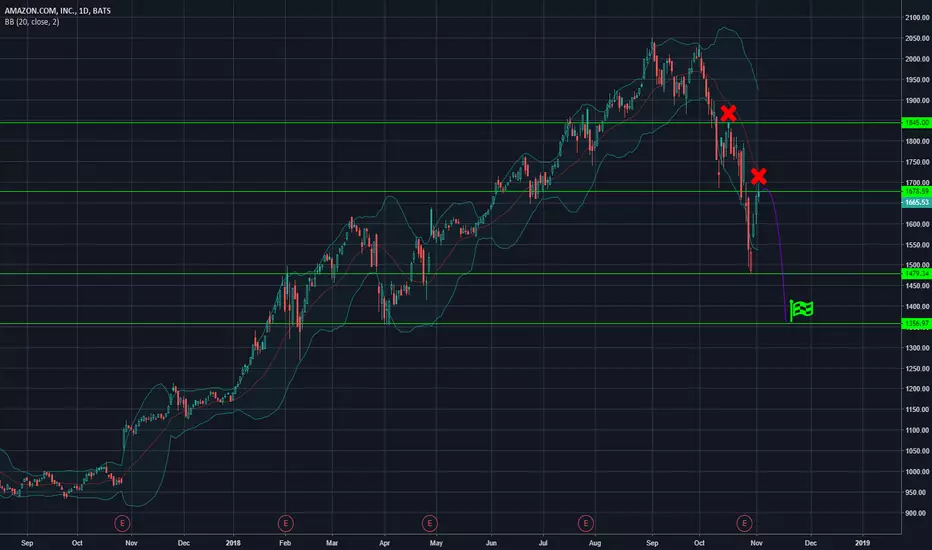
2019 SHORT - AMZN PT 1200We just began the next phase of our Bearish Trend using our Arbitrage Loop Indicator
We are expecting amzn to get to the bottom of our novice band with a price target near 1200.
See you there.
Your Arbitrage Bands Team

AMZN short. We're going down. Excuse the crude drawing.
Looking at "sentiment" buy buy buy, which sounds to me like short sellers trying to get buyers to fill their blocks.
We are and have been bear since July. I entered at 1800 Now I've put a position on again. Earnings shouldn't matter. Fed will be the tell.
AMZN (Amazon) D1 SignalAs you can see in the graph above there are some points that indicate that there is a great chance we will see fall again
1.We are currently in bearish channel
2.The RSI is in over buy that indicate fall soon
3. NASDAQ is showing weakness in recent days
Our recommend
Sell AMZN
Entry Price: 1643
Stop Loss: 1764
Take Profit: 1390

AMZN Ready to Fall For the longest time Amazon was the perfect stock, but now it's primed to fall. It's near its resistance line and will crash then hit the support and go back up.


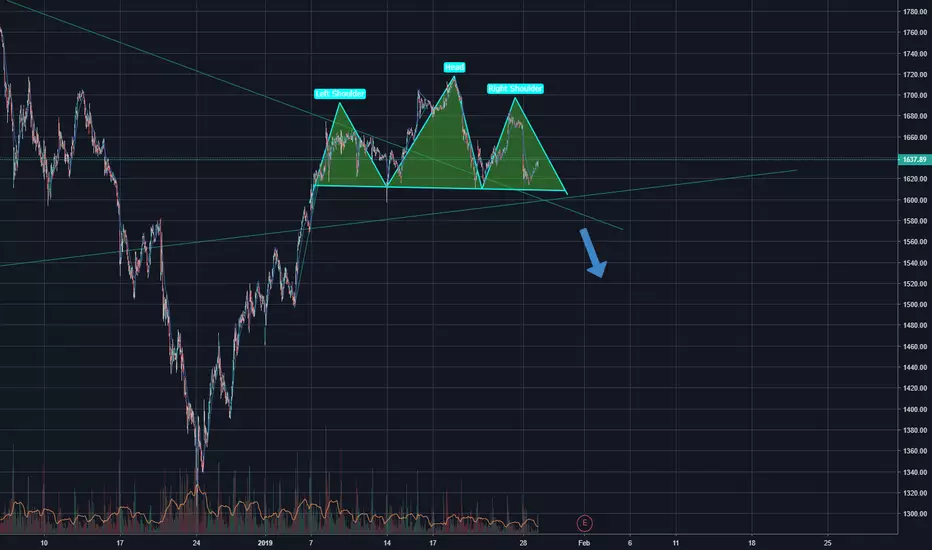
AMZN H&S confirmation, Targeting $970-1043 early 2019AMZN H&S confirmation, Targeting $970-1043 early 2019

End Of Titan Scheme ? End Of Chain Of Happiness ? Enron ? This parabolic rise is like a chain of money..
Still waiting a big crash...
Amazon is not a planet or a spaceship.. This is chain of money..... No production no tech.. This is a scheme and they have so mannnnnnyyyy members...
Time will telll..

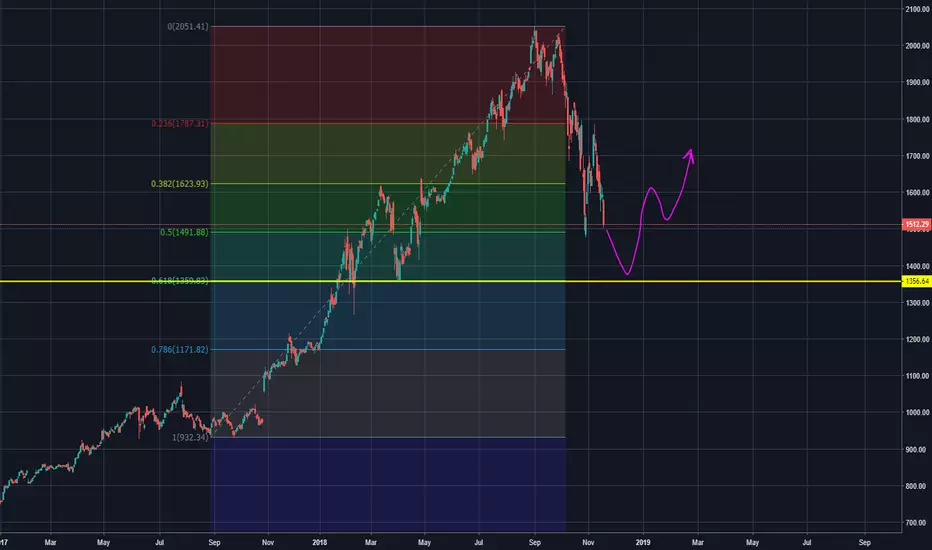
Amazon chart looks bad...AMZN looks bad. It will most likely correct to the .618 Fib Level or go even down further to .786 Fib level where the price can find a nice support at the trendline.


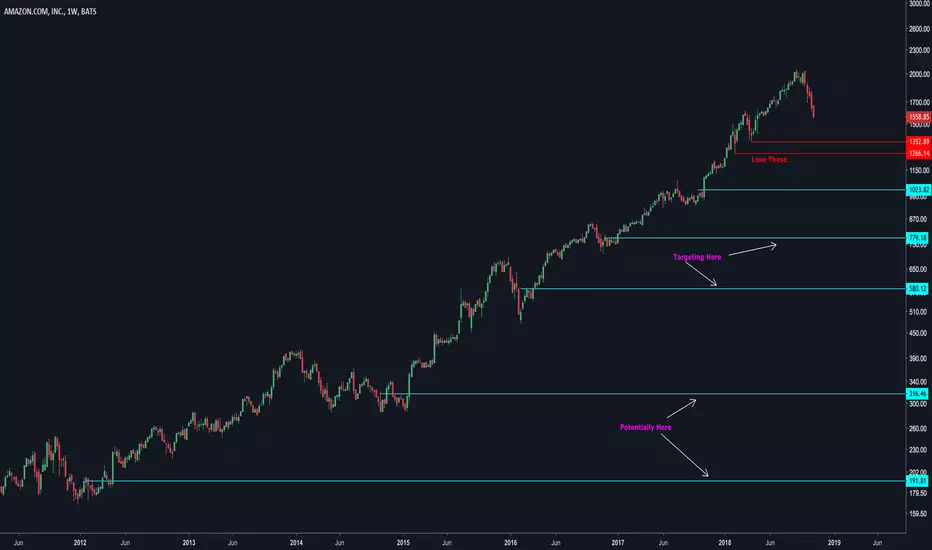
Amazon (AMZN) Is still a good shortMain idea on chart. The past AMZN trade is up 12% and my short trade is currently up over 4%. You can find both original ideas in the related section.
We can see this is probably not just a dip but a real trend change? If we do recover from this, keep in mind we are going to see a correction in the next few years.
Thanks for viewing!

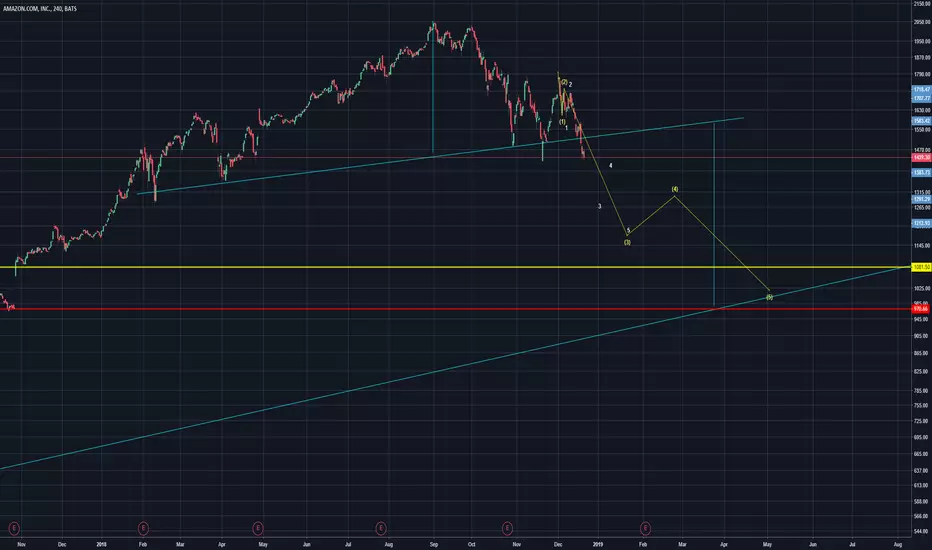
AMAZON - Burning - Cycle Wave 2- SHORTAMZN is a STRONG SELL.
Cycle Wave 1 has completed. Cycle Wave 2 is now beginning.
Near-Term (3 Months)
=$890
Will update.
-AB

AMAZON looking for a rebounceamazon correction should be done, hitting 3 years long support line + oversold rsi.

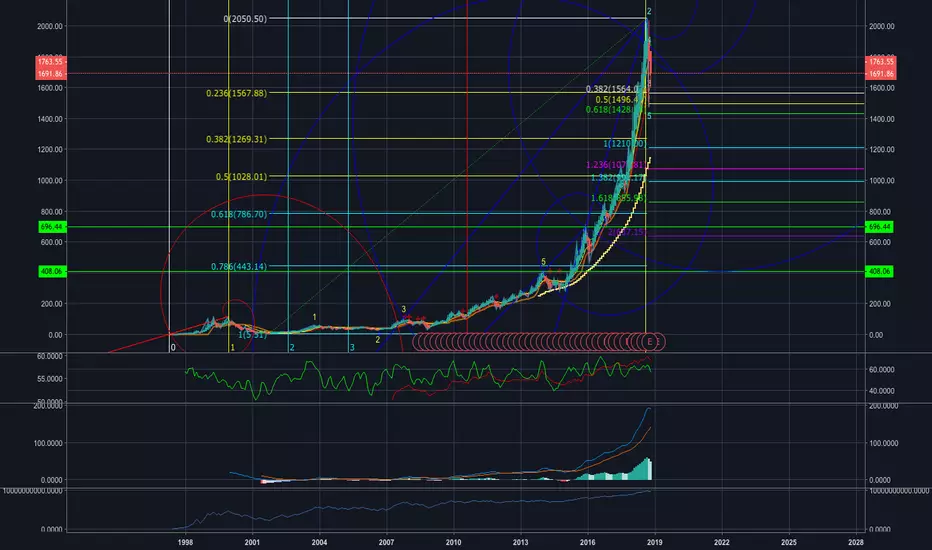
AMZN Long Term Potential DownsideAmazon went from 5 bucks to 115 nonstop during the dotcom bubble. 2000%+ uninterrupted growth. It collapsed back down to 5 bucks during the crash.
Since recovering, Amazon has gone from 100 bucks to 2000 nonstop the past 8 years. 2000%+ uninterrupted growth.
Losing these weekly levels below would be baaaad. Could stop at any of those levels below but theres downside to like 100 bucks.
2000%+ uninterrupted growth = Sketchy.
Amazon Elliott Wave View: Favoring More Downside $AMZN short-term Elliott wave view suggests that a decline to $1685.99 low ended black wave ((W)). The internals of that decline unfolded as Elliott wave Flat structure. Up from there, a bounce to $1856.92 high ended black wave ((X)) as Elliott wave zigzag correction. Where blue wave (A) ended in lesser degree 5 waves at $1809.88 high. A pullback to $1734.23 low in 3 swings ended blue wave (B). And finally, a push higher towards $1856.92 high ended blue wave (C) of ((X)) in another 5 waves.
Down from there, Amazon has made new lows already confirming the next extension lower in black wave ((Y)), thus favoring more downside. The initial decline to $1653 low ended in red wave W. Above from there we are calling red wave X complete at 1797 and as long as it stays below that level but more importantly below 1856.92 it should see more downside. We dont like buying it as the right side is to the downside.

AMZN - UPDATE - if anyone is interested :)i can see this going down
i am going to watch closely and see
what happens. will update you guys also
like, comment and follow :)

Amazon (AMZN) Good to shortI have been short Amazon since 1870 and am currently in good profit.
Amazon has been overvalued for a long long time. If people do not regain confidence in the stock it will drop much more.

AMAZON Weekly - This can only end wellBearish divergence on the MACD & RSI. Parabolic run up. Top resembles rising wedge.
New paradigm

Short AmazonSimply put, Over Bought EMA cross over, MACD divergence confirmed, Short at the structural neckline of the M, expect the M to confirm on the Daily but also to rebound at the 200 EMA
