Amazon Stock Heist: Thieves Targeting 247 Escape Point🔐💰 AMAZON HEIST PLAN – STOCK MARKET ROBBERY STYLE 🚀📈
👋 Hey Thief OG’s, Money Grabbers & Market Shadows!
Today’s mission is inside the vault of Amazon.com Inc. (AMZN) – and we’re planning a Bullish Heist.
🎯 ENTRY – Layering the Break-In 💎
The vault doors are always open for the thief gang!
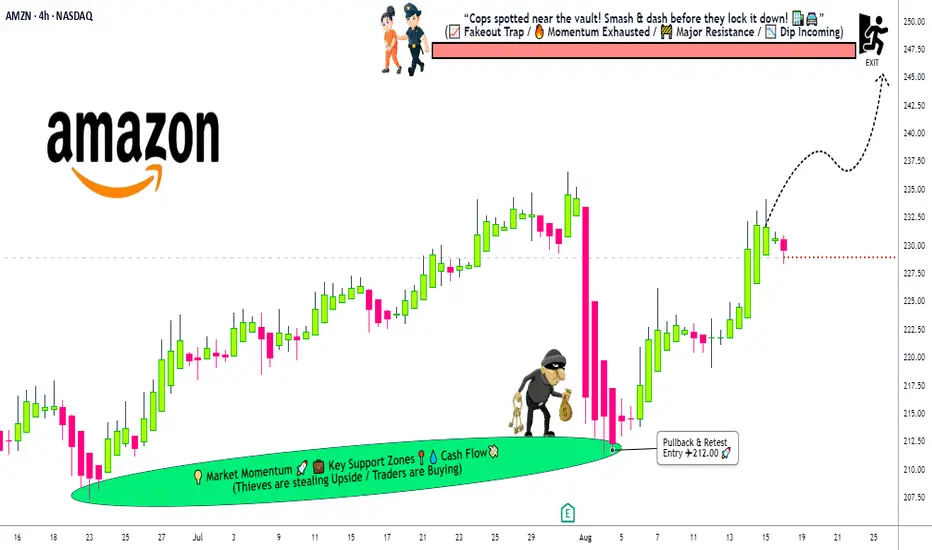
Place multiple Buy Limit Orders (layer entries) at 🏦:
230.00 / 227.00 / 225.00 / 222.00
You can add more layers to your heist plan based on your own risk appetite.
Thief strategy = stack the entries, wait for the pullback, strike big.
🛑 STOP LOSS – Thief Escape Route 🚔
This is the official Thief SL: @219.00.
But remember OG’s – adjust your SL based on your own strategy & bag size.
We don’t all run with the same loot.
🎯 TARGET – Police Barricade 🚨
Before the sirens ring, our escape bag is ready at @247.00.
That’s where we dump the loot and vanish into the shadows. 🏃💨💼
🕵️♂️ THIEF STYLE STRATEGY
✅ Layering entry method (multiple buy limits = thief stacking plan).
✅ Risk management = key to survival.
✅ Exit before the market police catches you.
💥 Remember OG’s: This is not financial advice – this is a robbery simulation in the stock market.
Support the gang 👉 Smash the Boost Button 💥 so our heist team gets stronger!
🤑💼💰 Every day, every chart, every loot = Thief Trader Style.
Stay sharp. Stay hidden. Stay profitable.
Amzntrading
AMZN Losing Momentum? Put Flow on the Table
# 🛒 AMZN Weekly Options Setup (8/18 – 8/22)
📉 **Consensus: Neutral → Cautious Bearish**
* 🔻 RSI trending down (daily + weekly)
* 📉 Weak volume = no strong institutional conviction
* ⚖️ 4/5 AI models → **NO TRADE**
* 🐻 Only **DeepSeek** calls for puts → bearish divergence
---
## 🎯 Trade Setup (Aggressive Play)
* **Instrument**: AMZN
* **Direction**: PUT (SHORT)
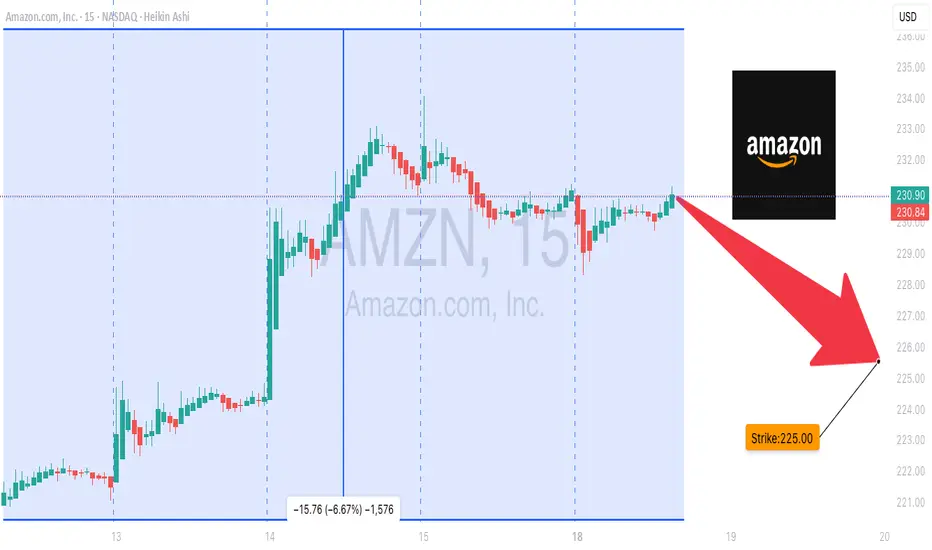
* **Strike**: \$225.00
* **Expiry**: 2025-08-22
* **Entry**: \$0.82
* **Profit Target**: \$0.98 (scalp style)
* **Stop Loss**: \$0.50
* **Confidence**: 65% (only because DeepSeek flagged momentum divergence)
* **Timing**: Enter at open → monitor closely (don’t baghold into Friday ⚠️).
---
## 📈 Breakeven @ Expiry
👉 \$224.18 (Strike – Premium)
AMZN must **close < \$224.18 by 8/22** to finish ITM.
But plan = **exit early on IV / momentum pop**, not expiry hold.
---
## 🧠 Key Risks
* Theta burn 🔥 (short expiry puts bleed fast)
* Market news swings (AMZN often reacts to macro headlines)
* Lack of volume → potential for chop instead of follow-through
---
# ⚡ AMZN 225P WEEKLY PLAY ⚡
🎯 In: \$0.82 → Out: \$0.98
🛑 Stop: \$0.50
📅 Exp: 8/22
📈 Bias: Weak, but playing the downside momentum divergence 📉
Amazon (AMZN) Shares Rise Ahead of Earnings ReportAmazon (AMZN) Shares Rise Ahead of Earnings Report
Today, 31 July, Amazon is set to release its quarterly earnings after the close of the regular trading session. Available data show that Amazon (AMZN) shares are exhibiting bullish momentum, reflecting positive market expectations:
→ In July, AMZN shares have outperformed the S&P 500 index (US SPX 500 mini on FXOpen);
→ Yesterday, following the end of the regular session, AMZN shares surged by approximately 3% in after-hours trading.
The rise in AMZN comes amid strong earnings reports from other tech giants, such as Microsoft (MSFT) and Meta Platforms (META). For example, MSFT shares rose by more than 8% in post-market trading. Their success has likely fuelled optimism that Amazon’s upcoming report will also impress.
All of this has brought noticeable changes to the technical outlook for the AMZN stock price.
Technical Analysis of the Amazon (AMZN) Chart
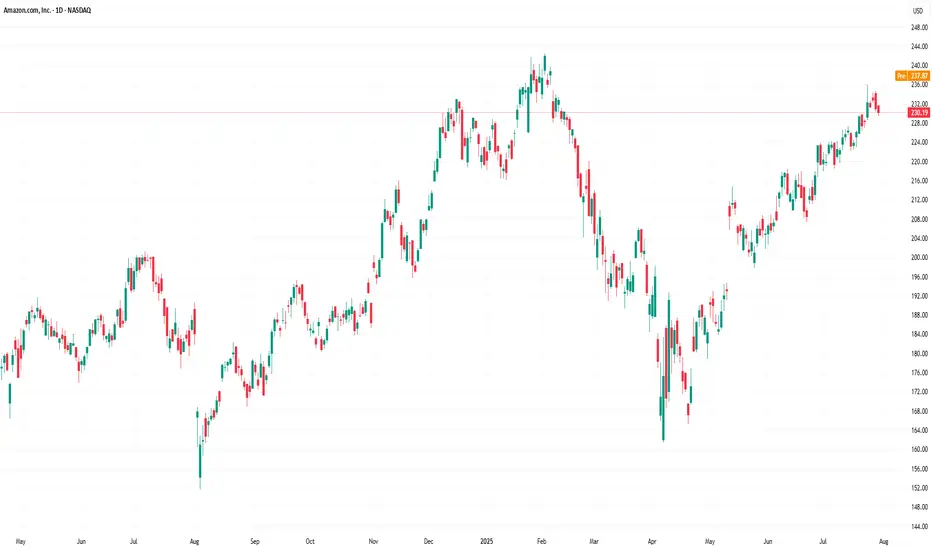
Following the release of the previous earnings report, price movements have formed an upward channel, as indicated by the Regression Trend tool. However, in recent days, a series of bearish signals emerged:
→ On Thursday, AMZN broke above the $230 level (marked by an upward arrow), but the session closed well below the highs – a sign of selling pressure;
→ Friday and Monday’s sessions produced candles with small bodies, indicating market indecision;
→ On Tuesday, bears took the lead (marked by a downward arrow), with a relatively long candle closing near the session low.
Thus, the chart gave reason to assume that optimistic sentiments were waning. However, today’s session is likely to open near the $237.30 level, effectively negating the bearish interpretation of the previous five candles and shifting momentum back in favour of the bulls.
In this context:
→ Support could be provided by the $230 level as well as the median of the Regression Trend channel;
→ Key resistance could be found at the previous high of $242.23 and the psychological level of $250.
Whether AMZN can surge to a new all-time high will largely depend on the company’s performance in AI – a theme that remains highly relevant in 2025.
This article represents the opinion of the Companies operating under the FXOpen brand only. It is not to be construed as an offer, solicitation, or recommendation with respect to products and services provided by the Companies operating under the FXOpen brand, nor is it to be considered financial advice.
AMZN at an all-time high: To be continued?AMZN reaches a new all-time high of $225.8, positioning itself at the upper boundary of an ascending channel that began on January 6, 2023, when it hit a low of $83.07. This channel, nearing its two-year milestone, has developed in five waves, as outlined by the Elliott Wave Theory:
Wave 1
Period: January 4, 2023 - September 14, 2023
Movement: $81.43 to $145.86 (+79%)
Wave 2
Period: September 14, 2023 - October 26, 2023
Movement: $145.86 to $118.35 (-19%)
Wave 3
Period: October 26, 2023 - July 8, 2024
Movement: $118.35 to $201.20 (+70%)
Wave 4
Period: July 8, 2024 - August 5, 2024
Movement: $201.20 to $151.61 (-25%)
Wave 5 (in progress)
Estimated period: August 5, 2024, to today
Projected movement: $151.61 to a range of $226.00 - $231.85 (+49% to +53% projected)
Key Questions for Caution on AMZN
Will it surpass the channel's upper boundary, setting new all-time highs?
Will it retrace to a dynamic support level within the channel (ranging between $201 and $195)?
Will it break below the ascending channel, signaling the start of a higher-degree correction?
Our opinion is for educational purposes only and should not be considered a recommendation to buy or sell. Before making any investment, consult with your financial advisor.

Amazon is in a long short race!Amazon is in a long short race!
This chart shows the weekly candle chart of Amazon stocks over the past two years. The top to bottom golden section of July 2021 is superimposed in the figure. As shown in the figure, the low point of Amazon stock in early January 2023 hit the 2.000 level of the golden section in the figure, and is now in the second largest wave of rebound, breaking through the 1.000 level of the golden section! The next strong pressure level for Amazon stocks is at 0.618 on the golden section in the graph!

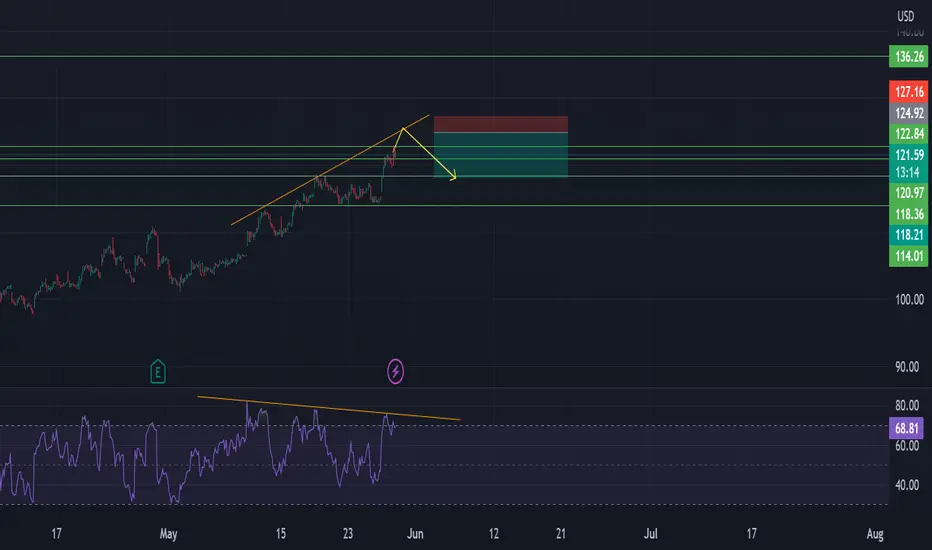
AMZN 45min trade- short position On the chart we can see a bullish trend, however Relative Strength index shows potential bearish divergence. We would enter a short position once the price reaches the upsloping line.
Stop loss: 127.52 USD
Target: 118.52 USD
Stay Away from AMZN NowTechnical Analysis:
- AMZN is still doing a WXY medium term correction in blue
- In the short term AMZN is finishing wave ((2)) in black before going more down side
- We expect that the correction will be finished at around BMV:60 when wave ((II)) is also completed
- H1 right side is turning up
- H4 right side is turning down
Technical Information:
- Don't buy AMZN now
- We like to buy when the correction WXY is done

AMZN is Still in a WXY Correction StructureAs we can see in the chart, Amazon(AMZN) WXY correction is in blue and we expect more downside to around $60 only when the wave (Y) in blue and Wave ((II)) in black are complete.
Technical Analysis:
- H1 & H4 Right Side are Turning Down
- Technically AMZN has now 5 waves down and has a strong correlation with NASDAQ - that's why we expect that it extends lower to around $60 where smart buyers will must appear and we'll like to do an edging buy.
