GOLD: $4000 on the way! Bulls has the controlGold is on the way hitting a record high since the global tension rising we can see gold creating another record high. Please note that it is a swing trades and may take weeks and months to hit the target or it may not even reach the target itself. This is prediction only so do your own due diligence.
Analyse

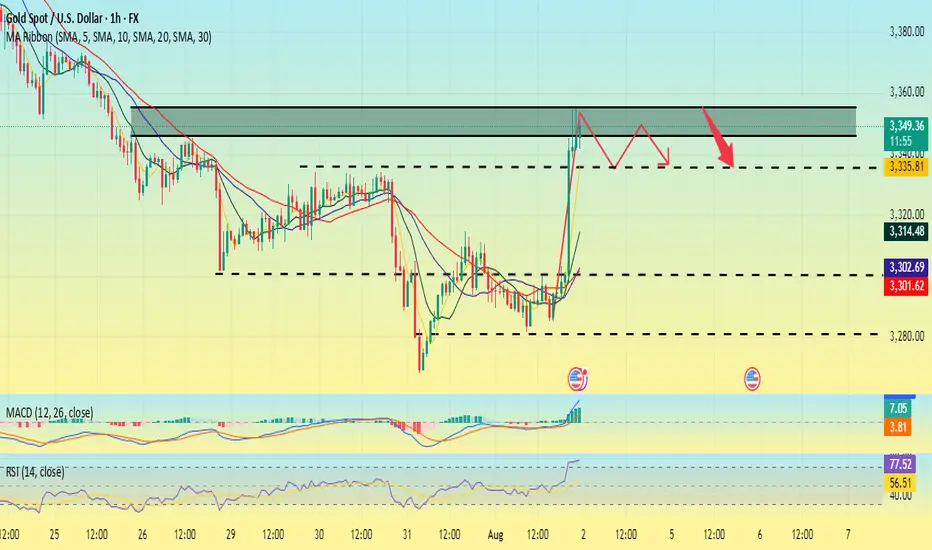
Is the uptrend complete? Will there be a pullback?On the last trading day of this week, gold prices soared, rising nearly $56, driven by the non-farm payroll data. The rally began at 3300 and peaked near 3356. The price has now retreated slightly, fluctuating around 3345.
The current uptrend has repeatedly tested the resistance level near 3355 but has failed to break through. The RSI indicator hovered around 76.8, indicating a gradual flattening of the upward trend. The 3355 high is likely the end of this uptrend.
As this is the last day of a major data week, Quaid believes the current uptrend is complete. Consider a light short position around 3350-3355. The current low has yet to be confirmed, and the pullback is likely to end around 3335.
However, we cannot rule out the possibility that the price will remain within the upward channel with slight fluctuations on the last trading day of the week.
Impact of the Non-Farm Payrolls? Latest Analysis.Information Summary:
Most traders are turning their attention to the crucial US labor market report, which is being closely watched as the market actively searches for new clues regarding the timing of the next interest rate cut this year.
The July non-farm payrolls report will be released at 8:30 AM US time. US non-farm payrolls increased by 110,000 in July, seasonally adjusted, lower than the 147,000 increase in June. The US unemployment rate is expected to rise from 4.1% to 4.2% in July.
If the non-farm payrolls figure falls below 100,000 and the unemployment rate rises, it could signal a weakening job market, undermining the Fed's rekindled hawkish outlook and dampening the dollar's upward momentum. In this scenario, gold prices could re-cross the 3,400 mark. However, if the non-farm payrolls unexpectedly exceed 150,000, it could support the dollar's continued rise and hurt gold. Strong US employment data could rule out two rate cuts from the Fed this year.
Market Analysis:
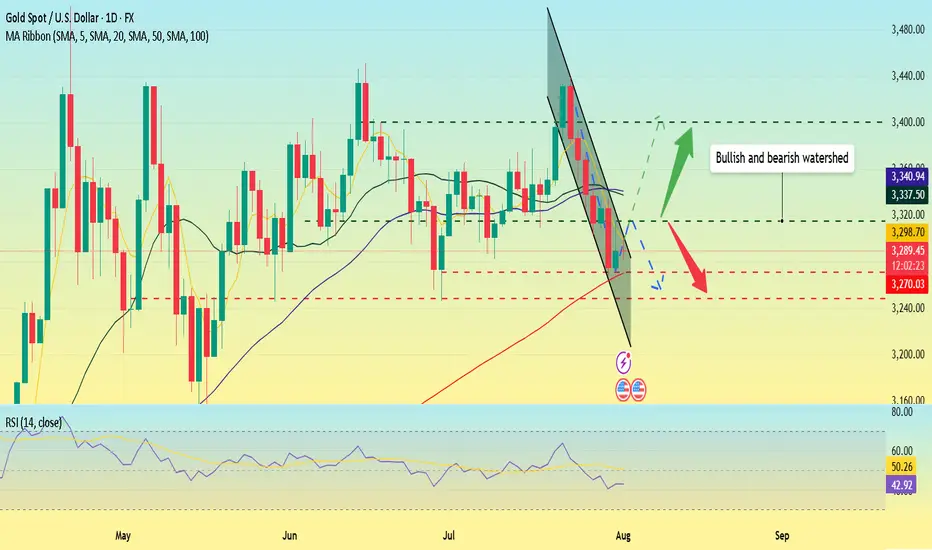
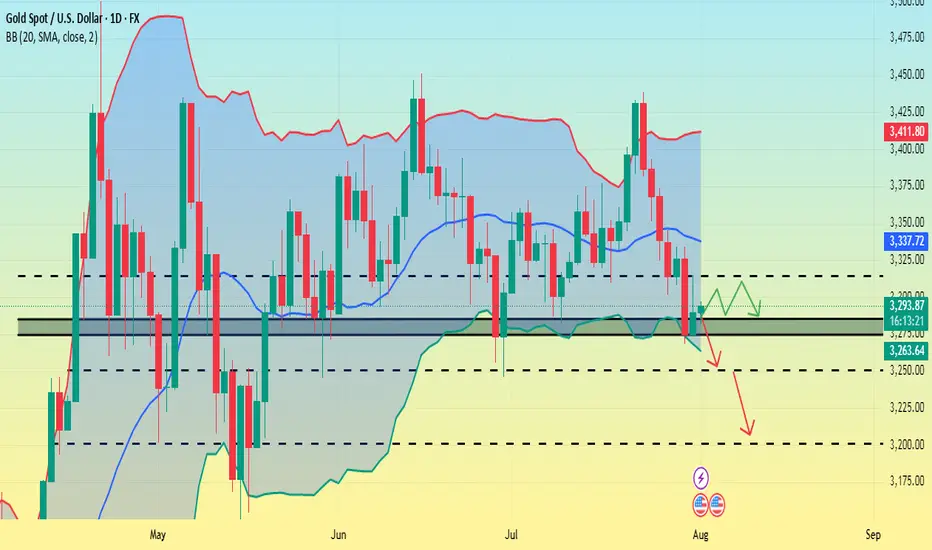
Quaid believes that the current moving average crossover is trending downward, and downward momentum is still in play. The RSI remains at 42.7, hovering below the midline, indicating that gold's downward trend remains intact. The 20-day moving average fell below the 50-day moving average on Wednesday, confirming the bearish momentum.
Therefore, if gold closes below the key support level of the 100-day moving average at $3,270 on a weekly basis, a new downtrend could begin, potentially leading to a drop towards the June 30 low of $3,248.
Quaid believes that the current bull-bear watershed needs to focus on around 3315, which is the previous intensive trading area and is also the first resistance position for short-term upward movement.
On the last trading day of Super Data Week, Quaid hopes that everyone has gained something and has a happy weekend; I wish you all good luck.
Non-farm payrolls are coming. What's the gold trend?Gold fell sharply on Wednesday, but Thursday's market didn't continue the downward trend as some investors expected. Instead, it showed a trend of rising and then falling.
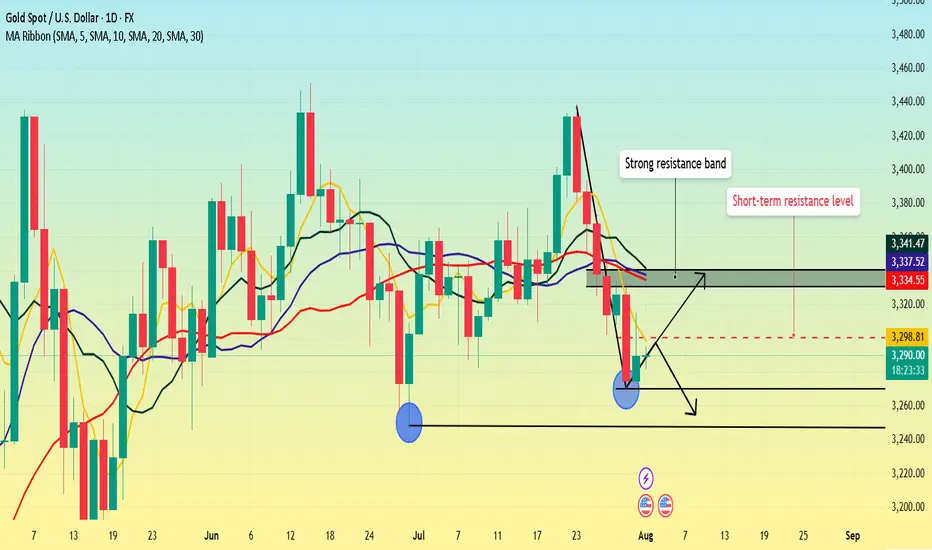
From the daily perspective, we first need to focus on the resistance level near 3300 where the 5-day moving average is located. This position is not only a short-term technical resistance, but also reflects the market's psychological expectations to a certain extent. If prices can successfully break through this level and stabilize above it, it will indicate that bullish momentum is strengthening, potentially boosting market sentiment. At this point, the next resistance area to watch is the 3330-3340 range. This area converges the 10-day, 20-day and 30-day moving averages, forming a strong resistance band.
As for the support below, the primary focus is Wednesday's low of 3268. However, if this level is lost and the price continues to fall, the next support area will be around 3245, which is the previous low.
Trading strategy:
Short around 3300, stop loss at 3310, profit range 3280-3260.
Has a bull market started? In-depth analysis.Friday's non-farm payroll report was unexpectedly disappointing, sending gold soaring.
Data released by the U.S. Department of Labor on Friday showed that non-farm payrolls added only 73,000 jobs in July, far below market expectations of 100,000. The weak employment report quickly shifted market sentiment regarding the Federal Reserve's policy path. Market expectations for a September rate cut have soared to 75%, with another cut expected before the end of the year.
This shift has provided strong support for gold prices. Amidst persistent inflationary pressures and disappointing employment data, a Fed rate cut would be a substantial boon for gold.
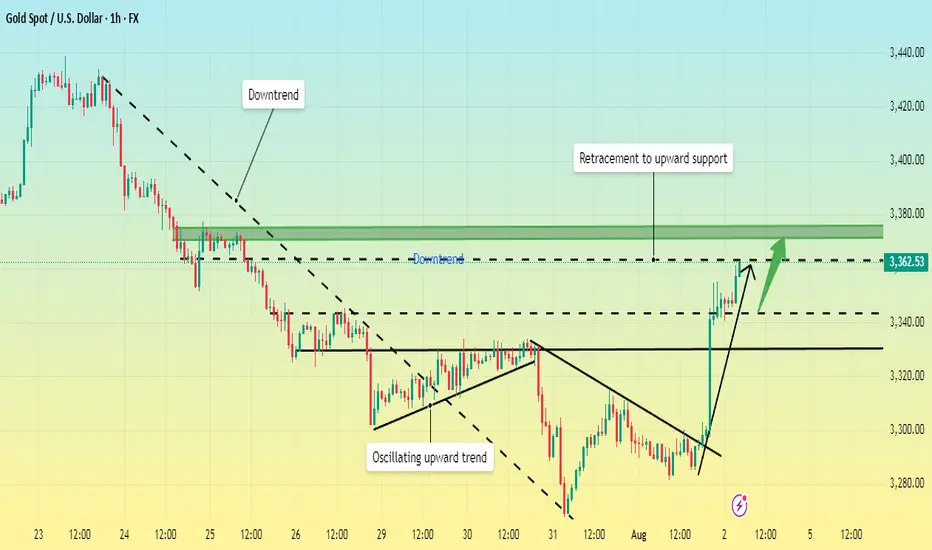
Friday's data triggered a sharp rise in gold prices on the daily chart, reversing a week-long decline. This is the first sign of a pattern that breaks a weak downward trend. Following consecutive declines, the daily chart began to rise, directly reversing a week's losses. This pattern is likely to continue next week, forming a bullish pattern, with a potential second leg higher. Therefore, next week will be crucial for bullish sentiment, with key focus on whether it can break through the highs and the continuity of the bullish trend.
The bullish trend is likely to continue next week. It's also important to note that Friday's pullback to around 3340 marked an inflection point, a watershed between bulls and bears and a secondary bullish level. Since Friday's close was near resistance, it's important to watch whether the market will surge directly next week or retreat before rising again. If the rally isn't sustained in the early Asian session, a correction is likely to occur, accumulating upward momentum.
Non-farm payrolls are coming. Will it trigger the market?On Thursday, the US dollar index briefly rallied after the Federal Reserve's favorite inflation indicator unexpectedly rebounded, crossing the 100 mark for the first time in two months. This marked the sixth consecutive trading day of gains and the first monthly gain since 2025.
Spot gold rebounded as risk aversion lingered amid uncertainty surrounding Trump's tariff deadline, reaching a high of around $3,315, but its intraday gains narrowed after the release of the PCE data.
The dollar has already firmly established itself above the 100 mark on the daily chart, so the next target is likely to be between 101.5 and 102.0. Currently, support levels on the daily chart are visible at 99.5 and 99.0.
The gold market is currently consolidating in the 3315-3275 range. However, if the dollar rises again, Quaid believes gold prices could fall below 3275.
On the daily chart, if it falls below 3275, the price would likely be around 3250. If 3250 falls below, the market could test 3200. However, the possibility of a consolidation between 3315 and 3275 remains undisputed.
Before the release of the non-farm payroll data, scalping within this consolidation range is advisable. However, the risk is relatively high, so please take profits in time.
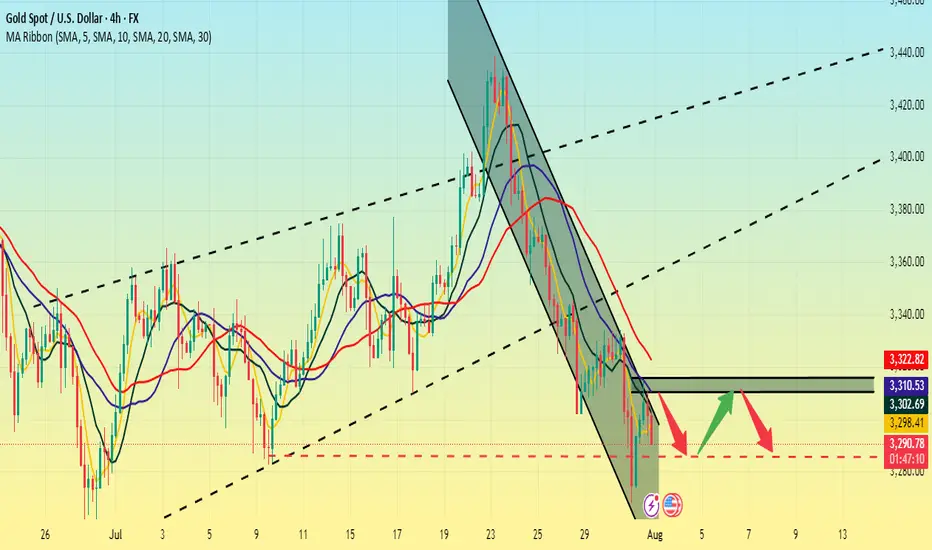
The US dollar is strong. Be wary of gold.The US dollar index rose, now above 100, before retreating slightly and fluctuating slightly, reaching 100 for the first time in two months. After a sharp drop to around 3270 on Wednesday, gold rebounded sharply today. With the US dollar breaking through 100 and the USD/JPY pair breaking through 150, gold is now struggling to maintain its position.
Thus, Quaid believes it's not appropriate to be overly bullish on gold for now. A significant decline is likely.
The 4-hour chart shows that the upper moving average resistance is currently around 3310-3315. If it breaks through 3315, it could potentially move towards 3325.
Conversely, if it fails to break through 3315 today, it could continue to consolidate in the 3315-3285 range. Waiting for new data to guide its trend.
AVAXUSDT Trend Analysis | Will Volume Confirm the Next Big Move?AVAXUSDT Trend Analysis | Will Volume Confirm the Next Big Move?
🔍 Let’s break down the AVAX/USDT setup, examining its technical structure and mapping out key opportunities as it gears up for a decisive move.
⏳ Daily Overview
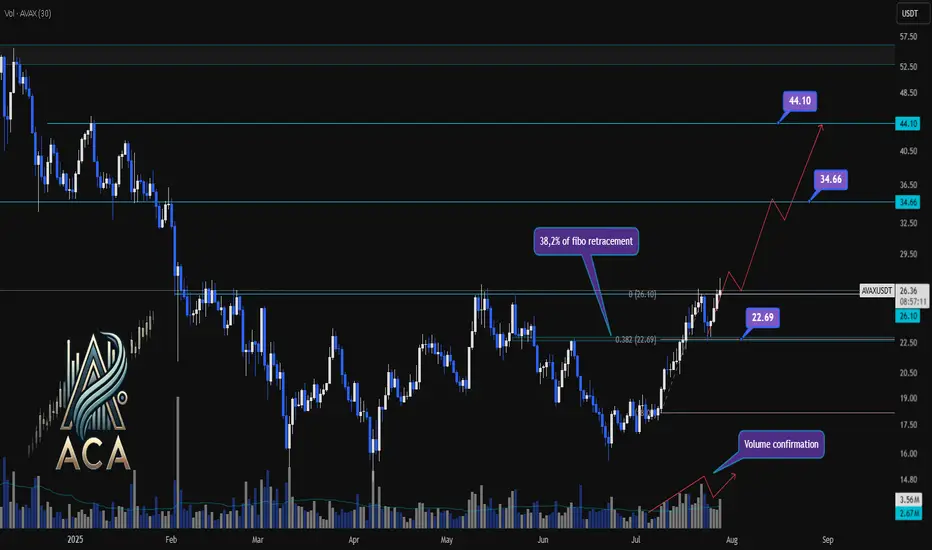
AVAXUSDT has been exhibiting a bullish structure, recently reacting to the 0.382 Fibonacci retracement level (around 22.69USDT) where price paused for a correction. This correction was technically healthy, as it occurred with declining volume, while upward impulses were marked by notable volume surges—signaling strong bullish participation and confirming accumulation phases.
🔺 Bullish Scenario:
The next area to watch is the resistance at 26.10USDT, which has acted as a major barrier in recent trading sessions. A decisive daily close above this level—preferably supported by a clear uptick in volume—would confirm breakout momentum and set the stage for further advances.
Upon confirmation, the chart points to medium- and long-term targets at 34.66USDT and eventually 44.10USDT. These levels are derived from key Fibonacci extensions and historic price reactions, offering logical take-profit zones for trend-following strategies.
📊 Key Highlights:
- 0.382 Fibonacci level (22.69USDT) acted as a reaction zone and healthy correction point.
- Volume profile validates trend: increased buying volume during upswings, decreased volume on dips.
- 26.10USDT is the next crucial resistance for confirmation.
- Breakout (with volume) opens path to 34.66USDT and 44.10USDT targets.
- Failure to clear 26.10USDT could result in consolidation or another retest lower.
🚨 Conclusion:
All eyes are on the 26.10USDT resistance. Wait for a clear daily close and volume confirmation before considering entries. A breakout above this level could propel AVAXUSDT towards higher Fibonacci targets, while a rejection may prompt another retest of prior supports or consolidation.
Stay sharp and plan your trades with discipline!
Gold remains unchanged. Still weak.Last Friday, gold rebounded around 3373, but the bullish momentum was insufficient, and then it bottomed out and fell sharply. The price fell below the short-term rising trend line support. At present, the MA5-10 daily moving average is in a high dead cross short arrangement. On this basis, Quaid believes that gold can still be bearish now. At present, the Asian market continues to fluctuate downward in the early trading. Today, we will focus on the support of 3310-3300.
The short-term price is currently maintained at around 3335, which can be regarded as the watershed between long and short today. If the European session stabilizes above the MA50 moving average, the trend will change to a certain extent. Now we still look at the bottom near 3300.
Operation strategy:
Short near 3340, stop loss 3350, profit range 3310-3300.
Gold is weak. It may break through next week.This week, gold rose and fell, rising for two consecutive days on Monday and Tuesday, and falling for three consecutive days from Wednesday to Friday. The weekly line finally closed with a small real body negative line with a long upper shadow.
Gold's trend this week was due to the strengthening of the US dollar and the progress in US-EU trade negotiations, which hit the safe-haven demand, leading to a decline in gold prices.
Next week, focus on multiple time points that may trigger market trends, including the Federal Reserve's decision, non-agricultural data, the August 1 tariff deadline, and the economic and trade talks between Chinese representatives in Sweden and the United States. These events may set the tone for the market in the second half of the year and need to be paid attention to.
At the beginning of this week, we focused on the triangular convergence pattern formed by the high and low points since 3500 points. On Tuesday, gold broke through the pattern upward, but failed to stand firm on Wednesday. Instead, it fell to form a false breakthrough, and on Friday it fell to the lower edge of the triangular convergence range. However, from the perspective of the international futures market, the overall situation is still in the triangular convergence pattern and has not achieved an effective upward breakthrough. Based on this, we need to continue to keep a close eye on the changes in the triangle convergence pattern next week. The direction of its next breakthrough will have an important impact on the short-term trend.
Operation strategy:
Short near 3350, stop loss 3360, profit range 3320-3315. If the price continues to fall, you can hold a small position, and the area near 3300 is likely to be touched.

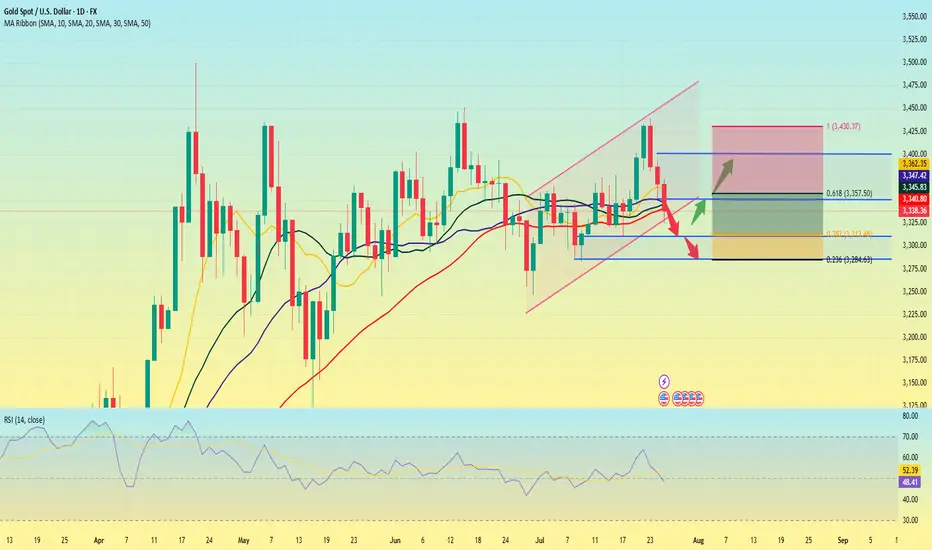
Gold is weak. Will it explode next week?Gold prices failed to stabilize above $3,400 after a bullish breakout this week. The technical outlook highlights the recent indecision of gold bulls.
In the first two trading days of this week, spot gold prices rose by 2.4%, but the cumulative decline in the last three trading days of this week reached nearly 3%. The sharp fluctuations this week were due to the positive progress in Trump's trade negotiations, and the rebound in market risk appetite, which hit the safe-haven demand for gold.
Looking at next week, the economic calendar will provide several high-impact data releases. The Federal Reserve will announce its monetary policy decision after the policy meeting on July 29-30; the US Bureau of Labor Statistics will release the July employment report; and some important news such as the US-China trade negotiations may trigger the next major move for gold.
From a technical perspective, the current market short-term technical outlook highlights the hesitation of gold buyers. The daily chart shows that the RSI is still slightly below 50, and gold prices have difficulty staying away from the 20-day and 50-day MAs after breaking through these two levels earlier this week.
On the upside, 3450 constitutes the first resistance for gold prices. If it breaks through this resistance, gold prices will most likely hit the 3400 integer mark again.
On the downside, if gold prices remain below 3340, technical sellers may still be interested. In this case, 3310 can serve as the first support level, followed by the second support level near 3285.
A new week is about to begin, and I wish all traders good luck.
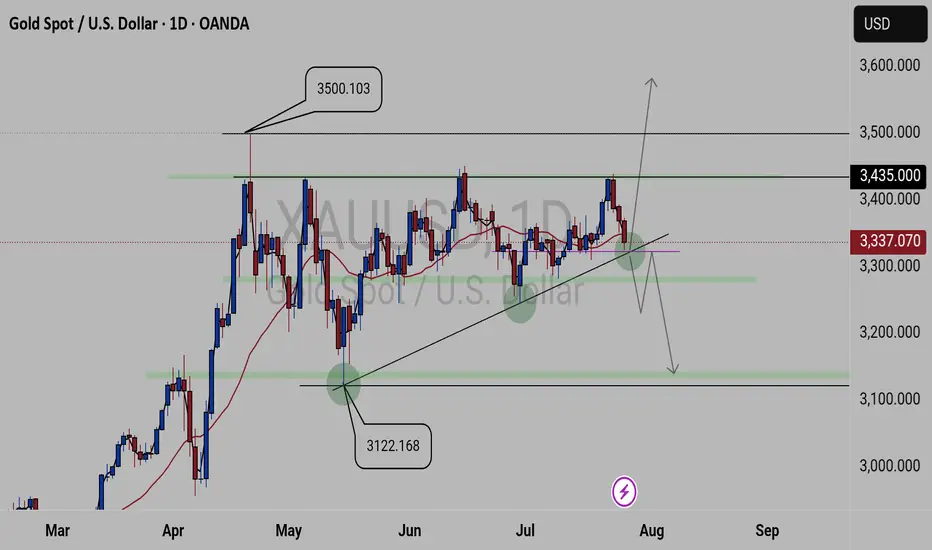
XAUUSD FORECASTThis is what we currently see on
GOLD.
We have 3500.103 key level as our current high zone and 3122.168 key level as our low zone. And Gold is been attempting to break 3435.00 key level resulting in selling, but been creating lower highs failing to break the created lows. Currently we a trading above the 3337.070 key level which is a critical key level, as it will determine the next coming movement.
Update will be given
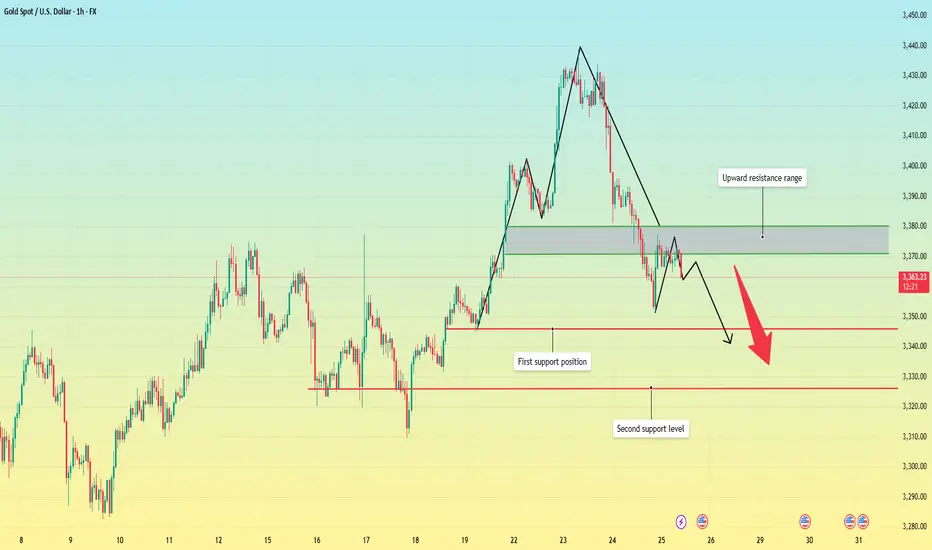
Gold is going down. It may continue next week.On the last trading day of this week, the bears attacked strongly and continued to refresh the recent lows, reaching the lowest point near 3325 before stopping.
From Monday's 3345 to 3440, it closed near 3337. This week, it also walked out of the large range roller coaster pattern, and all the strengths in the previous period did not exist. Under the continuous downward trend, the bulls were also vulnerable, and there was not even a strong rebound, which indirectly explained the strength of the bears in the short term.
As for the current trend, the bears are likely to continue to be strong, and before there is a symbolic upward breakthrough, we still need to maintain the idea of shorts to operate. The current upper pressure is maintained near 3350, which is also the bottom position touched for the first time in the previous period. It is possible that it will be transformed into a top-bottom conversion pattern; and the strong support level below is near 3310.
When the Asian market opens next Monday, we need to pay close attention to whether there is a gap problem on both the bulls and bears. After three consecutive negative daily lines, all the moving average systems have been broken, and it is also likely to form a resonance pressure pattern. On Monday, gold will first touch around 3350 and continue to short. The profit range will be around 3330-3320, and the stop loss will be 3360. If the European session is stronger, you can adjust the point before the US session.
Gold fluctuated downward. Or it will continue.Gold was blocked near 3393 in the early trading on Thursday and began to fluctuate and fall, falling to 3351 as low as possible, then stopped falling and rose, and after rebounding near 3377, it was blocked and fell back to 3370 and fluctuated up and down, and the daily line closed with a negative line.
After three consecutive positive rises from last Friday to Tuesday this week, gold ushered in a turning point on Wednesday. On Thursday, it continued to fall and broke through the 5-day and 10-day moving averages, and the short-term market weakened. From the overall structure, the rising channel since June 26 remains valid. The highs on Tuesday and Wednesday approached the upper edge of the channel and then fell. The current price turned to fall and approached the lower edge of the channel.
There are two key positions for the support below: the first support level is near 3345, which is the lower edge support of the current rising channel; the second support level is near 3325, which is the trend line support formed by the connection of the previous low points.
From the 4-hour chart, the 3351 low point and the rebound resistance level can be used as a reference for today's long-short game. The breaking of key support and resistance will determine the trend direction of the next stage.
Operation strategy:
Short near 3375, stop loss 3385, profit range 3350-3330
Long near 3330, stop loss 3320, profit range 3350-3370
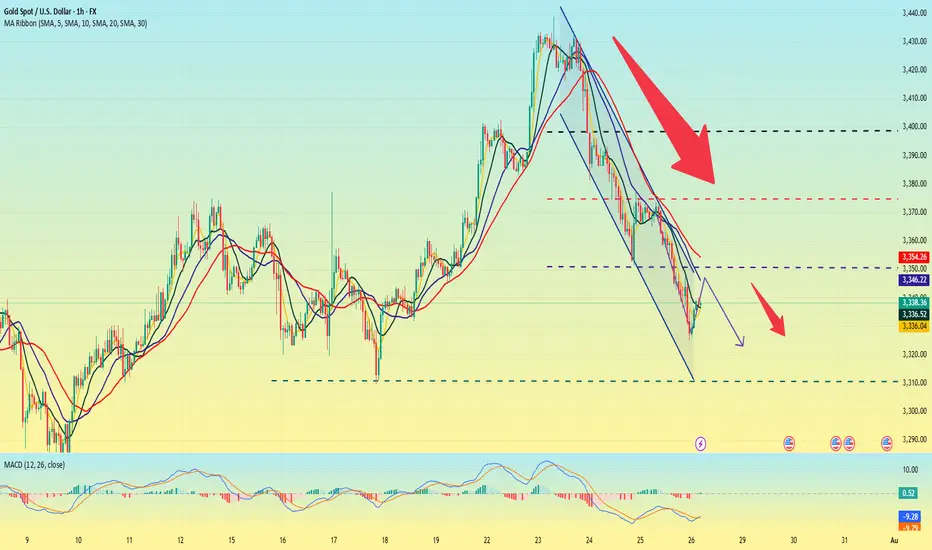
Excellent profits secured 180 pips TP HitAs I mentioned Today's commentary on London session:
My strategy is still the same – sell from 3370-3373 which the market respects well and as our first target was 3355 then 3348 on pending
Very happy with the profits so far alhumdulliah
My medium-term targets remain 3355 which is achieved and 3345 is pending alhumdullilah. I sold gold from every local high.
Also I mentioned 3375 turns retest and I opened my sell trades on down side
All I say thanks to those who followed us and made profits.
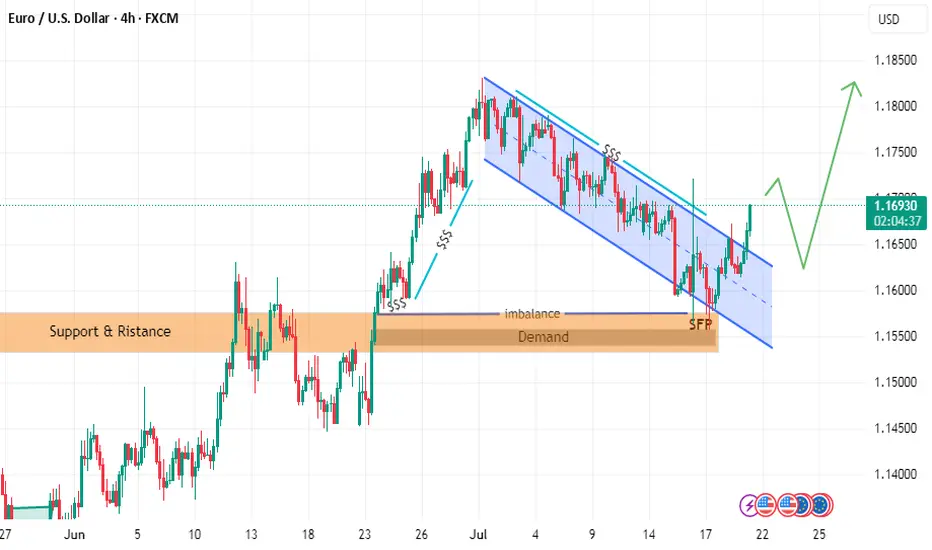
follow EURUSD LION & PLANE BUY SETUPTHE PRICE has moved as I explained in the last two posts
but we have some update to go along the way
the price could break failing channel
and withdrawal liquidity and filled imbalance
hence reflect from demand zone with zero reflection as i explained in last post with rock and plane
and it will go up to take liquidity in failing channel or downtrend
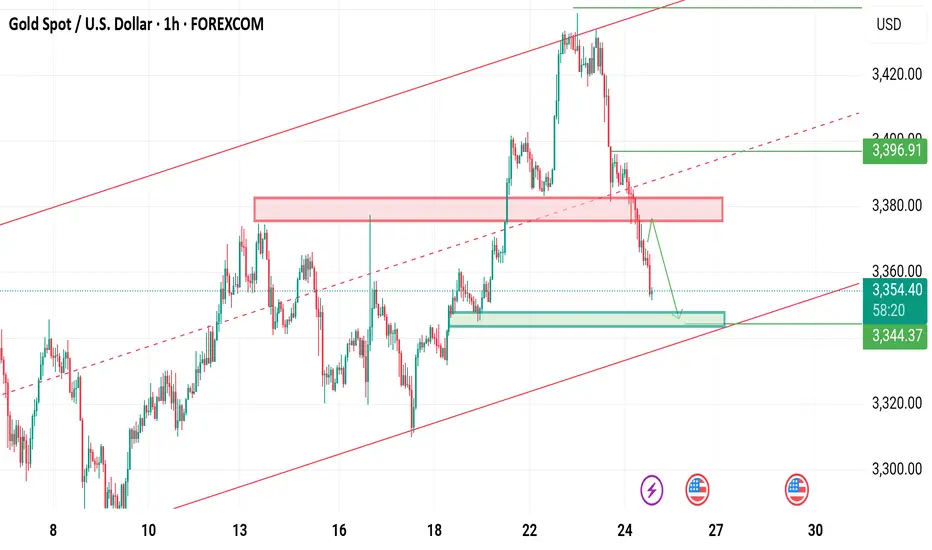
Gold peaked in the short term. Welcome a new trend?The previous rising structure of gold was broken, especially yesterday's rapid decline broke through the previous support of 3385. Although it rebounded slightly, it was difficult to change the adjustment. Yesterday's high point of the US market was at 3396-98 US dollars. Today, the adjustment trend continued. The dividing point between long and short is 3395 US dollars today. Before the price reaches here, do not consider long.
Many traders are confused. Why are there longs one day and shorts the next day? In fact, this is the characteristic of the volatile market. Breaking the key position cannot last. No matter what you think about the market, you must pay attention to the current shape changes. In the volatile market, you should consider the market of the day more, not the long-term direction.
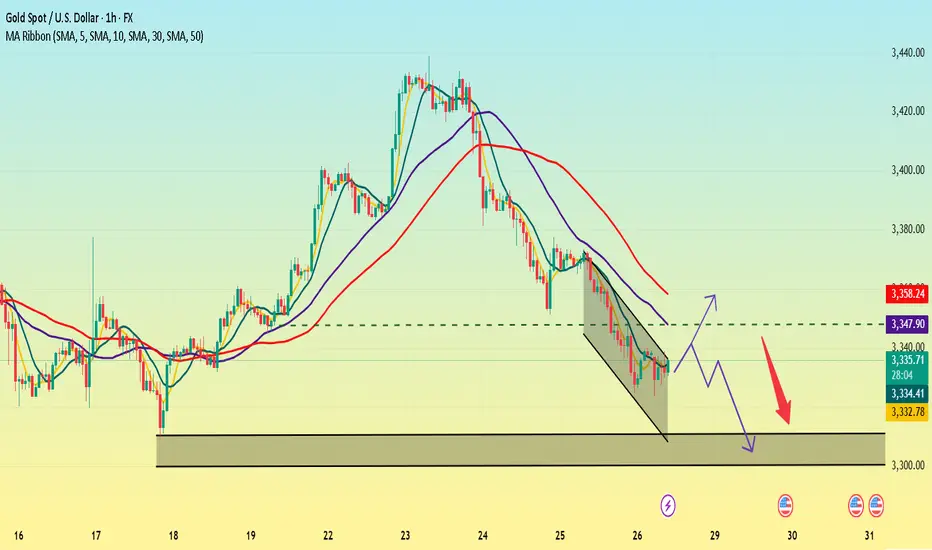
From the 1-hour chart, the gold price rebounded near 3390 and shorted, and the profit range is 3370-3350.
The backup strategy is to break through 3400 and go long, and pay attention to 3415-3425 on the upside.
In other words, look for opportunities to short on a rebound below 3400 today, and adjust your thinking after breaking through the key resistance.

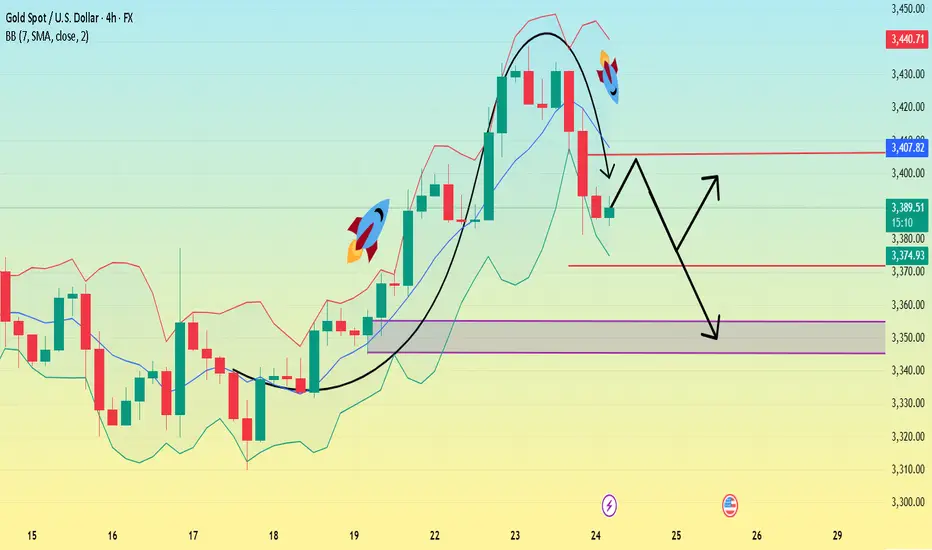
Gold is weak. Will it continue to fall?Yesterday, the price of gold did not continue to rise as strong as in the previous two days. After reaching the previous top position, it began to retreat under pressure.
The market is too bullish, and under this pattern, the market is likely to have an unexpected reversal. Yesterday, it fell below the 3400 integer mark, so it is likely to maintain a volatile downward trend in the future.
The current main support level is around 3370, which is also the primary point for the bears to continue to break down in the future. Once it falls below this position, the target may be around 3345-3355. It cannot be said that it has completely turned to a bearish position at the moment. It is just a bearish oscillation pattern within a large range, and the upper pressure is maintained near 3405, which is also the support point for the first downward step of the bears on Wednesday.
Today, we still need to operate around the short position first. The price rebounds to 3405 and shorts, and the profit range is around 3390-3380, and the stop loss is 3415.
After a new low appears in the European session, wait for the US session to rebound and continue shorting.
XAUUSD on bearish retest sellGold is currently still holding rising channel along with the swing moves we were on sell throughout from yesterday and my 1st Attempt on sell achieved with 200 PIPs Tp now I'm expecting the again reversal retest move!!
What's possible scanarios we have?
▪️I opened again sell opportunity from 3420-3425 area by following our structural retest strategy, my Selling trade target will be 3405 then 3395 in extension.
▪️if H4 candle closing above 3435 this Parallel moves will be invalid.
#XAUUSD
Gold is bullish and bearish. Will it continue?From the daily chart:
The moving average is bullish, and the MA5-day, 10-day, and 30-day moving average supports move up. The 3380 dollar has turned from resistance to strong support. If this position is maintained, the upward channel will continue. The support position is 3380-3375, which is the top and bottom conversion position, and is also near the middle track of the Bollinger Band.
From the four-hour chart, the MACD red column shrinks and the RSI is near 60, and the bulls are still dominant. If the price falls back to the 3375-3380 area and stabilizes, it is expected to attack the 3400 mark again.
Operation strategy:
Long operation:
Steady type: When the gold price falls back to the 3375-3380 area, long orders are arranged in batches, with a stop loss of 3365 and a profit range of 3400-3410.
Aggressive: If the price breaks through 3400 quickly and falls back to around 3395, you can chase long with a light position, stop loss at 3388, and the profit range is 3420 strong resistance area.
Short operation:
Resistance area test short: 3408-3415 area, light position short order, stop loss at 3422, profit range 3390-3380.
Break short: If it falls below the 3375 support and the rebound is weak, follow up with short short, profit range 3360, stop loss 3385.

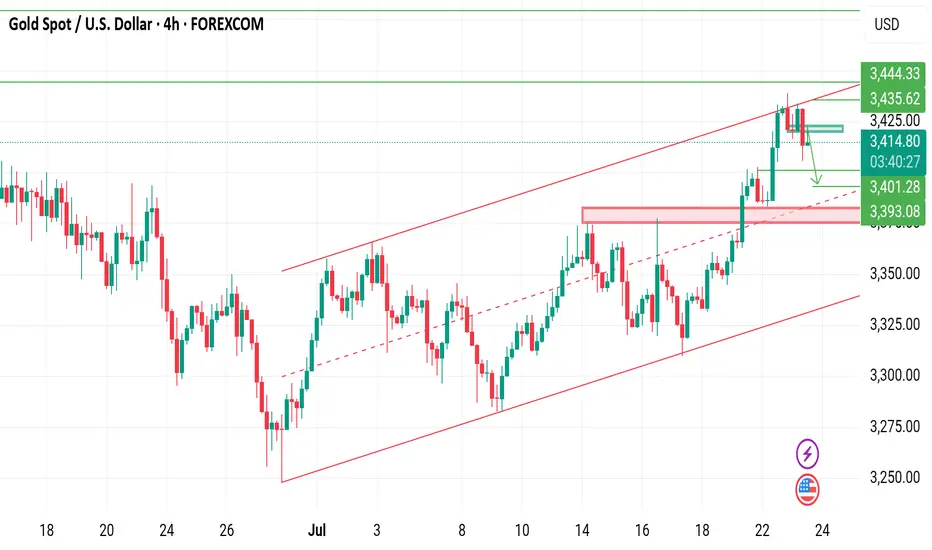
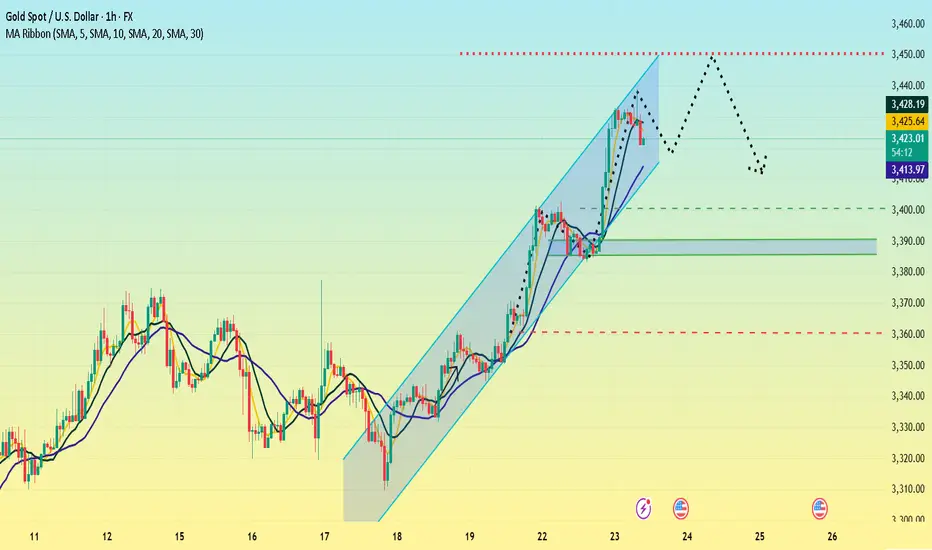
Gold (XAU/USD) 4‑Hour Technical Analysis: July 23, 2025Gold continues to trade in a bullish structure on the 4‑hour timeframe, holding above $3,420 after a steady advance from early July lows. At the time of writing, XAU/USD stands at $3,423.8, confirmed by Investing.com. This analysis employs a comprehensive blend of globally‑recognized technical tools — ranging from price action and classical indicators to institutional concepts — to identify the most probable trading zones and a high‑conviction setup.
Current Price Structure and Trend
On the 4‑hour chart, gold maintains a clear bullish market structure, consistently printing higher highs and higher lows since early July. The current price action unfolds within a well‑defined rising channel, bounded approximately between $3,400 on the lower side and $3,450 on the upper. Twice in the past week, price has tested and respected the channel’s lower boundary, confirming its validity.
Support and resistance levels are evident: immediate support lies at $3,410, coinciding with the 50% Fibonacci retracement of the July impulse wave. Below that, $3,390–$3,395 offers secondary support at the channel’s base and a longer‑term Fibonacci cluster. Resistance is concentrated at $3,445–$3,450, aligning with the channel top, upper Bollinger Band, and prior swing highs, while a secondary ceiling may emerge near $3,468–$3,470, corresponding to an Elliott Wave 3 extension target.
Candlestick, Volume, and Momentum
Recent price action has been supported by bullish candlestick formations. Notably, a strong bullish engulfing bar formed at $3,410 earlier this week, affirming institutional demand at that level. Volume profile analysis shows the heaviest transaction cluster between $3,410–$3,420, confirming this area as a smart money accumulation zone.
Volume‑weighted average price (VWAP ) currently runs near $3,418, with price holding above it, reflecting institutional positioning in favor of the bulls. Momentum indicators support the trend: MACD on the 4‑hour has just crossed bullish, RSI prints at 60 — strong but not overbought — and ADX climbs to 24, indicating a trend strengthening phase.
Indicators, Patterns, and Institutional Concepts
Trend indicators reinforce the bullish view. The 50‑ and 100‑period exponential moving averages converge around $3,415–$3,420, providing dynamic support. Ichimoku analysis shows price well above the Kumo (cloud), with a bullish Tenkan‑Kijun configuration. Bollinger Bands are widening, and price is leaning toward the upper band — a classic signal of volatility expansion in trend direction.
Classical and harmonic patterns offer further evidence. The current consolidation resembles a bull flag, suggesting continuation. Elliott Wave analysis points to a third wave in progress, with an upside projection into the $3,448–$3,468 area. Smart money concepts confirm that the recent break above $3,420 constituted a bullish break of structure (BOS), with price now retracing into a favorable gap (FVG) and a 4‑hour bullish order block anchored around $3,410–$3,415.
Liquidity and stop‑clusters likely sit above $3,445 and $3,468, making these logical targets for bullish campaigns.
Market Context and Sentiment
Gold is benefiting from a softening US dollar and a drop in volatility indexes. Seasonal tendencies also lean bullish into late summer. Sentiment on professional platforms aligns with this view: TradingView top authors and FXStreet analysts favor buying pullbacks into $3,410–$3,415 and targeting $3,450–$3,468, which harmonizes with this analysis. No major divergence from consensus is noted, adding to confidence.
Identified Trading Zones
Two strong buy zones emerge on the 4‑hour chart. The most immediate and highest‑confidence zone is $3,410–$3,415, supported by channel support, Fibonacci retracement, VWAP, moving averages, and an order block. Below this lies a secondary buy zone at $3,390–$3,395, tied to deeper Fibonacci support and the rising channel’s lower boundary.
On the other hand, clear sell zones are defined at $3,445–$3,450, where upper channel resistance, Bollinger bands, and prior highs converge, and a secondary zone at $3,468–$3,470, aligned with wave targets and round‑number psychological resistance. These areas are likely to attract profit‑taking and potential reversals.
The Golden Setup
Among the findings, one trade stands out as the highest‑conviction setup:
A long position at $3,415, with a stop loss at $3,405 and a take profit at $3,450.
This trade is backed by strong confluence: price pulling back into a well‑defined demand zone ($3,410–$3,415) that features order block support, Fibonacci retracement, VWAP alignment, EMA cluster support, and a rising channel boundary. The target sits just below the first significant resistance band ($3,445–$3,450), offering a favorable risk‑to‑reward ratio. The confidence level on this setup is rated at 8/10, given the multi‑method alignment and consistent sentiment from professional sources.
Summary Table
Category Levels / Details
Buy Zones $3,410–$3,415, $3,390–$3,395
Sell Zones $3,445–$3,450, $3,468–$3,470
Golden Setup Long @ $3,415 / SL $3,405 / TP $3,450 (Confidence: 8/10)
In conclusion, gold maintains a constructive technical outlook on the 4‑hour timeframe. The prevailing bullish structure, reinforced by classical and institutional methodologies, supports a continuation toward the $3,450–$3,468 region. The suggested Golden Setup provides a disciplined, high‑probability entry at a key inflection zone, consistent with both technical evidence and prevailing market sentiment.

Gold stabilizes. Sets a new high?Gold continues to rise, with uncertainty in trade negotiations and the outcome of the Federal Reserve meeting being key variables. If no agreement is reached before August 1, the high tariffs imposed by the United States on major trading partners may trigger greater risk aversion demand, pushing gold prices further up; if the negotiations make a breakthrough, the market risk appetite will rebound, and gold prices may face correction pressure.
Gold has shown a strong upward trend recently. It closed with a small positive on Friday last week and closed with positive for two consecutive trading days this week, forming a three-day positive trend, with strong short-term momentum. In terms of indicators, the moving average diverges upward, with obvious bullish trend characteristics, and the support below needs to focus on the moving average performance. At present, the gold price has broken through the trend line formed by connecting the previous high points. The primary focus on the upside is near the previous high of 3452, which is an important short-term resistance level. The upper focus is on the previous high of 3452, which is an important short-term resistance level.
The first support below is the 3390-3385 area, which is close to yesterday's low and is also an early trading intensive area. The second support focuses on the vicinity of 3360.
In terms of operation, it is still mainly low-long, and short selling is not considered before the upward trend reaches 3450.
Operation strategy:
Short around 3450, stop loss 3460, profit range 3430-3310
Long around 3400, stop loss 3390, profit range 3420-3430
GOLD: Price Made A New HHLooking to buy gold, market structure is bullish on the H1 and H4. I went over 2 different scenarios in the video...
1. Pullback Entry (Preferred)
🟢Entry Zone: 3365–3380
TP1: 3432
TP2: 3450
TP3: 3475–3500 (extended target if momentum holds)
2. Breakout Buy (Aggressive)
Trigger: M15 breaks and closes above 3405–3410 with strong displacement.
Entry: Retest of breakout zone at 3402–3405
Same Targets
Don't forget to set those price alerts!
