"EUR/USD Technical Blueprint: Bullish Continuation EUR/USD Technical Blueprint: Bullish Continuation Patterns and Strategic Price Zones Explained
🔹 Market Structure & Trend
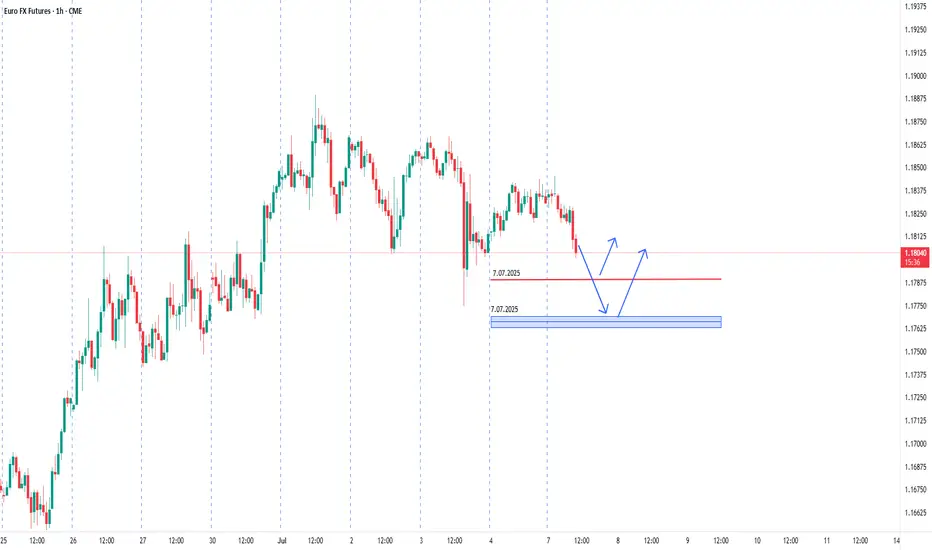
The chart shows a clear shift from a ranging phase into a bullish breakout:
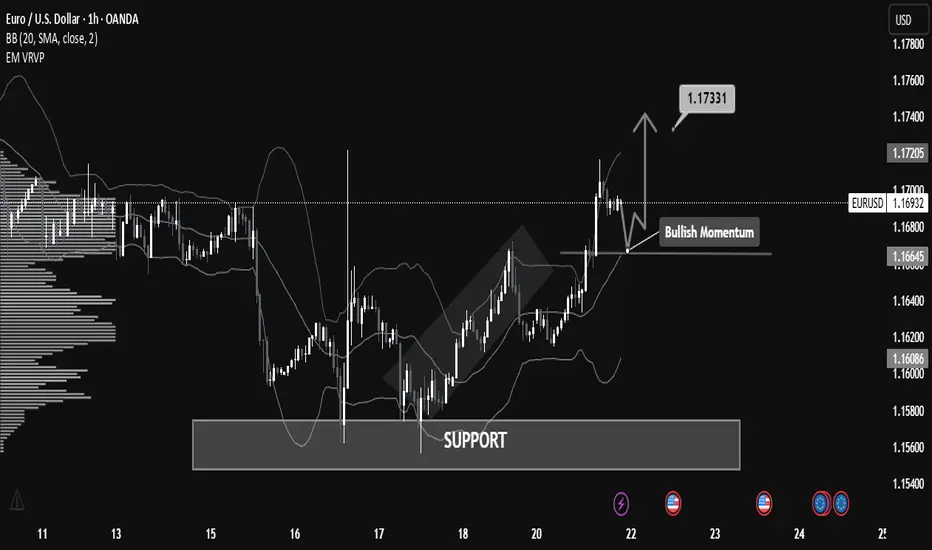
Price previously consolidated in a broad horizontal channel, with a strong demand zone (support) established between 1.16000 – 1.16600.
Following a deep liquidity grab on July 17-18, the price bounced sharply from support, creating higher highs and higher lows – a classic bullish structure.
Current momentum shows bullish continuation, as the price broke above local resistance around 1.16645 and is now forming a potential bull flag or bullish pennant pattern.
🟢 Bullish Momentum Confirmation
Price is currently retesting the broken resistance (now acting as support at 1.16645).
If the support holds and bullish momentum continues, the measured move target projects a price move toward 1.17331, the next significant resistance level.
This is also supported by increased volume activity in the breakout zone, as seen on the VPVR.
📊 Key Technical Levels
Level Type Description
1.16000 Major Support Historical demand zone + liquidity grab
1.16645 Support Zone Previous resistance, now retest area
1.16926 Current Price Bullish consolidation forming
1.17331 Resistance Bullish target based on breakout projection
1.17700+ Extension Potential continuation level if momentum persists
🧠 Volume & Volatility Insight
Bollinger Bands are expanding post-breakout, indicating increasing volatility and a potential trend continuation.
VPVR shows a high-volume node around 1.166, confirming it as a strong demand zone.
🔎 Outlook & Strategy
✅ Bullish Bias
As long as the price remains above 1.16645, buying dips could be a favorable strategy.
A break above 1.17000 with strong volume could open a path toward 1.1733 and higher.
❌ Invalidation Level
A strong close below 1.16600 would invalidate the bullish setup and could return price to the lower support around 1.16000.
📌 Conclusion
EUR/USD is displaying strong bullish momentum after breaking a key resistance level and forming a solid support base. A breakout above 1.17000 may lead to a continuation toward 1.17331 and potentially higher. This setup favors bullish positioning with tight risk management.
Analyse
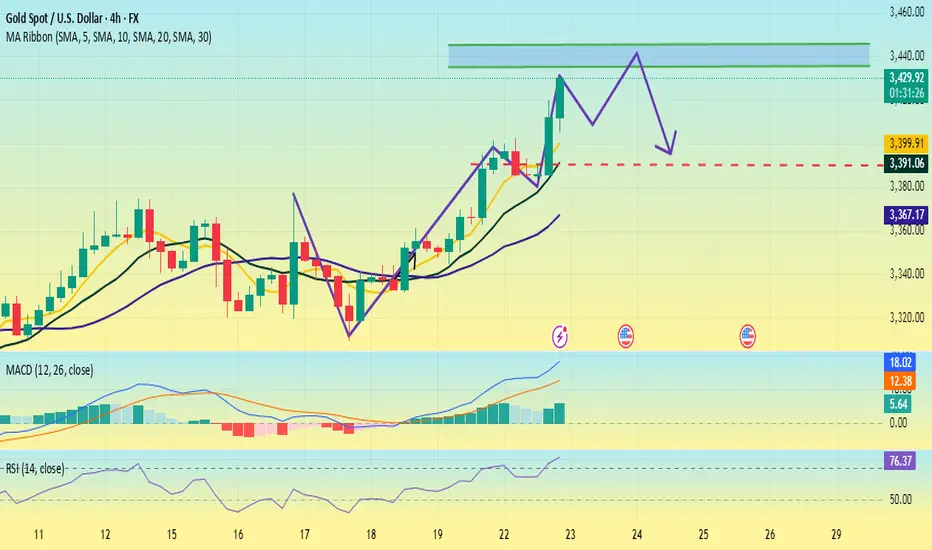
Gold is under pressure. Can it break through?Since the "W bottom" pattern was formed at the low of 3344 US dollars, the gold price broke through the neckline of 3380 and further stabilized at 3400 today, confirming the continuation of the medium-term upward trend. The moving average system is arranged in a bullish pattern, with the 5-day, 10-day and 20-day moving averages diverging upward in turn, and the support strength is stable.
The MACD indicator golden cross continues to expand, the upward momentum is enhanced, and no divergence occurs; the RSI indicator rises to around 76. Although it enters the overbought range, there is no obvious turn, indicating that the bullish momentum is still being released.
The current support level has risen to around 3390, and the support level has risen sharply. The resistance position needs to pay attention to 3430-3440. At present, several times have tested above 3430, but they have not stabilized above this position.
Operation suggestions:
3390-3400 light position to try more, stop loss 3360, profit range 3435-3445.
If it encounters resistance and falls back near 3435, you can consider short-term short orders with stop loss at 3445 and profit range at 3400-3380.
Although the upward momentum continues, some risk information still needs to be paid attention to; this week, we need to pay attention to the US June existing home sales data (July 23), the preliminary value of the second quarter GDP (July 25) and the core PCE price index (July 26). If the data is stronger than expected, it may trigger expectations of interest rate cuts.
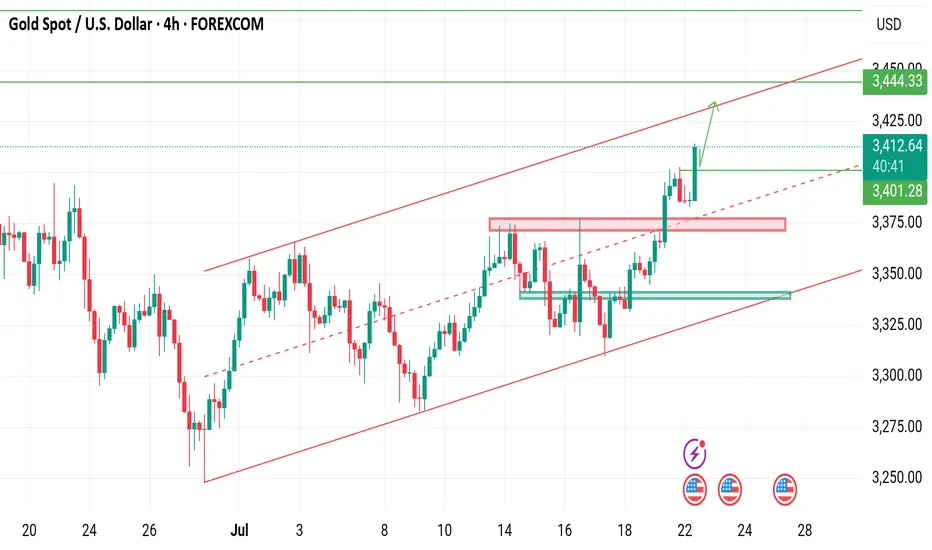
XAUUSD on spike Gold is currently holding rising channel along with the swing moves we took 180 pips On sell trade as I mentioned market has to respect previous BOS
What's possible scanarios we have?
▪️I'm looking for retracement at 3400-3395 for buying only if H4 remains above and my Targets will be 3425-3430.
▪️if H4 candle closing below 3380 my sell activates and Targets will be 3358 then 3345.
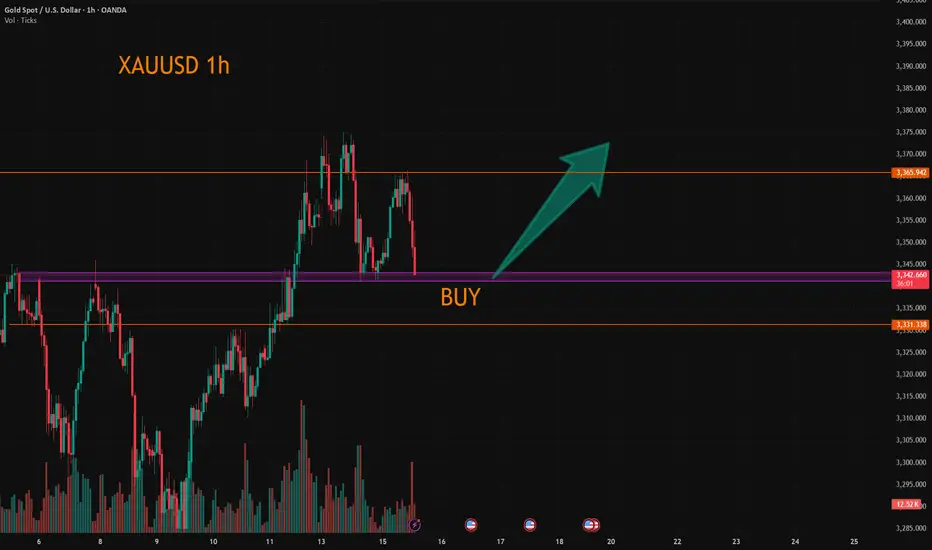
XAUUSD on swing Gold is currently holding rising channel along with the Range of 3340-3375
What's possible scanarios we have?
▪️I'm looking for Buying trade 1st we have 3342-3345 support area for potential buying spot.
Other then we have pending liquidity below 3340-3335 which I'm expecting the perfect buyying opportunity keep buy set targets at 3370 then 3400.
•Also we have buyying option If h4 closed above 3380 I will buy and target will be 3400.
▪️ keep in mind below 3330 we have sellers gap and our targets will 3305 then 3290
#XAUUSD

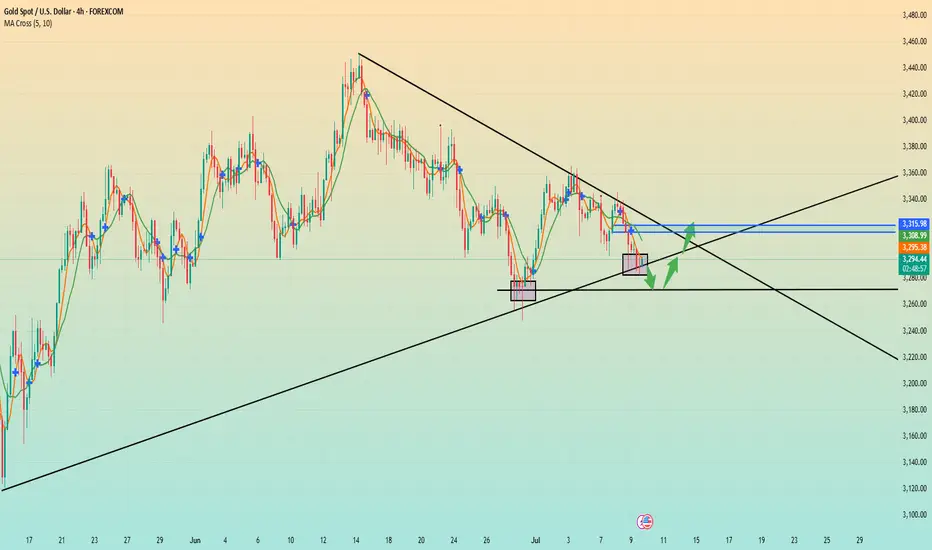
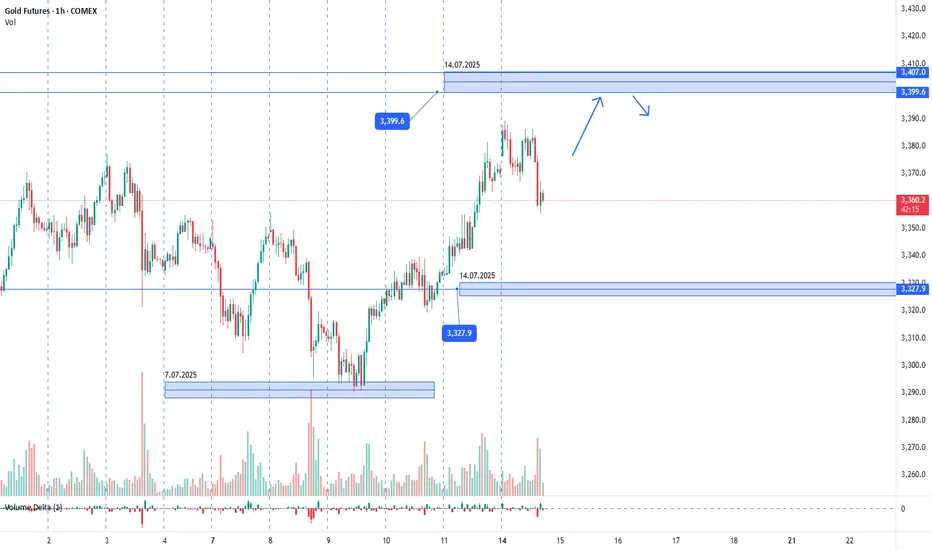
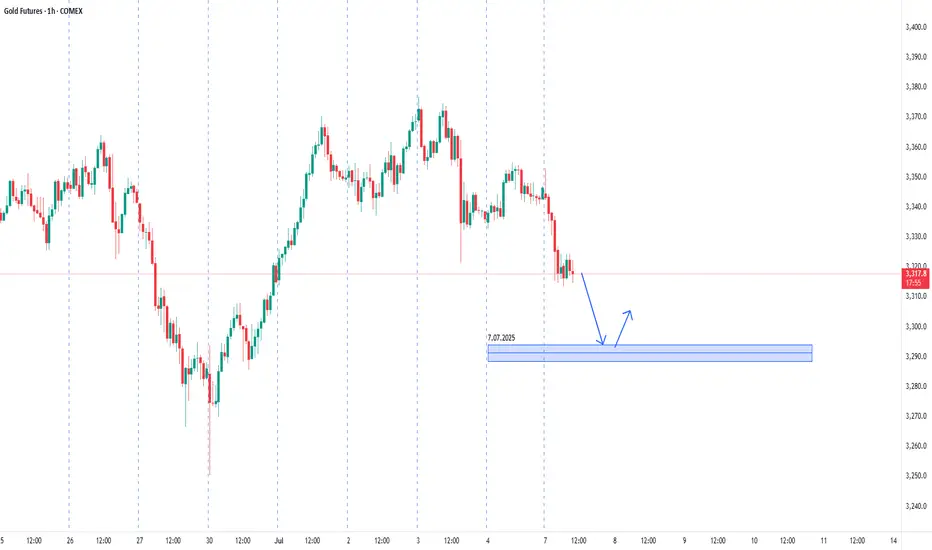
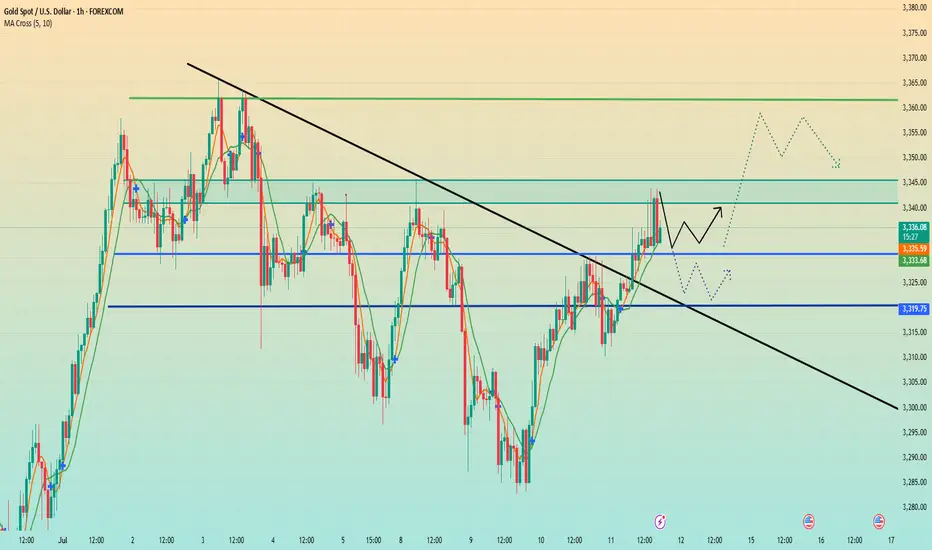
Gold. 14.07.2025. The plan for the next few days.The nearest resistance zones are where it's interesting to look for sales. It's not certain that there will be a big reversal, but I think we'll see a correction. We're waiting for a reaction and looking for an entry point.
The post will be adjusted based on any changes.
Don't forget to click on the Rocket! =)
Gold is in danger. Could it fall?Gold started to fall slowly after the Asian market opened on Thursday, and continued to fluctuate and fall in the European market. The impact of the initial data in the US market fell sharply to around 3310, then stabilized and rose. It reached a high of around 3341 and then maintained a high sideways fluctuation, and the daily line closed with a negative line.
The price trend of gold this week was erratic. On Wednesday, it rose and fell, closing with a positive line, indicating that there was strong resistance above; on Thursday, it fell and rebounded, closing with a negative line, indicating that there was some support below. The current moving average system is chaotic, which further confirms that the overall situation is in a wide range of fluctuations.
Connecting the highs and lows of this week can form a fluctuating downward channel, which still has an important guiding role in the market. The current channel resistance is at 3345. If the gold price can break through this resistance level, it is expected to open up further upward space; and the channel support is around 3320. Once it falls below, it may trigger a new round of decline.
Overall, the upward resistance levels of gold are 3345, 3350, and 3360; the downward support levels are around 3320 and 3310. Operation strategy:
Short around 3350, stop loss at 3360, profit range 3330-3310.
Long near 3315, stop loss 3305, profit range 3330-3350.

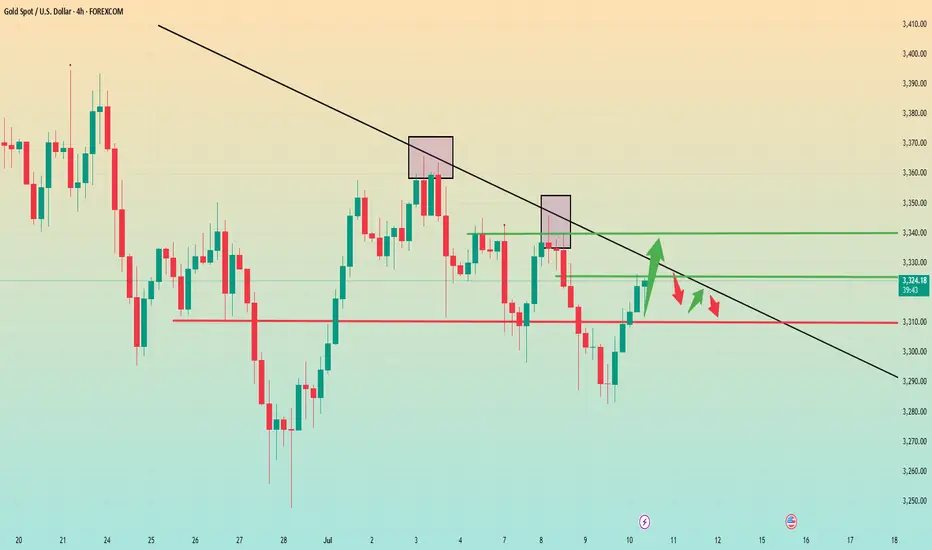
Gold (XAU/USD) Premium Technical Outlook - 18 July 2024As gold continues to trade near record highs, the market’s current price action around $3,336–3,340 demands a sharp, disciplined technical view. This premium analysis combines price action, Fibonacci techniques, institutional concepts (ICT and Smart Money Concepts), and advanced supply–demand dynamics to identify actionable trade opportunities.
We anchor on the 4-hour timeframe for directional bias and zoom into the 1-hour chart for precision intraday setups.
📊 4‑Hour Timeframe: Structure and Directional Bias
Gold remains in a clear bullish structure on the 4-hour chart, as evidenced by sustained higher highs and higher lows. The most recent bullish Break of Structure (BOS) occurred above the $3,320–3,325 level, confirming buyers’ control for now.
Currently, price hovers near equilibrium at the 61.8% Fibonacci retracement, testing prior resistance as potential support. This zone aligns with a small fair value gap (FVG), reinforcing it as an area of interest for smart money participants.
Key 4H Levels to Watch
Level Significance
$3,360–3,365 Major supply zone & bearish OB
$3,350–3,355 Minor resistance
$3,337–3,340 61.8% Fib / equilibrium
$3,330–3,333 BOS retest & key support
$3,300–3,310 Strong demand zone & bullish OB
$3,285–3,295 Secondary demand zone below BOS
The directional bias on 4H remains neutral-to-bullish, contingent on price holding above $3,300. A clean break and close above $3,360 could open a path to $3,400–3,420, while a sustained drop below $3,300 would mark a change of character (CHOCH) and shift bias to bearish.
🪙 Institutional Concepts in Play
Order Blocks (OB): Strong bullish OB sits at $3,300–3,310, while a bearish OB dominates at $3,355–3,365.
Fair Value Gaps (FVG): On the bullish side, $3,300–3,315 remains unfilled; on the bearish side, $3,330–3,345 caps rallies.
Liquidity Grabs: Dips toward $3,295–3,300 appear to sweep sell-side liquidity, while spikes above $3,360 tap into resting buy stops.
The area around $3,330 remains a key battleground where smart money likely accumulates positions before the next impulsive move.
⏳ 1‑Hour Timeframe: Intraday Trade Setups
On the 1-hour chart, the market is compressing between a bullish order block and bearish supply. Price action shows evidence of short-term liquidity sweeps and reactions to imbalances, offering two clear scenarios for intraday traders.
📈 Setup A – Bullish Zone Bounce
Entry: Buy limit at $3,332–3,333
Stop-loss: Below $3,328
Take-Profit 1: $3,345
Take-Profit 2: $3,355
Rationale: Confluence of 4H demand, Fib retracement, BOS retest, and 1H bullish order block.
📉 Setup B – Supply Rejection Short
Entry: Sell limit at $3,355–3,360
Stop-loss: Above $3,365
Take-Profit 1: $3,337
Take-Profit 2: $3,330
Rationale: Price into 4H bearish OB, aligning with supply and stop runs above recent highs.
🌟 The Golden Setup
Among these, the Bullish Zone Bounce at $3,332–3,333 stands out as the highest-probability trade. This level represents maximum confluence:
Retest of 4H BOS.
Bullish OB on 1H.
61.8% Fibonacci support.
Unmitigated fair value gap.
This setup offers a favorable risk–reward profile with clear invalidation and multiple upside targets.
🔎 Summary Table
Bias Key Support Zones Key Resistance Zones
Neutral-to-bullish $3,300–3,310, $3,330–3,333 $3,350–3,355, $3,360–3,365
Intraday Setups Entry Zone Stop-Loss Take-Profit Targets
Bullish Zone Bounce 🌟 $3,332–3,333 < $3,328 $3,345 / $3,355
Supply Rejection Short $3,355–3,360 > $3,365 $3,337 / $3,330
📣 Final Word
Gold maintains a structurally bullish outlook above $3,300, with strong institutional footprints evident in the $3,300–3,333 demand zones. Traders should remain vigilant around $3,360, where sell-side liquidity and supply are concentrated.
The Golden Setup — a bullish bounce from $3,332 — offers the best confluence and statistical edge intraday.

XAUUSD still on retest Gold is currently holding rising channel. We just secured sell opportunity at 3329 and TP HIT at 3311 .
What's possible scanarios we have?
▪️I'm looking for Buying trade As I mentioned is my previous commentary 3310-3312 is the buying area .if H4 remains above then keep buy set targets at 3335 then 3345.
▪️ Secondly 3290 is the perfect area of buying if its still fall .
-> Moral of Day buy the Dips
Additional TIP:
Below 3310 -3308 I will Activate my resell and hold till 3300 then 3290
#XAUUSD
Gold fluctuated downward. Stuck in a stalemate.Information summary:
Global investors have experienced the longest night this year. There are reports that Trump has drafted a letter to fire Federal Reserve Chairman Powell. The incident triggered a strong reaction in the financial market. An hour later, Trump came out to clarify that "there is no plan to take any action" and denied drafting a letter to fire Powell.
Due to the impact of the incident, gold experienced a roller coaster market, soaring more than $50 at one time, hitting a three-week high of $3,377.17, and then narrowed its gains to 0.68%, and finally closed at $3,347.38. In today's Asian market, gold fell slightly and is currently hovering around $3,325.
Market analysis:
The current volatility pattern has not changed. In the short term, the market shows signs of weakness, which is also affected by CPI data, and expectations for interest rate cuts have weakened. In the current state where there is no break in the pattern, waiting and watching is still the best strategy.
The first support level is around 3,310, which is the starting point of last week's high. The second is around 3280, which is the historical low since July and also the starting point of the rise in the first week of July.
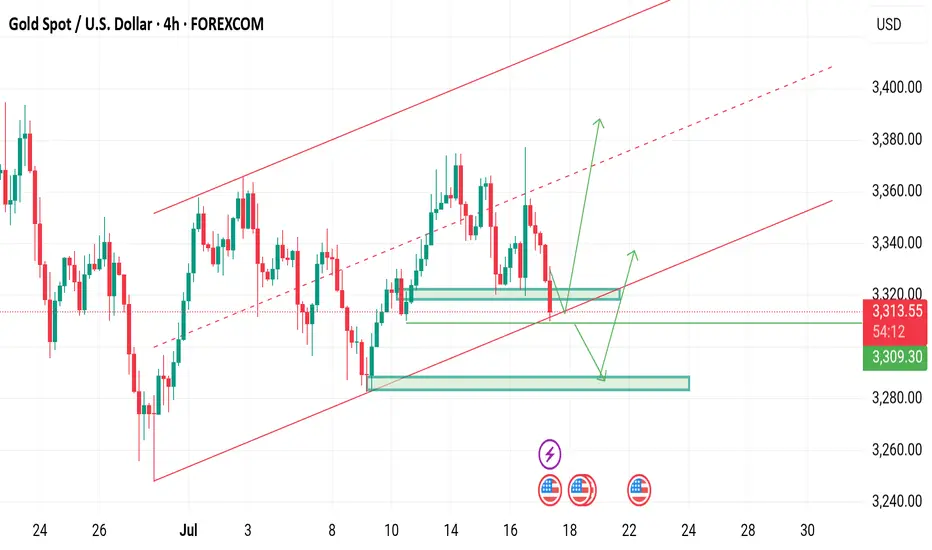
How to find stable trading opportunities in gold fluctuations?Today, the rhythm of gold going short first and then long is perfectly grasped. Congratulations to those who followed the trading plan for reaping good returns. We are still holding long orders at present, and the overall position is arranged around the idea of stepping back to low and long. From the current market structure, the 3325-3320 area below is an important dividing line for the bulls to be strong, and it is also a key support level that determines the subsequent direction. If this area stabilizes, the short-term structure will still be bullish and unchanged, and the rhythm of stepping back to low and long is expected to continue. It is expected that gold will rebound to 3340-3350 and the upper target again. If 3320 is lost, it is recommended to stop loss as soon as possible, and the defense position is recommended to be set below 3315 to prevent the short-term structure from turning short and bringing further callback risks. The core of this round of trend is that only by holding the support can we be qualified to talk about rebound; if the support is lost, we need to turn decisively to prevent being passive. The current market volatility has intensified, but the direction has not yet completely broken. The focus of operation is still on entering the market around key points, switching positions between long and short positions to find the rhythm, blindly chasing orders and emotional operations will be taboos in the current market. Opportunities are not absent, but they belong to those who are always ready. The structure is not broken and the low and long will not change.
XAUUSD:Continue to go long
The gold price has just fallen after being pressured by the 3365 level. Currently, there are no obvious signs of a bottoming out. However, the 3340-43 range is the support position from the previous several declines. Here, one can lightly participate in the bullish orders. If going further down, the 3330 level is an important support point. Both of these positions can be utilized to go long.
Then the trading strategy:
BUY@3340-43
TP:3360-65
If the price retraces to the 3330 level, increase the position of the long bet. The goal remains the same. I will keep you informed if there are any changes.
More detailed strategies and trading will be notified here ↗↗↗
Keep updated, come to "get" ↗↗↗
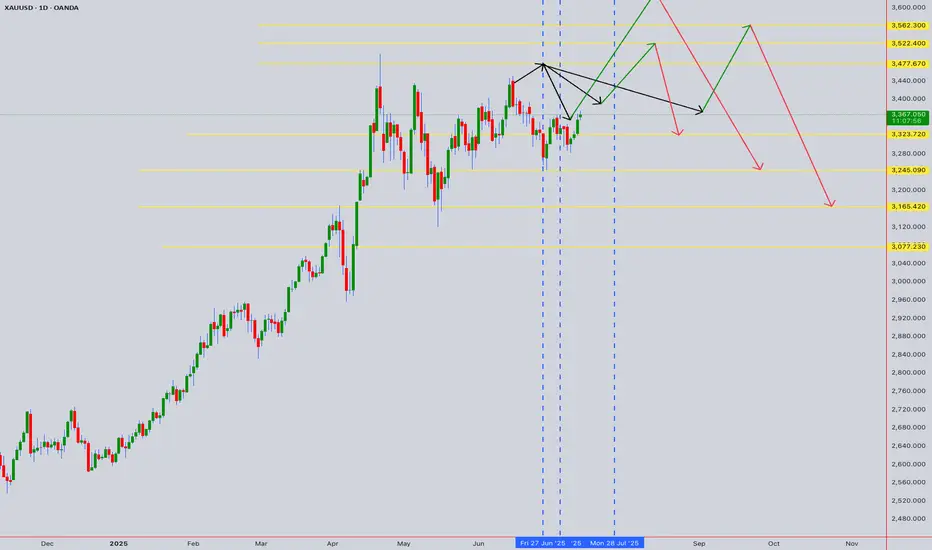
XAUUSD (Gold) - Future Outlook (as of mid-July 2025)In continuation :-
The future outlook for Gold (XAUUSD) is a complex interplay of various macroeconomic factors, geopolitical developments, and market sentiment. As of mid-July 2025, several key themes are likely to shape its trajectory:
Monetary Policy and Interest Rate Expectations (Central Bank Actions):
Impact: Gold is a non-yielding asset. Therefore, its attractiveness is highly sensitive to interest rate movements. Higher interest rates (or expectations of them) tend to increase the opportunity cost of holding gold, as investors can earn more from interest-bearing assets like bonds. Conversely, lower rates or a more dovish stance from central banks (like the U.S. Federal Reserve, ECB, BoJ) reduce this opportunity cost, making gold more appealing.
Current Context: As of mid-2025, markets are closely watching central bank rhetoric regarding potential rate cuts. If inflation continues to moderate, leading to clearer signals or actual rate cuts, this would likely be a positive catalyst for gold prices. However, if inflation proves stickier or central banks maintain a "higher for longer" policy, gold could face headwinds.
Inflation Outlook:
Impact: Gold has historically been considered a hedge against inflation and a store of value during periods of rising prices.
Current Context: If inflation remains elevated or shows signs of re-accelerating, demand for gold as an inflation hedge could increase, providing support to prices. If inflation falls back significantly to central bank targets, this traditional appeal might lessen somewhat, unless other safe-haven drivers emerge.
U.S. Dollar Strength:
Impact: Gold is primarily priced in U.S. dollars. A stronger U.S. dollar makes gold more expensive for international buyers holding other currencies, potentially dampening demand. A weaker dollar has the opposite effect, making gold cheaper and generally supportive of higher gold prices.
Current Context: The dollar's strength is heavily influenced by U.S. interest rate differentials and the relative economic performance of the U.S. versus other major economies. A "risk-off" environment can also lead to dollar strength (as a safe-haven itself), which can create a counteracting force for gold.
Geopolitical Risks and Economic Uncertainty:
Impact: Gold is a classic "safe-haven" asset. In times of increased geopolitical tension, economic instability, financial market turmoil, or escalating conflicts, investor demand for gold typically surges as a store of value.
Current Context: Global geopolitical landscape remains complex, with ongoing regional conflicts, trade disputes, and political uncertainties. Any escalation in these areas would likely contribute to increased safe-haven demand for gold. Similarly, if there are growing concerns about a global economic slowdown or recession, gold's appeal as a safe haven could strengthen.
Central Bank Gold Demand:
Impact: Central banks globally have been significant buyers of gold in recent years, diversifying their reserves away from the U.S. dollar. Their sustained buying provides a structural floor to gold demand.
Current Context: Continued strong buying by central banks, particularly from emerging economies, is expected to remain a supportive factor for gold prices in the medium to long term.
Overall Future Outlook (Mid-July 2025 Perspective):
The outlook for Gold (XAUUSD) appears cautiously bullish in the medium term, with potential for continued appreciation.
Positive Drivers: The primary drivers are the increasing likelihood of future interest rate cuts (even if gradual), potentially persistent underlying inflation concerns, and the ongoing elevated geopolitical risks and global economic uncertainties. Continued strong central bank demand further underpins this outlook.
Potential Headwinds: A significantly stronger-than-expected U.S. dollar (e.g., due to a major global "risk-off" event that drives dollar demand, or robust U.S. economic outperformance leading to delayed rate cuts) could provide a counteracting force. Rapid disinflation could also temper some of gold's appeal.
In summary, Gold is likely to remain an important asset in investor portfolios, acting as both an inflation hedge and a safe haven. Its price action will be particularly sensitive to central bank policy shifts and global stability.
⚠️ Disclaimer: This post is educational content and does not constitute investment advice, financial advice, or trading recommendations. The views expressed here are based on technical analysis and are shared solely for informational purposes. The stock market is subject to risks, including capital loss, and readers should exercise due diligence before investing. We do not take responsibility for decisions made based on this content. Consult a certified financial advisor for personalized guidance
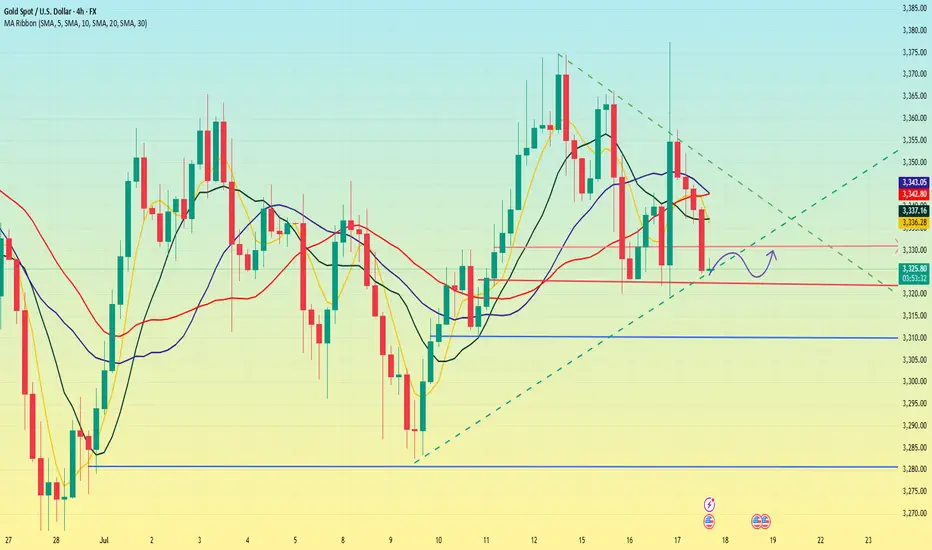
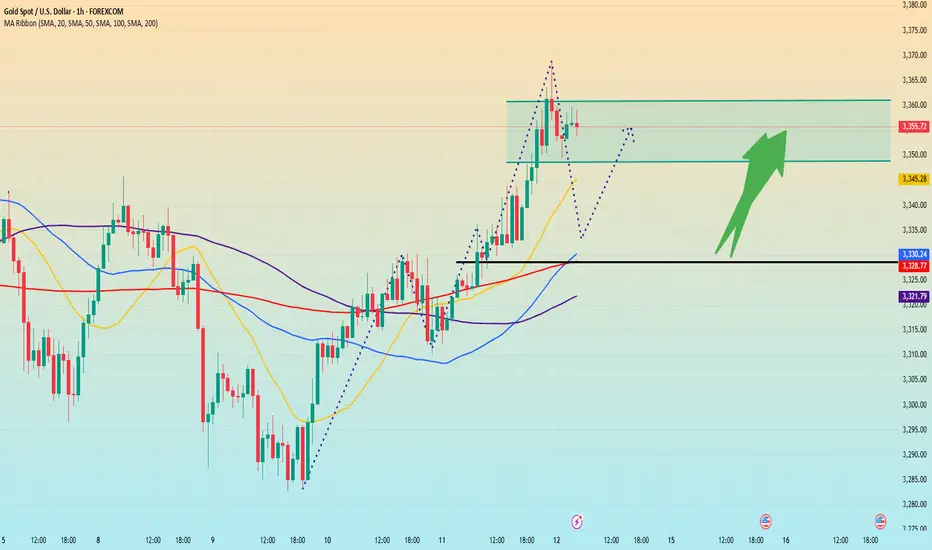
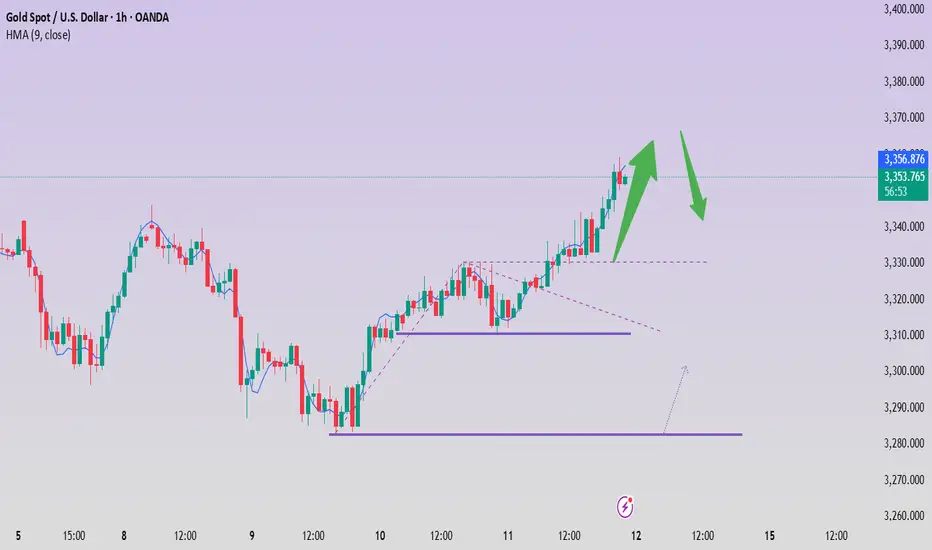
Gold breaks through. Will it continue?After breaking through the position predicted by Quaid on Friday, gold rose strongly and finally maintained the fluctuation range of 3345-3360 that I predicted. Gold bulls are now strong. If there is no major change in the news over the weekend, the price will likely continue to rise after a slight decline at the beginning of next week. I think we can still follow the strategy of Dutou.
The 1-hour moving average of gold continues to diverge with a golden cross and upward bullish arrangement, and the bullish momentum of gold is still there. The current strong support level of gold has also moved up to around 3330. After gold broke through 3330 over the weekend, the price fell back to 3330 and stabilized and rose twice. In the short term, this position has formed a strong support.
There is a high probability that the price will have a small correction at the beginning of next week. We can continue the bullish strategy after the price falls back.
Market transactions should abandon personal preferences. Preconceived subjective consciousness will eventually be taught a lesson by the market. The market is always right. We should follow the fluctuations of the market. Instead of having a head full of random thoughts. There are always traces of market changes, and you need to have the ability to discover them or follow those who have the ability. The market changes rapidly, so pay attention to more timely changes.
EURUSD. The plan for the next few days.The nearest resistance zones are where it's interesting to look for purchases. We are waiting for a reaction and looking for an entry point.
The post will be adjusted if there are any changes.
Don't forget to click on the Rocket! =)
Gold. The plan for the next few days.The nearest resistance zones are where it's interesting to look for purchases. We are waiting for a reaction and looking for an entry point.
The post will be adjusted if there are any changes.
Don't forget to click on the Rocket! =)
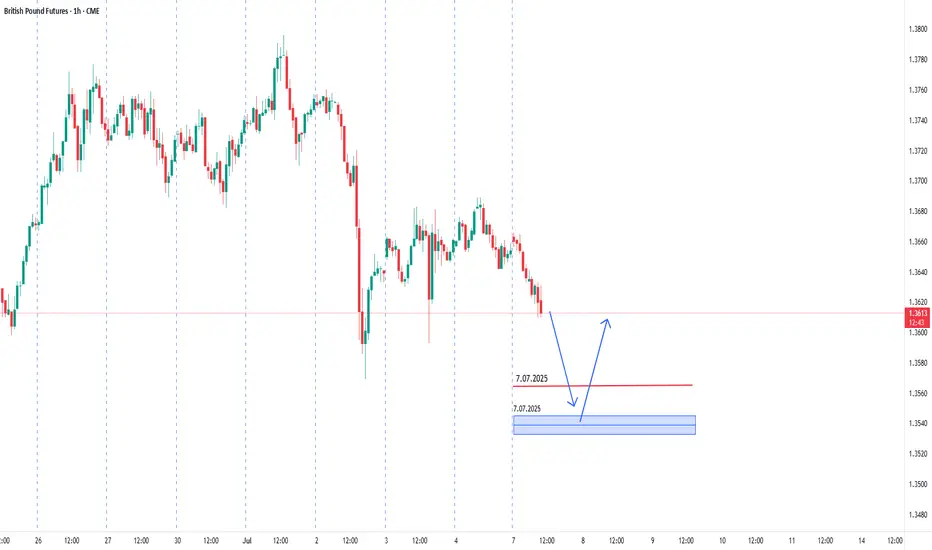
GBPUSD. The plan for the next few days.The nearest resistance zones are where it's interesting to look for purchases. We are waiting for a reaction and looking for an entry point.
The post will be adjusted if there are any changes.
Don't forget to click on the Rocket! =)
Trump's tariff news stimulates gold to explode!
📌 Driving Events
Gold prices rose for the third consecutive day and are expected to close higher this week. The trend turned in favor of gold buyers as tariff tensions intensified. US President Trump announced new tariffs, exacerbating concerns about a trade war.
📊Personal Comments:
Signs of instability in Trump's trade policy have once again hit investor confidence, reviving safe-haven demand for gold. In the absence of any top US economic data, the market will continue to focus on trade headlines. Weekend fund flows may also drive gold price movements.
⭐️Set Gold Price:
🔥Sell Gold Area: 3360-3369 SL 3374
TP1: $3355
TP2: $3342
TP3: $3325
⭐️ Note: Labaron hopes that traders can properly manage their funds
- Choose a lot size that matches your funds
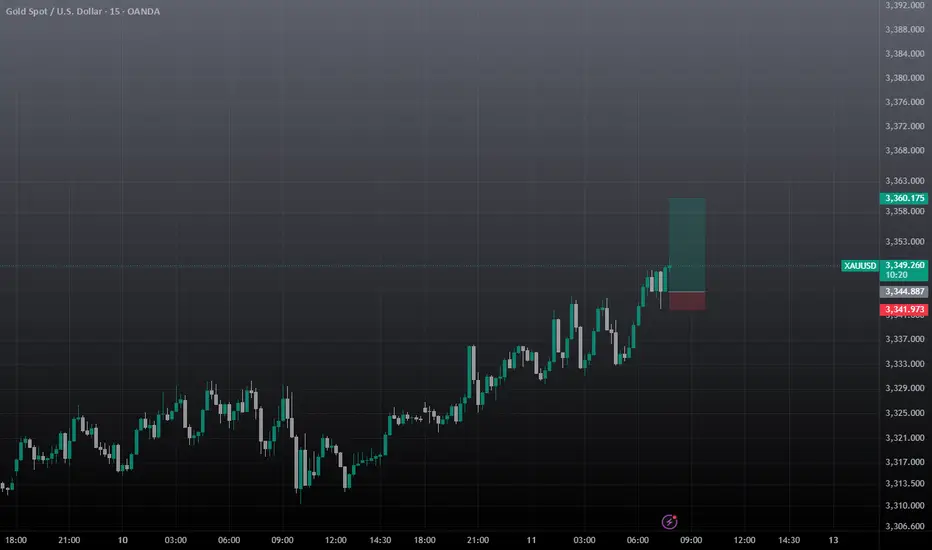
XAUUSD SCALP TRADEentry based on 5m tf, so wait for the entry and take it, must use sl, you can take 1st entry at cmp, 3348.5 2nd at mentioned and set the target and forget.
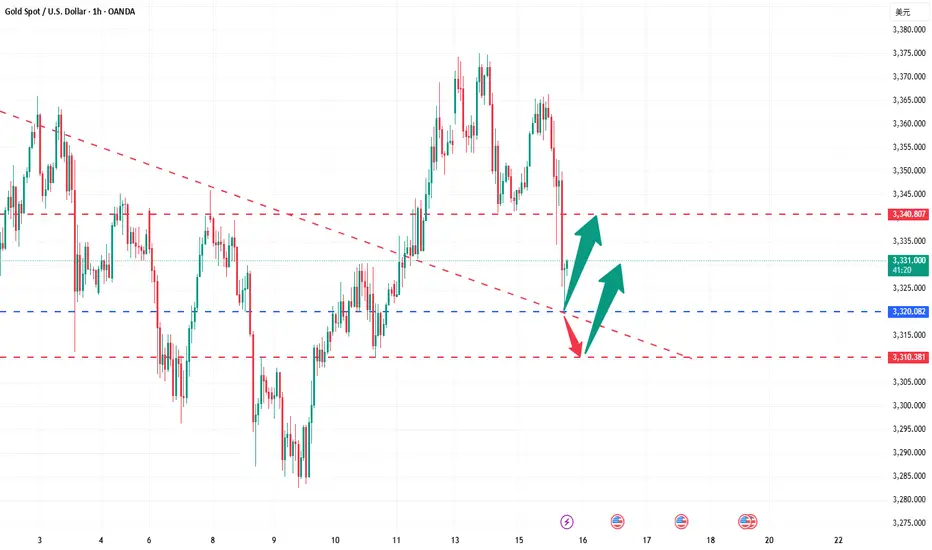
The price fell back. Watch out for a breakthrough.After reaching the resistance position near 3345 predicted by Quaid, the price fell back slightly, and the price fluctuated around 3335 so far.
From the hourly chart, before the price stabilizes at 3345, it is likely to maintain a range of 3330-3345. 3330-3345 is a temporary range. If it stands firm and breaks above 3345 again, the fluctuation range will become 3345-3360.
On the contrary, if it falls below 3330, the range may drop to 3320-3330. However, as long as the downward trend does not fall below 3320, gold will still maintain a bullish trend. If the price breaks down below 3320, today’s trend will be reversed.
As long as it is above 3320, gold will maintain a bullish trend today.
On the last trading day of this week, I wish all traders a good harvest.
Gold is fluctuating. Can it break through?Since the price of gold rose to 3500 on April 22 and encountered resistance and fell back, it has shown a triangular convergence and fluctuation trend so far. From the short-term trend, after the decline adjustment on Tuesday, it bottomed out and rebounded on Wednesday to close with a positive line, and on Thursday it completed the shock consolidation with a small positive line. The current moving average system is in an intertwined state, and the short-term market tends to fluctuate.
Today, we need to pay attention to the resistance of the 3340-3345 range. This position is a high point concentration area that has suppressed the upward movement of gold prices many times in the early stage. If the gold price breaks through this range, the bullish trend is expected to continue.
From the current trend, after the gold price bottomed out and rebounded, it formed a short-term support at 3310. Secondly, we need to pay attention to the support strength near the low point of 3282 on Tuesday. In terms of operation, it is still necessary to operate around the range.
Operation strategy:
Short when the price rebounds to around 3345, stop loss at 3355, profit range 3320-3300
Long when the price falls back to around 3310, stop loss at 3300, profit range 3320-3340
Trump blasted Powell again. Interest rates remain unchanged.Information summary:
Trump blasted Powell on Wednesday, saying that the current interest rate is "at least 3 percentage points higher" and once again accused Fed Chairman Powell of "making the United States pay an extra $360 billion in refinancing costs each year." He also said that "there is no inflation" and that companies "are pouring into the United States," and urged the Fed to "cut interest rates."
During the U.S. trading session, gold also showed a significant rebound momentum, rebounding from a low of 3285 to above 3310 in one fell swoop. As of now, gold has stood above 3320.
Market analysis:
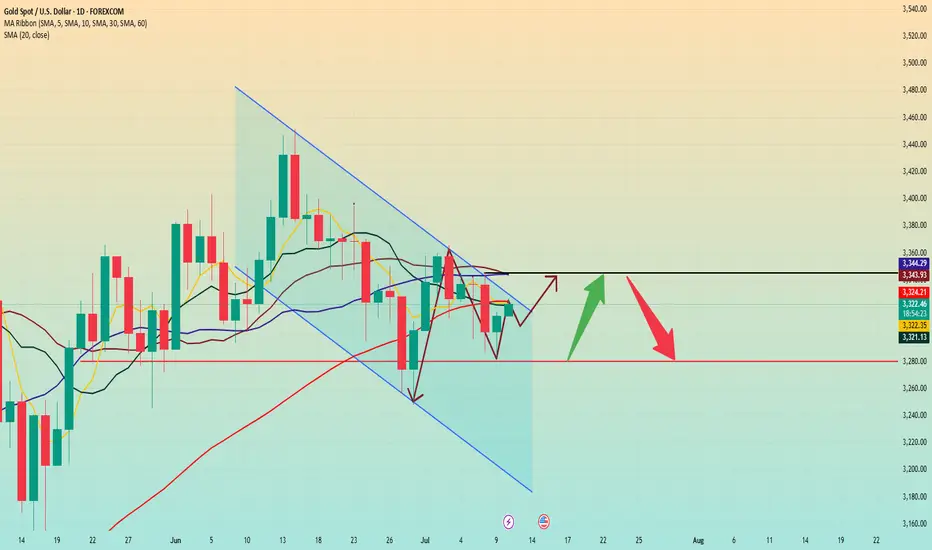
From the daily chart:
It can be seen that the first suppression position above gold is currently at 3325, followed by around 3345. Gold did not close above 3320 on Wednesday, which means that even if gold is currently above 3320, as long as today's daily line closes below 3320, it is still in a bearish trend. On the contrary, if the closing price today is above 3320, then the subsequent test of the suppression position near 3345 may be further carried out.
Secondly, from the 4-hour chart, the current suppression position above 4 hours is around 3330-3335. Therefore, today we should focus on this position. If we cannot stand firm and break through the range suppression here in the 4-hour chart, we may retreat again in the future. The key support position below is around 3310, which is the opening price today. If the price is to retreat, it is likely to fall below 3310. But it may also remain above 3310 for consolidation.
However, as long as it falls below 3310, I think the low point near 3285 may be refreshed, so pay attention to this.
Operation strategy:
Steady trading waits for 3310 to fall and break through to short, and the profit range is 3385 or even lower.
Aggressive trading can short near 3340, with a stop loss of 3350.
Gold rose. Trend reversed.Gold rose slightly in early Asian trading on Wednesday, but fell under pressure near 3308. It fluctuated in the European trading range of 3296-3282. It broke through the US trading range and rose to around 3317 in the late trading. The daily line closed with a positive line with a lower shadow.
After a sharp drop on Tuesday, gold showed a downward recovery trend on Wednesday and closed positive. It rose slightly in early Asian trading today. From the daily level, in the short term, we should first pay attention to the resistance near 3325-3330. This area brings together the current positions of the 5-day moving average, the 10-day moving average and the 60-day moving average, which is an important gateway for the game between long and short forces in the short term. If the gold price continues to be under pressure in this area, it means that the short-term upward momentum is insufficient, and we need to be alert to the risk of a market decline.
If the above resistance area can be broken and the price continues to rise strongly, the next target will be the resistance near 3345, which is not only the high point on Tuesday, but also the current location of the 20-day moving average and the 30-day moving average, which has a strong technical resistance significance.
In terms of support below, first pay attention to the support near 3280, which is the current support level of the trend line formed by the low points of May 15 and June 30, which provides certain support for the gold price.
Operation strategy:
Short at price rebound near 3345, stop loss at 3355, profit range 3320-3300
Long at price drop near 3315, stop loss at 3305, profit range 3320-3340
Data is about to be released. Where will gold go?Yesterday, the market expected a trade agreement between the United States and its trading partners, which boosted risk sentiment, and the strengthening of the US dollar and the rise in US bond yields further added pressure on gold prices. Gold fell 1% during the day and once lost the $3,300 mark during the session.
After gold bottomed out and stabilized at 3,320 on Monday, it fell sharply above 3,320 again on Tuesday and has now completely fallen below 3,320. The position of 3,320 is very important. In the 3,320-50 range, it chose to break down at 3,320 again.
Today, the Federal Open Market Committee of the United States will release the minutes of the June monetary policy meeting. Although Federal Reserve Chairman Powell remained neutral on the June interest rate decision, many Federal Reserve officials released dovish signals. Federal Reserve Board member Bowerman has turned to support the possibility of a rate cut in July.
From a technical point of view, the market has penetrated into the area around the lower support of 3,275-3,295.
The rhythm of the entire market is still a process of oscillating decline. From the perspective of pressure position, the daily MA5 average line has not fallen below, and may fall again to around 3270. Once the market falls too fast and approaches this position, there is a high probability that there will be a rebound demand.
Operation strategy:
Buy near 3375, stop loss at 3365, profit range 3315-3320.
Continue to hold position after breakthrough.