LTCUSD long term analyse, predictionHello hello friends.
Now we can bounce back from that black rough line and slightly up. If we broke the blue line, we can up, but we will have some stop points where we can fall back as you can see on chart.
Or we can fall under the black rough line and then fall more to red line. On red line there is strong support, I dont think we break it, but whatever can happen. If we break it we can fall more as you can see on chart.
But if we bounce back to rough black line and then up more to stop points (first is on around 175 dollars). On stop points we can fall or up more.
Of course we can move between them.
If you want write what you think :)
Analysetechnique

DASHUSD Time to buy? (analyse, prediction)If we break through red line, we can up more to first black line (around 747 dollars). Then we can jump back or up more as you can see on chart. I think we break through the red line because MA50 break MA200 in up. But there is a chance that we can fall down so be careful.
Hope it helps. If you want you can write comment what you think, also you can follow me for daily analyses :)

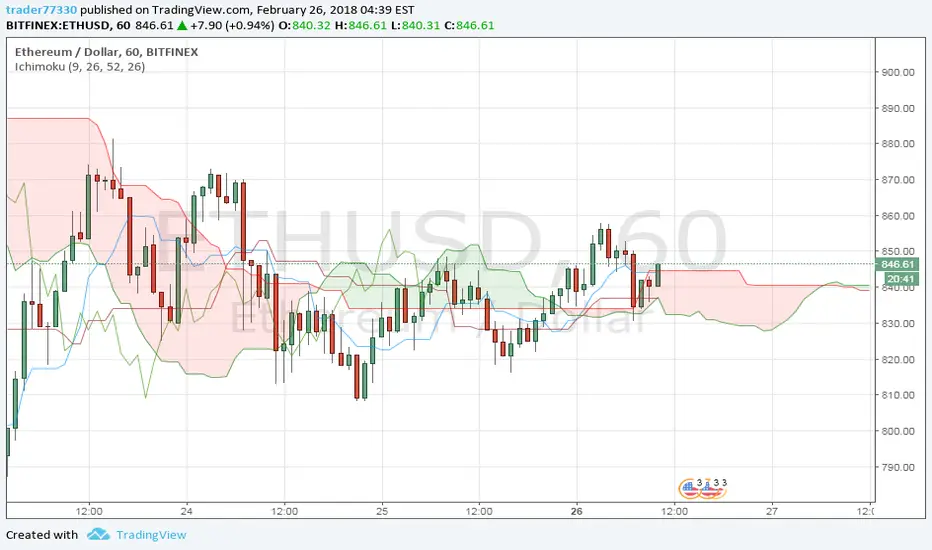
ETH/USD price tries to get over the cloud in 1-hour timeframeThe price is actually trying to get over the upper line of the ichimoku cloud.
The lagging span line (chikou span line) is still inside the ichimoku cloud. If it gets over the cloud in 1-hour timeframe (one full japanese candlestick over the cloud) then that would be a first confirmation of the uptrend, at least in one hour timeframe and for short term investors.
ADX ready to break out?After a serious decline in their prices last days, ADX is recovering. When we take a look at the daily chart (not shown here) signs for a bullish market are there. MACD is close to a golden cross and also the CCI indicates a bullish signal. Meaning that the big players are preparing to bring the ADX price back to a higher level.
When we have a look at the 4h chart we see that the MACD is in a good bullish position and de CCI is also showing some bullish signals. ADX broke through the 0.236 Fibonacci retracement level and tested the upper retracement level and 0,392 (long wig of decline) which resists. At the moment we can see that the price is going sideways with a support on the 0.236 fib and resist on the upper fibonacci level.
As the daily is also showing bullish signals, following the big players is always a good idea. If price breaks through the upper Fibo level it will skyrock. Keep an eye on the ADX movement coming hours and don't miss if it breaks out.

GBPJPY Short for Swing TraderGoodday Blessed People i just want to sharing my analysis.
Here is my analysis about GBPJPY:
I Have 2 Scenario for this pairs, i'll open my position now (When Market Open) @149.060 and set my Sell Limit @149.900 with the SL @150.800.
GBPJPY SHORT
ENTRIES 1 : 149.060
SELL LIMIT : 149.900
SL : 150.800
TP1 :145.700
TP2 : 144.100
TP3 : 140.000
Trade safe, u dont need to follow my TP, take ur profit as long as u want, or u can move your SL above profit, there is no reason to risk capital.
Disclaimer : this is my trading anlysis, it is not an invite or recommendation to trade.

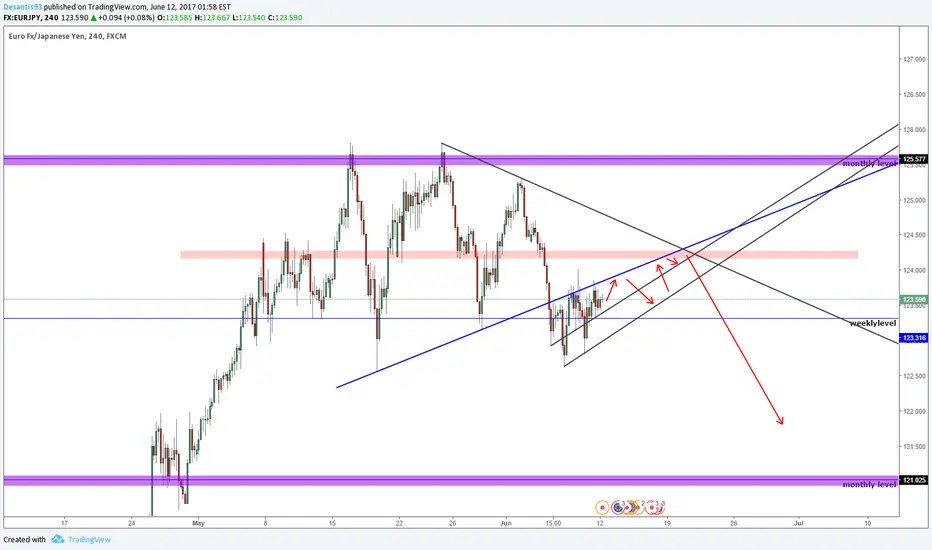
eurjpy short ideareversal zone, waiting for the end of this correction to short, this is my bref idea