Energy giants surge: Top 5 stocks to watchJune 2025 was marked by heightened volatility across the global energy sector . Amid fluctuating oil prices, geopolitical uncertainty, and ongoing industry transformation, major oil and gas companies delivered mixed results. Let’s break down the key drivers behind the moves in Shell, TotalEnergies, BP, Chevron, and Exxon Mobil.
Here are the five leaders that set the tone this June :
1. Shell: Steady growth driven by strategic adjustments . The stock climbed 7% thanks to a pragmatic dividend policy and a $3.5B share buyback plan. LNG Canada project developments also boosted investor confidence.
2. TotalEnergies: Strong performance backed by green energy push . Shares rose 5.5% after the acquisition of a renewable energy portfolio and a dividend increase. Conservative production forecast (+3% for 2025) and investment in clean energy kept demand strong.
3. BP: Recovery supported by oil price rebound . BP added around 7% on oil market stabilization and a new share buyback program. Although production declined due to asset sales, higher profitability in the oil segment offset the drop.
4. Chevron: Notable gains fueled by new projects . Chevron advanced 7.5% following the launch of the Ballymore field in the Gulf of Mexico. Expanded buyback and dividend plans further attracted investors.
5. Exxon Mobil : Stable upward momentum from production expansion. Shares jumped nearly 10% as Q1 profits reached $7.7B. Liquefied natural gas development and output growth targets energized traders.
FreshForex analysts believe the rally in energy majors may continue in the near term. Shell, TotalEnergies, BP, Chevron, and Exxon Mobil remain strong picks for active investors.
Analysis

HelenP. I Bitcoin can correct to trend line and start move upHi folks today I'm prepared for you Bitcoin analytics. In this chart, we can observe how the price developed a gradual upward trend, respecting the trend line as dynamic support multiple times. After each interaction with this line, the price showed a consistent pattern of rebounding and continuing its upward movement. Recently, the price faced a notable correction, which pushed it back toward this trend line once again, a critical zone that has proven its relevance as a support area. Upon touching the line, the market reacted with a bounce, signaling that buyers are still active and defending the structure. The price began to climb again, regaining some momentum, though it hasn’t yet managed to break the previous highs. Now BTCUSD is hovering near the ascending trend line, preparing for what could be another retest. If the trend holds, we may see a short-term decline toward this line, followed by a bullish rebound. I expect the price to push higher from this level, targeting the resistance zone near 108300, which also acted as a rejection area in the past. If you like my analytics you may support me with your like/comment ❤️
Disclaimer: As part of ThinkMarkets’ Influencer Program, I am sponsored to share and publish their charts in my analysis.

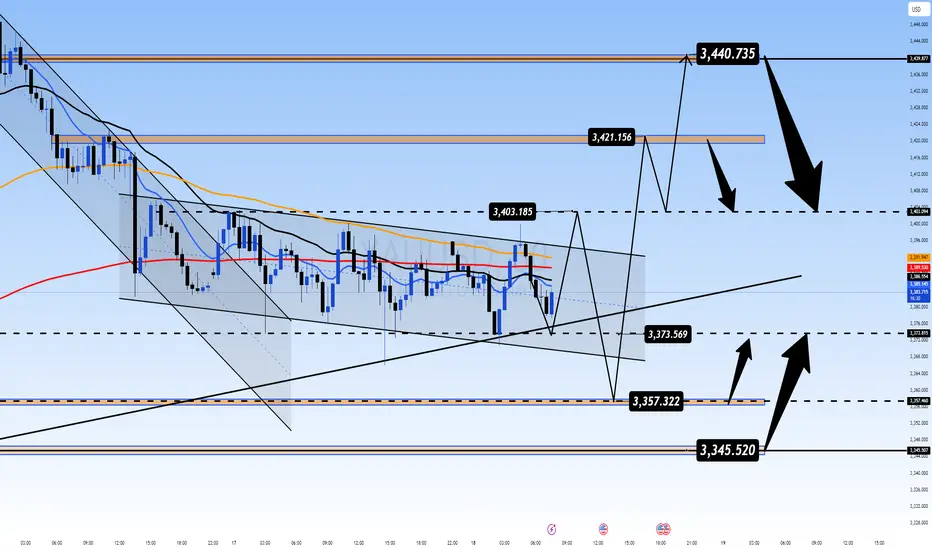
HelenP. I Gold can rise to resistance level and drop to $3325Hi folks today I'm prepared for you Gold analytics. After a steady climb, the price began to lose momentum and eventually corrected back to the trend line. This zone acted as dynamic support and initiated a new wave of upward movement. However, unlike the previous impulse, the price started consolidating within a symmetrical triangle, signaling indecision and weakening bullish pressure. Now the structure is tightening near the resistance zone, where the price has already been rejected multiple times. The market appears to be preparing for another interaction with the resistance level around 3430. Given the overall context, fading bullish energy, repeated rejections, and the triangle formation, I expect the price to test the resistance one more time before reversing downward. My goal is the trend line support, which aligns with 3325 points. This zone offers a logical area for the price to move next, especially considering the limited momentum above and the growing risk of breakdown inside the triangle. If you like my analytics you may support me with your like/comment ❤️
Disclaimer: As part of ThinkMarkets’ Influencer Program, I am sponsored to share and publish their charts in my analysis.

Gold may exit from pennant and rise to resistance levelHello traders, I want share with you my opinion about Gold. The price previously made a strong impulse upward, forming a downward pennant, but this move lost steam after touching the seller zone around 3430 - 3440. From there, the market reversed and dropped sharply below the support level, even creating a visible gap. Didn’t last long, the price recovered quickly and made another strong move up, breaking out of the downward pennant structure. Since then, Gold has been trading inside a new formation, an upward pennant, where both support and resistance lines are gradually converging. This setup suggests growing pressure and the potential for a breakout. Currently, the price is hovering near the support line of this upward pennant. In my opinion, we may see a small correction to test this support, followed by a bullish rebound. If the structure holds, Gold could break out upward and head directly toward the 3430 resistance level, which matches the upper boundary of the previous seller zone — this is my TP 1. Given the strong impulse structure and continuation pattern, I remain bullish and expect further growth after this local retest. Please share this idea with your friends and click Boost 🚀
Disclaimer: As part of ThinkMarkets’ Influencer Program, I am sponsored to share and publish their charts in my analysis.

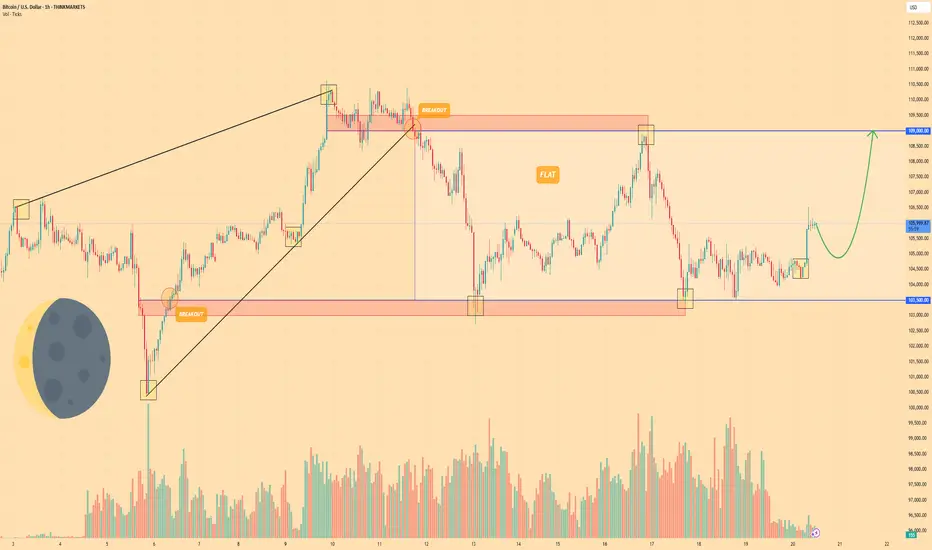
BITCOIN - Price can continue grow inside flat to $109000 levelHi guys, this is my overview for BTCUSD, feel free to check it and write your feedback in comments👊
A few days ago, the price entered a wedge, declining below the $103500 level and then making a strong impulse up.
Next, price broke $103500 level one more time and rose to resistance line of wedge, after which started to decline.
BTC broke $109000 level and started to trades inside a flat, where it declined to support level and then bounced up.
Price rose to resistance level, which is top part of flat, and then at once dropped back and started trading close.
But some time later, price bounced from this level and started to grow, and even now it continues to grow.
So, I think that BTC can make a small correction movement and then continue to grow to $109000 level.
If this post is useful to you, you can support me with like/boost and advice in comments❤️
Disclaimer: As part of ThinkMarkets’ Influencer Program, I am sponsored to share and publish their charts in my analysis.
Gold on the Edge: Will US Debt Fears Spark a Breakout?XAUUSD – Gold on the Edge: Will US Debt Fears Spark a Breakout?
After weeks of muted movement, gold is coiling within a bearish channel — but a fresh warning from Goldman Sachs may be the trigger that changes everything. With concerns mounting over America’s fiscal future, gold could be preparing for a decisive shift.
🌐 Macro View – Goldman Sachs Sounds the Alarm
🔺 Goldman Sachs recently issued a critical warning:
US national debt is expected to exceed WWII levels, with interest payments topping $1 trillion by 2025, outpacing spending on defense and healthcare.
If urgent fiscal reforms aren’t implemented, the US could face a tightening cycle that slows GDP growth without reducing the debt-to-GDP ratio.
The root causes? Excessive spending, rising interest rates, and deep political gridlock.
📌 For global investors, this type of uncertainty is often bullish for gold — especially as a hedge against both inflation and US dollar instability.
📉 Technical Outlook (Updated – M30 to H1)
Gold is still trading inside a well-defined descending channel, with sellers firmly in control.
Price is currently hovering around the pivot zone at 3,338.42, with a possible short-term bounce toward 3,368.04, the upper edge of the channel.
EMA ribbons (13–200) are sharply aligned to the downside, signaling strong bearish momentum.
If the price fails to break above 3,368, the next key support zones lie at 3,325.78, and potentially 3,309.25, where unfilled fair value gaps (FVG) await.
✅ Trade Plan
🟢 BUY ZONE: 3310 – 3308
Stop-Loss: 3303
Targets: 3314 → 3318 → 3322 → 3326 → 3330 → 3340 → 3350 → 3360 →
🟢 BUY SCALP: 3325 – 3323
Stop-Loss: 3318
Targets: 3330 → 3334 → 3338 → 3342 → 3346 → 3350 → 3360 → 3370 →
🔴 SELL ZONE: 3418 – 3420
Stop-Loss: 3424
Targets: 3414 → 3410 → 3405 → 3400 → 3396 → 3390 → 3385 → 3380
🔻 SELL SCALP: 3396 – 3398
Stop-Loss: 3403
Targets: 3392 → 3388 → 3384 → 3380 → 3375 → 3370
💬 Closing Thoughts – A Volatile End to the Week?
With US markets returning from a bank holiday and macro pressure rising, volatility could spike to close the week.
✅ Stick to disciplined SL/TP levels. Avoid premature entries and let price confirm direction.
Gold remains technically bearish — but the global debt narrative could turn this market on its head.
Prepare. Observe. Strike only when the structure aligns.

Fundamental Market Analysis for June 20, 2025 USDJPYThe Japanese yen (JPY) strengthened slightly against the US dollar during Friday's Asian session and moved away from the monthly low reached the day before. Data released by the Japanese government showed that the annual consumer price index (CPI) in May remained well above the Bank of Japan's (BoJ) target of 2%. This confirms market expectations that the BoJ will raise interest rates again and is a key factor driving the moderate growth of the JPY.
Meanwhile, ongoing trade uncertainty and further escalation of geopolitical tensions in the Middle East continue to weigh on investor sentiment, further strengthening the JPY's status as a safe haven. In addition, the moderate decline in the US dollar (USD) is pulling the USD/JPY pair back towards the psychological level of 145.000. However, expectations that the BoJ may keep rates unchanged until the first quarter of 2026, as well as the Federal Reserve's (Fed) hawkish pause earlier this week, may limit the pair's losses.
Market participants are paying extra attention to upcoming economic releases from the US, including inflation and labor market data, which could influence the Fed's monetary policy trajectory. If the statistics prove strong, this could strengthen the dollar and put pressure on the yen. However, the continuing weakness in the global economic recovery and high Japanese inflation continue to support expectations of a gradual tightening of BoJ policy, creating an ambiguous outlook for the USD/JPY exchange rate in the short term.
Trading recommendation: SELL 145.400, SL 145.700, TP 144.300

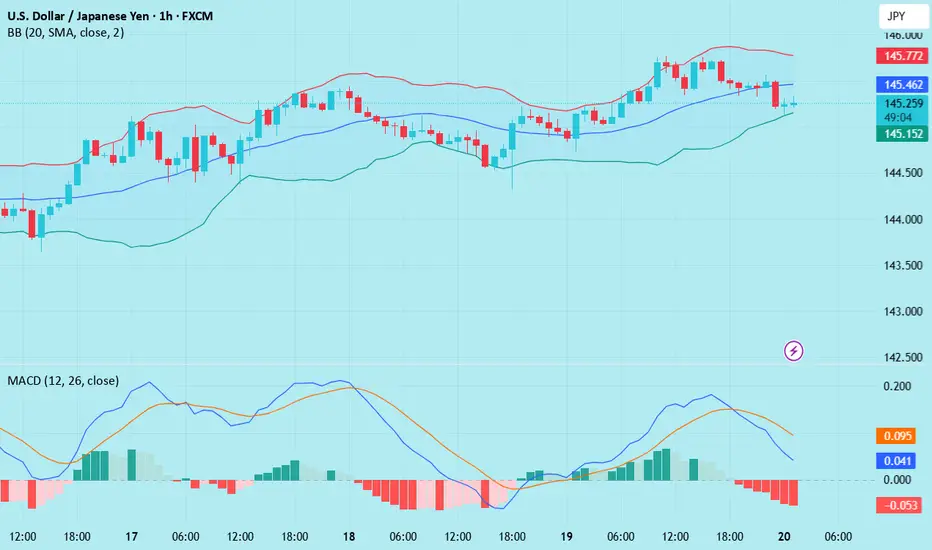
USD/JPY(20250620)Today's AnalysisMarket news:
The Bank of England kept interest rates unchanged at 4.25%, and the voting ratio showed that internal differences were increasing. Traders expect the bank to cut interest rates by another 50 basis points this year.
Technical analysis:
Today's buying and selling boundaries:
145.32
Support and resistance levels:
146.35
145.96
145.72
144.93
144.68
144.30
Trading strategy:
If the price breaks through 145.72, consider buying, and the first target price is 145.96
If the price breaks through 145.32, consider selling, and the first target price is 144.93
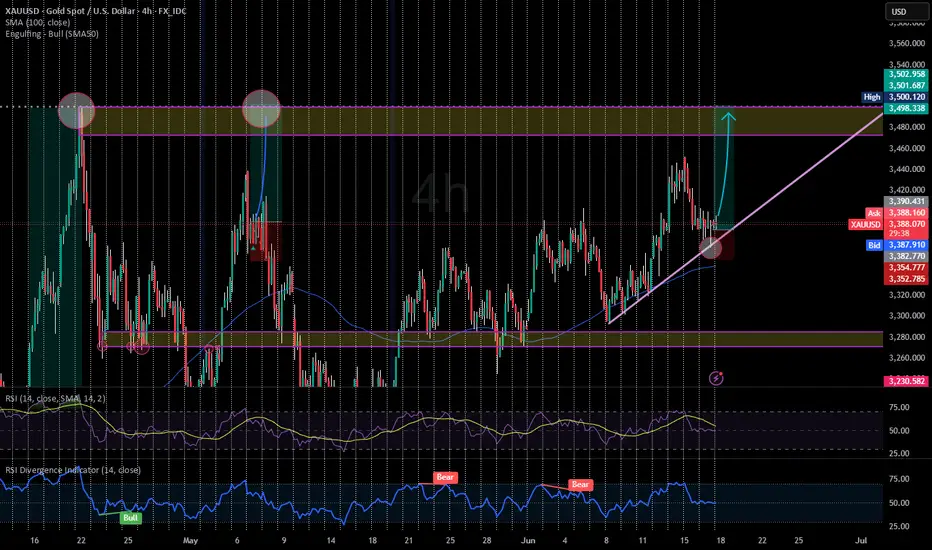
Potential Gold LongWith Volatile Markets and constant War Developments
XAU/USD has experienced higher than NORMAL volatility.
Given price can RESPECT this short term trendline, we may have a Target of 3,500 in sight.
2 weeks of Bullish Momentum now followed by a beautiful retracement & Strong Wicks below.
SL - 3,355
TP 1 - 3,440
TP 2 - 3,470
TP 3 - 3,496
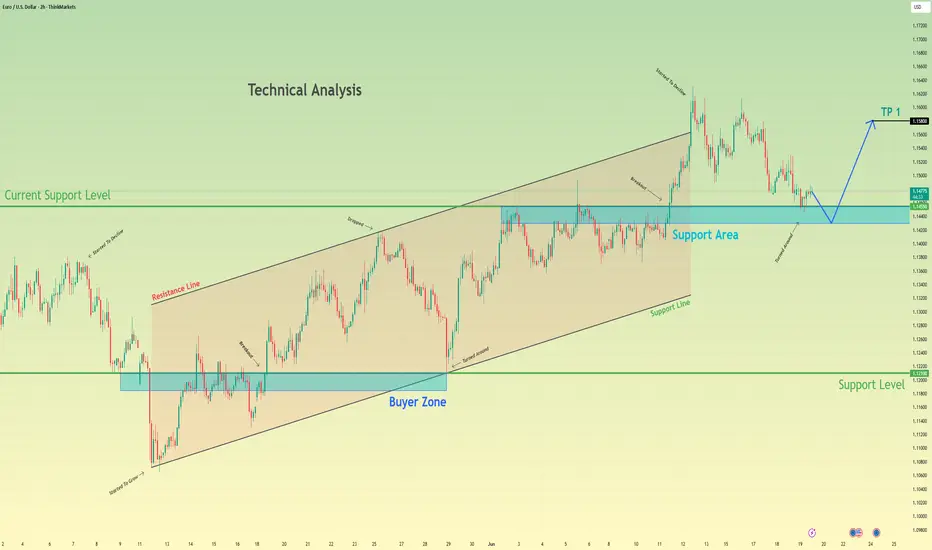
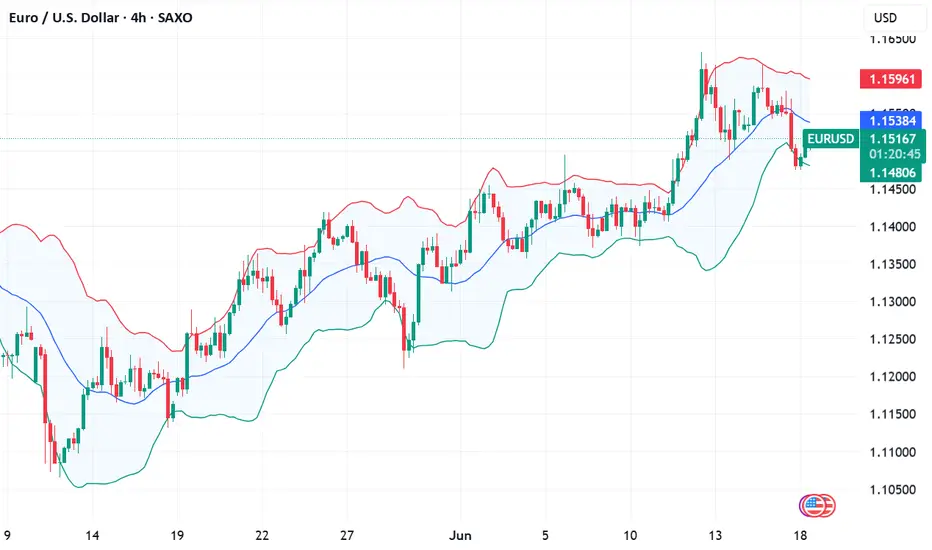
Euro can fall to support area and then rebound upHello traders, I want share with you my opinion about Euro. Observing this chart, we can see how the price, after a period of sideways trading, the price started to grow gradually and formed a consistent bullish structure. The trend was supported by regular bounces from the support line, confirming the bullish sentiment. At some point, price made a temporary drop below the support area, but this move was short-lived; bulls quickly stepped in, and the pair recovered. After that, EURUSD returned back into the channel and began forming higher highs and higher lows again, confirming the continuation of the trend. Right now, the price is declining slightly and approaching the support area again, which is located between 1.1455 and 1.1430. This zone has shown itself as a strong support during previous moves and is now being retested from above. Given the current structure and the upward channel in play, I expect the Euro to rebound from this support area and continue growing toward the 1.1580 points - that’s my current TP 1. Please share this idea with your friends and click Boost 🚀
Disclaimer: As part of ThinkMarkets’ Influencer Program, I am sponsored to share and publish their charts in my analysis.
EURUSD pushing away from 2025 highsAfter creating a new 2025 high last week, MARKETSCOM:EURUSD is now in a slight correction mode. Will the bears take control from here? Let's have a look.
FX_IDC:EURUSD
Let us know what you think in the comments below.
Thank you.
77.3% of retail investor accounts lose money when trading CFDs with this provider. You should consider whether you understand how CFDs work and whether you can afford to take the high risk of losing your money. Past performance is not necessarily indicative of future results. The value of investments may fall as well as rise and the investor may not get back the amount initially invested. This content is not intended for nor applicable to residents of the UK. Cryptocurrency CFDs and spread bets are restricted in the UK for all retail clients.

Detailed technical analysis of the ETH/USD chart🧭 General Context (1D, Long-Term):
The chart covers the period from approximately September 2023 to June 2025.
ETH/USD has gone through a complete cycle: growth → decline → correction → potential consolidation/accumulation.
🔹 Market Structure (Price Action)
🔸 Trends:
November 2023 – March 2024: strong uptrend, ETH reaches highs around $4,000+
March 2024 – February 2025: clear downtrend ending with a local low around $1,600
February 2025 – May 2025: dynamic rebound – probable trend change (new higher low + higher high)
May – June 2025: currently consolidating between ~$2,400–2,800
📉 Key Support and Resistance Levels
Type Level Notes
🔴 Resistance ~2,800 – 2,900 Local high, many candles with shadows rejected from above
🟡 Resistance ~3,200 – 3,400 Beginning of strong declines from 2024
🟢 Support ~2,300 – 2,400 Local lows in June 2025
🟢 Strong support ~1,600 – 1,800 Final market low of March 2025 (possible accumulation phase)
📊 Technical indicators
✅ Stochastic RSI (at the bottom of the chart):
Currently in the oversold zone (~0–20) → may signal a potential bottom / buying opportunity
Red-blue lines are starting to wrap upwards → possible rebound
Recent crossovers of the indicator corresponded to local price movements
🔍 Technical formations
⚠️ Possible formations:
Double Bottom: February–March 2025 → classic trend reversal formation
Rising Channel: from March 2025 to present – prices are moving in a slightly rising channel
Current consolidation may be a bull flag (continuation after the increase)
📌 Summary – scenarios
🟢 Bullish scenario:
Breakout of resistance ~2,800 → possible test of levels 3,200 – 3,400 USD
Confirmation of a higher low → continuation of the uptrend
Stochastic RSI in the oversold zone → potential for an uptrend
🔴 Bearish scenario:
Drop below 2,300 USD → possible return to the area of 1,800–1,600 USD
Breakout of the structure of higher lows
Confirmation that the increase was only a correction
🧠 Final conclusions
Currently, ETH/USD is in a key decision zone: after a strong rebound, the market is resting.
Stochastic RSI suggests a potential upside impulse, but requires confirmation by a breakout of resistance.
For traders: 2,800 (resistance) and 2,300 (support) are worth watching.
For investors: 1,600–1,800 could be considered a long-term accumulation zone.

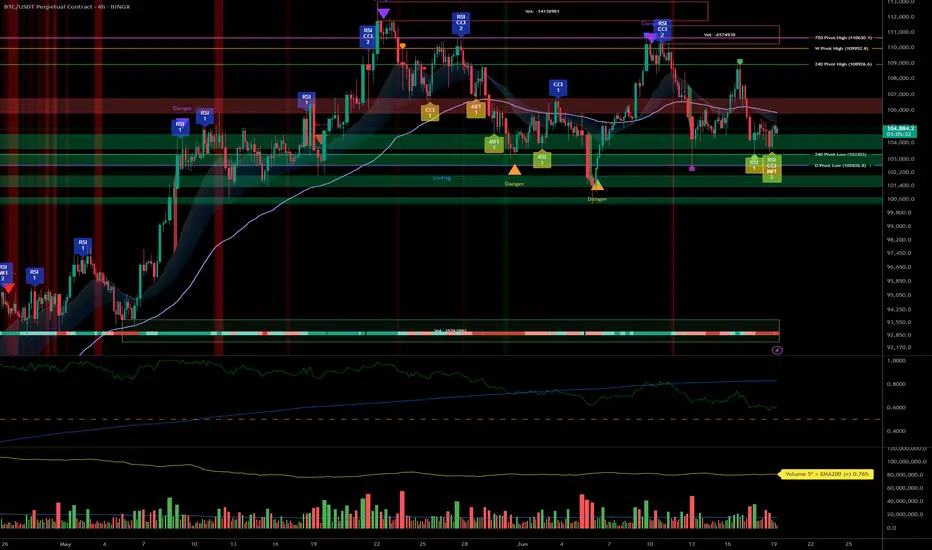
BTC – Bullish bias under review: 102k/103k supports in focus__________________________________________________________________________________
Technical Overview – Summary Points
__________________________________________________________________________________
Momentum : Dominant on all major timeframes (1D, 12H, 6H, 4H). Risk On / Risk Off Indicator signals STRONG BUY except on 15min (neutral).
Support/Resistance : Structurally key pivot zone 102k–106k; major supports 102k/103k. Potential breakout above 106k (swing target 109k).
Volumes : Normal across all timeframes. No excess signals, no accumulation/capitulation peaks.
Multi-TF Behaviors : Horizontal consolidation with bullish dominance. Short-term bearish divergence on 2H–15min, micro-TF in correction only, no panic.
__________________________________________________________________________________
Strategic Summary
__________________________________________________________________________________
Global Bias : Solid bullish structure as long as 102k/103k hold. “Risk On” maintained by sector outperformance.
Opportunities : Entries on pullback/main base 103k–104k; breakouts to watch above 106k.
Risk Zones : Clear invalidation <102k, potential rapid flush to 97k–88k; keep strict stop-loss below 102.5k.
Macro Catalysts : FOMC, Fed projections, Middle East geopolitics keep volatility high, but no shock. Price action leads near-term strategy.
Action Plan : Swing buy on confirmed support, dynamic hedge post-news, monitor volumes/closures on key pivots.
__________________________________________________________________________________
Multi-Timeframe Analysis
__________________________________________________________________________________
1D : Bullish momentum, major supports intact (102k/105k). Risk On / Risk Off Indicator = STRONG BUY, stable volume, no excess. Healthy structure for long swings.
12H : Positive bias, range 102.6k–106k. Risk On / Risk Off Indicator = STRONG BUY.
6H : Presumed accumulation 103k–106k, momentum still strong. No volume weakness.
4H : Range oscillation, structural support test at 103k. Sector outperformance, neutral volume.
2H : First sign of short-term weakness. Divergent with higher TFs but no panic.
1H : Technical rebound towards 104.8k possible as long as 103k support holds.
30min : Short-term trend remains bearish (trend 30min = down). Correction/purge ongoing.
15min : Neutral momentum, supports being tested. No panic or melt-down observed.
Summary : Strong bullish confluence on higher TFs, temporary divergence on micro-TFs. “Range with bullish bias” scenario as long as 102k/103k holds the structure.
__________________________________________________________________________________
Macro and Fundamental Analysis
__________________________________________________________________________________
FED/FOMC (June 18) : Rates unchanged, “data dependent” guidance. Raised volatility but no risk-off shift.
Market Sentiment : BTC technical structure holds, moderate post-FOMC volatility.
S&P500 : Above all key moving averages. Sector momentum (software, uranium, semis) remains dominant.
Energy Level : Weak oil = little macro pressure against BTC.
Geopolitics : Israel–Iran escalation / US posture reinforced. High FX/oil volatility but BTC resilient (>102k), no panic on record.
Economic Calendar : Closely watching BoE & SNB, but low BTC impact odds.
Implications : Post-news phase = ideal for range trading, no rupture event expected within 48h.
__________________________________________________________________________________
Strategic synthesis & R/R guidance
__________________________________________________________________________________
Long on pullback 103–104k, swing targets 106/109k. Optimal R/R (>2.5) if stop 102.5k (D Pivot Low).
Invalidation area : Clean close <102k or heavy downside volume (capitulation via ISPD/volumes).
Risk Management : Dynamic stops, partial hedge post-FOMC during macro volatility.
Conclusion : Bullish structure preserved. Range trading scenario dominant, no extreme signals or panic. Actions: support watch, technical buy on confirmed pullback.
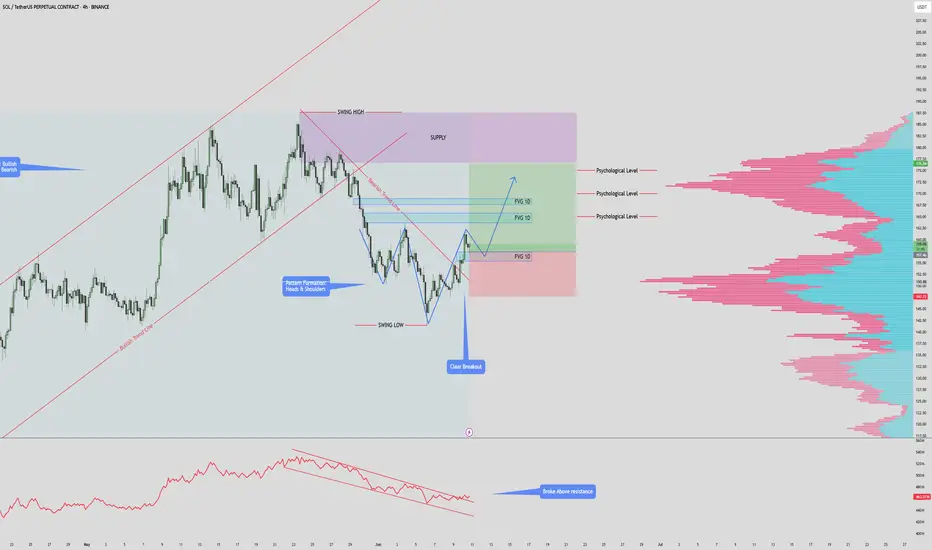
$SOLANA $180 PUMP INCOMINSOL/USDT – 4H Chart Summary
Market Structure:
HTF: Bullish trend remains intact.
LTF: Previously bearish, now showing early signs of a bullish reversal.
Pattern Formation:
Potential Inverse Head & Shoulders forming.
Neckline at $157 — must hold for pattern to complete.
Break above previous high will invalidate Inverse Head & Shoulders.
Trendline & Breakout:
Price has broken above the descending bearish trendline.
Indicates a momentum shift from bearish to bullish.
Fair Value Gaps (FVG):
1D FVG below current price – potential retest & long entry zone.
2x 1D FVG above price – act as targets or supply areas.
Psychological Levels & Volume:
Key levels at $165, $170, $175.
Volume profile shows high liquidity at each of these levels – strong TP zones.
OBV Indicator:
OBV has broken above resistance – supports bullish continuation.
Trade Scenarios:
Bullish Setup:
Long on retest of lower FVG zone ($142–$145).
Target TPs: $165 → $170 → $175 (align with psychological & high-volume areas).
Invalidation:
Break below FVG support or failure to hold above $142.
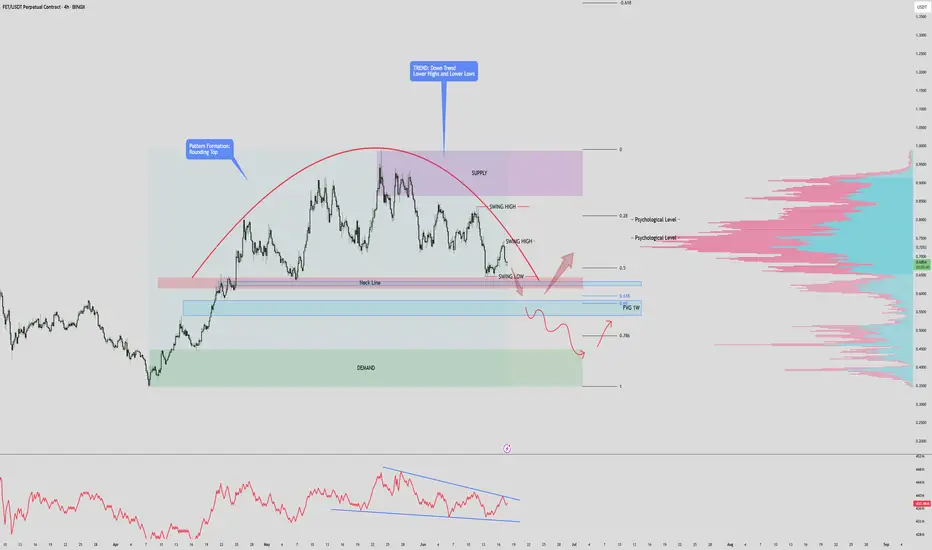
$FET 4Hr Time frame DUMP before PUMP? $1 Recovery!FET/USDT – 4H Time Frame Analysis
Pattern Formation: A rounding top is clearly visible, suggesting weakening bullish momentum and potential trend reversal.
Trend Structure: Price is forming lower highs and lower lows, confirming a bearish trend.
Key Zones:
Supply Zone: $0.85 – $0.975
Demand Zone: $0.35 – $0.45
Neckline Support: Price is approaching a critical neckline level. A break below this could trigger strong downside movement.
Weekly FVG & Fib Confluence:
Below the neckline lies a weekly Fair Value Gap (FVG).
The 0.618 Fibonacci retracement aligns with this zone, forming a golden pocket — a key support area.
Scenario 1 – Bullish Reversal:
If price holds above the golden pocket, a bounce could push it back toward psychological levels (e.g., $0.70 and $0.80)
Scenario 2 – Bearish Continuation:
If price fails to hold the FVG/GP zone, this invalidates bullish setups.
Expect a breakdown targeting the $0.35–$0.45 demand zone.
GBPUSD SHORTThe GBP/USD pair has been showing signs of exhaustion after a recent rally, and I'm looking for a potential pullback to enter a short position.
While GBP/USD has shown resilience, the technical and fundamental setup suggests a potential short opportunity on a pullback. Confirmation through price action (e.g., bearish engulfing patterns, break of structure) will be crucial before entering.

Gold Breaks the Range: Trend Reversal or Just a Fakeout?XAUUSD – Gold Breaks the Range: Trend Reversal or Just a Fakeout?
After several days of sideways action, gold has finally broken out of its consolidation channel — but not upward. The price action signals uncertainty, while underlying global risks suggest a larger move may be brewing. With US markets closed for a bank holiday, low liquidity could lead to sharp, unexpected spikes — traders, stay alert.
🌍 Macro & Fundamental Outlook
📌 As widely expected, the Federal Reserve held rates steady, but Fed Chair Powell maintained a hawkish tone, warning that inflation risks remain due to ongoing geopolitical instability and rising commodity costs.
🔥 The gold market now hinges on two major geopolitical scenarios in the Middle East:
If the US intervenes diplomatically to ease tensions between Iran and Israel, gold may continue to correct further — possibly into the 3,325 – 3,300 range or lower.
However, if reports are accurate that Trump is coordinating with Israel for potential strikes on Iran, gold could spike aggressively as safe-haven demand surges toward 3,417 – 3,440.
📊 Technical Breakdown (M30 – H1)
Price has broken below the range-bound structure, suggesting a potential momentum shift to the downside.
The EMA cluster (13–34–89–200) is sloping downward, confirming bearish short-term pressure.
The 3,345 level has acted as support, but if it gives way, 3,325 becomes a critical liquidity zone where buyers may step in.
✅ Trading Plan
🟢 BUY ZONE 1: 3,325 – 3,328
Entry: Only after a clear bullish reversal (pin bar / bullish engulfing candle)
SL: Below 3,320
TP: 3,345 → 3,360 → 3,373 → 3,384
🟢 BUY ZONE 2: 3,345 – 3,348
Entry: On price retest and bullish confirmation
SL: Below 3,340
TP: 3,360 → 3,373 → 3,384 → 3,403
🔴 SELL ZONE: 3,417 – 3,440
Entry: If price rallies into resistance with no supporting fundamentals
SL: Above 3,445
TP: 3,403 → 3,384 → 3,360 → 3,345
💬 Final Thoughts
Gold is at a pivotal point. While today’s break could indicate a new leg down, we’ve seen countless false breakouts during low liquidity sessions. Only trade on confirmation — not emotion. Watch for geopolitical headlines and let price action guide your risk-adjusted decisions.
Stay patient. Stay sharp. Let the market prove itself before you do.

GBP/USD - For FOMC & Fed Interest RateThe GBP/USD pair on the M30 timeframe presents a Potential Buying Opportunity due to a recent Formation of a Channel Pattern. This suggests a shift in momentum towards the upside and a higher likelihood of further advances in the coming hours.
Possible Long Trade:
Entry: Consider Entering A Long Position around Trendline Of The Pattern.
Target Levels:
1st Resistance – 1.3567
2nd Resistance – 1.3682
🎁 Please hit the like button and
🎁 Leave a comment to support for My Post !
Your likes and comments are incredibly motivating and will encourage me to share more analysis with you.
Best Regards, KABHI_TA_TRADING
Thank you.
Disclosure: I am part of Trade Nation's Influencer program and receive a monthly fee for using their TradingView charts in my analysis.

Smart Money Zones Revealed (XAUUSD) Is Gold Just Breathing or Breaking? Smart Money Zones Revealed (XAUUSD)
🔍 Macro & Sentiment Overview
Gold faced a sharp correction after a strong Asian session rally, which caught many traders off guard...
While the US Dollar gained 0.7% due to safe-haven flows and Fed anticipation, gold's dip seems more like a liquidity sweep than a structural reversal...
🌍 Rising geopolitical tensions — especially Iran–Israel and Trump’s comments about Tehran — keep the fear premium alive…
🛢️ Meanwhile, oil prices are surging, and institutional funds might be rotating capital between commodities and equities...
📝 All eyes are now on the Fed’s rate decision and the US retail sales report — a potential "horror print" that could shock rate expectations and trigger high volatility across markets.
📉 Technical Breakdown (M30 Perspective)
Price pulled back sharply after an overextended bullish move from Asian FOMO…
EMAs (13, 34, 89, 200) show early signs of potential crossover — signaling caution for buyers…
Liquidity gaps (FVG zones) below current price indicate a magnet for institutional fills…
🎯 Trade Setup
🔵 BUY ZONE: 3345 – 3343
Stop-Loss: 3339
Take Profits:
3350 → 3354 → 3358 → 3362 → 3366 → 3370 → 3380 → 3400 → ???
🧠 Look for confirmation through price action and rejection candles during London/NY sessions before entering.
🔴 SELL ZONE: 3442 – 3444
Stop-Loss: 3448
Take Profits:
3438 → 3434 → 3430 → 3425 → 3420 → 3410 → 3400
⚠️ Only short upon clean rejection and strong bearish confirmation patterns — avoid blind entries in this volatile phase.
🧠 Final Thoughts
Gold is moving within a smart money playbook — triggering stop hunts and liquidity grabs. With macro uncertainty ahead, patience and precision matter more than ever.
Let price come to your zones. Don’t chase. Let volatility serve you — not shake you.
📌 Follow this idea for live updates during the Fed press conference and NY session.
Fundamental Market Analysis for June 18, 2025 EURUSDEvent to pay attention to today:
12:00 EET. EUR - Consumer Price Index
15:30 EET. USD - Unemployment Claims
21:00 EET. USD - FOMC Rate Decision
Declining confidence in the US economy amid trade policy is undermining the US Dollar (USD) against the Euro (EUR). Data released by the US Census Bureau on Tuesday showed that US retail sales fell 0.9% m/m in May, compared to a 0.1% decline (revised from +0.1%) recorded in April. The figure was weaker than estimates of -0.7%. Meanwhile, US industrial production in May declined 0.2% m/m vs. 0.1% previously (revised from 0%), worse than expectations of 0.1%.
Traders expect the US Federal Reserve to leave borrowing costs unchanged at its June meeting on Wednesday. Markets now estimate a nearly 80% chance that the Fed will cut rates in September and then another in October, according to Reuters.
The mood of European Central Bank (ECB) policymakers is supportive of the common currency. ECB President Christine Lagarde said that rate cuts are coming to an end as the central bank is now in a “good position” to deal with the current uncertainty.
Meanwhile, investors will keep an eye on geopolitical risks. Israel is set to step up strikes on Tehran, while the US is considering expanding its role amid rising tensions between Israel and Iran.
Trade recommendation: SELL 1.1460, SL 1.1560, TP 1.1260
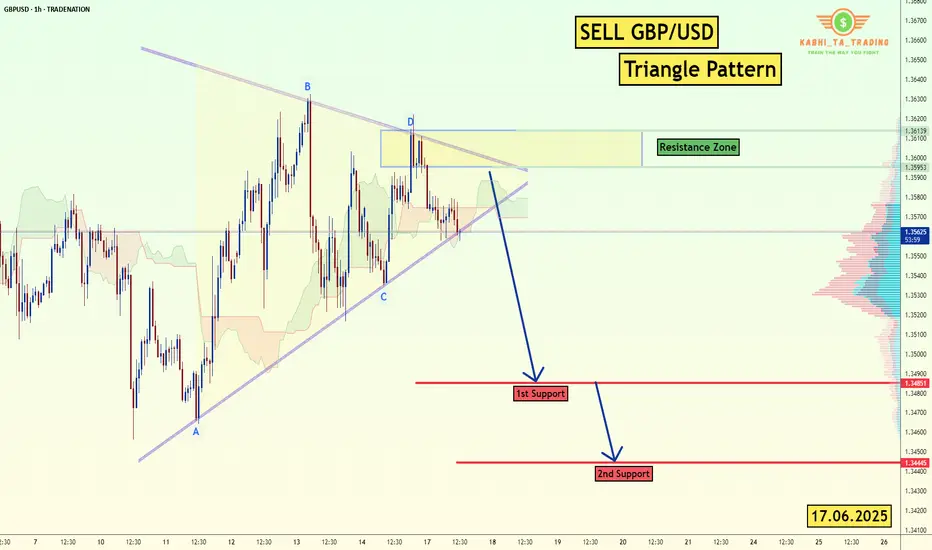
GBP/USD - H1-Triangle Breakout (17.06.2025)The GBP/USD Pair on the H1 timeframe presents a Potential Selling Opportunity due to a recent Formation of a Triangle Breakout Pattern. This suggests a shift in momentum towards the downside in the coming hours.
Possible Short Trade:
Entry: Consider Entering A Short Position around Trendline Of The Pattern.
Target Levels:
1st Support – 1.3485
2nd Support – 1.3444
🎁 Please hit the like button and
🎁 Leave a comment to support for My Post !
Your likes and comments are incredibly motivating and will encourage me to share more analysis with you.
Best Regards, KABHI_TA_TRADING
Thank you.
Disclosure: I am part of Trade Nation's Influencer program and receive a monthly fee for using their TradingView charts in my analysis.
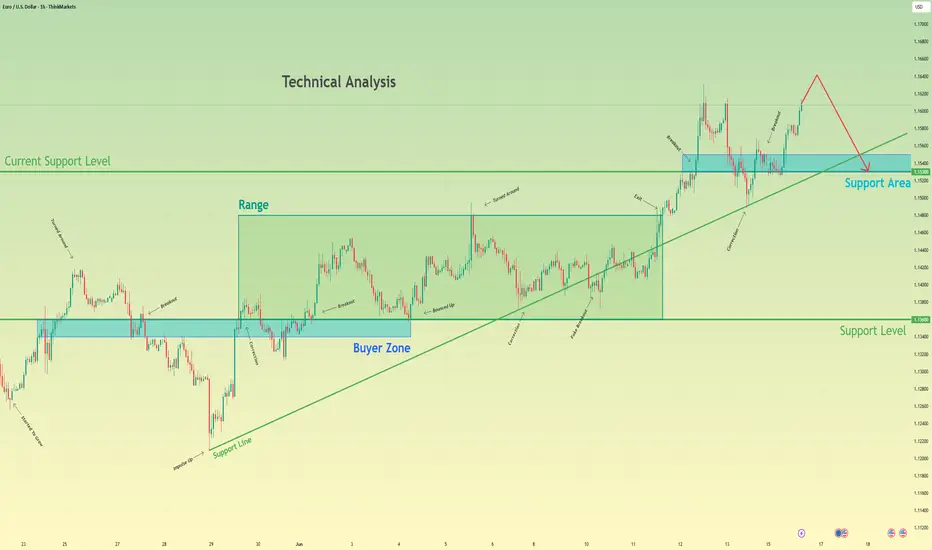
Euro can turn around and start to fall to support areaHello traders, I want share with you my opinion about Euro. Observing this chart, we can see how the price earlier dropped toward the 1.1360 support level and successfully broke it. Then we saw a short recovery move, but the price once again returned to the downside and retested the support line from below. After that, the market created a strong upward impulse, broke back above the 1.1360 level, and entered a phase of consolidation inside a range. This range held for some time, with price respecting both its upper and lower boundaries. Eventually, we saw a breakout from this consolidation, followed by another strong bullish impulse and a steady climb above the 1.1530 zone, where price is currently trading. However, the price has now approached a critical structure and is showing signs of weakening momentum. In my mind, the Euro may attempt one more small move up but then turn around and start declining toward the 1.1530 support level, breaking the ascending support line as well. That's why my TP is this support level, which coincides with the support area. Please share this idea with your friends and click Boost 🚀
Disclaimer: As part of ThinkMarkets’ Influencer Program, I am sponsored to share and publish their charts in my analysis.
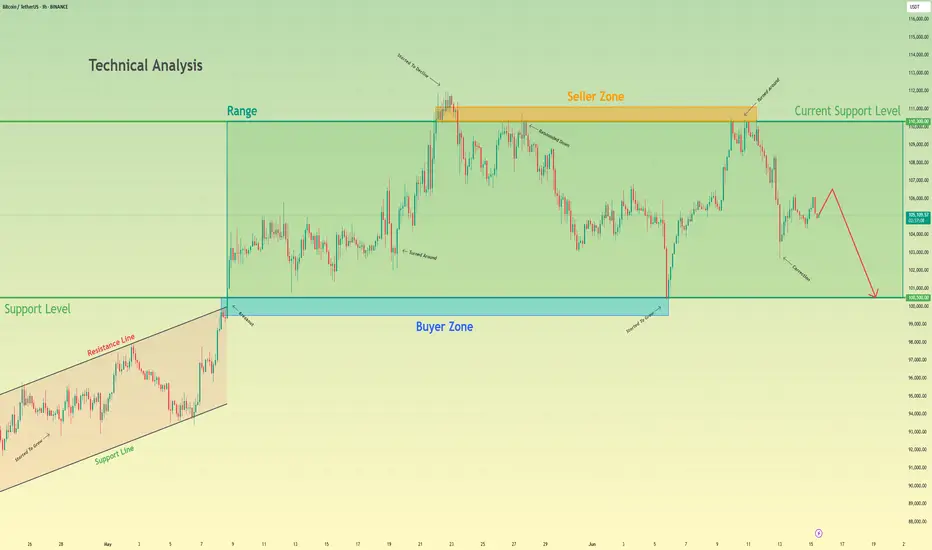
Bitcoin will make a small upward move and then continue to fallHello traders, I want share with you my opinion about Bitcoin. Earlier, the price was confidently growing inside an Upward Wedge, showing a series of higher highs and higher lows. This rising structure was supported by consistent momentum until BTC reached the seller zone between 110300 and 111100, where the growth slowed down and started to fade. From there, the price rejected this resistance and shifted into a Range, bounded by 100500 and 110300. BTC has been fluctuating inside this horizontal structure for some time, unable to break above the seller zone or below the buyer support. Now BTC is showing signs of weakness, forming a minor correction and struggling to reclaim previous highs. Given this structure and rejection from the seller zone, I expect BTC to make a small upward move and then start a decline toward the support level at 100500, which also coincides with the bottom of the range and acts as a strong psychological level. For this reason, I set my TP at 100500 points. Please share this idea with your friends and click Boost 🚀