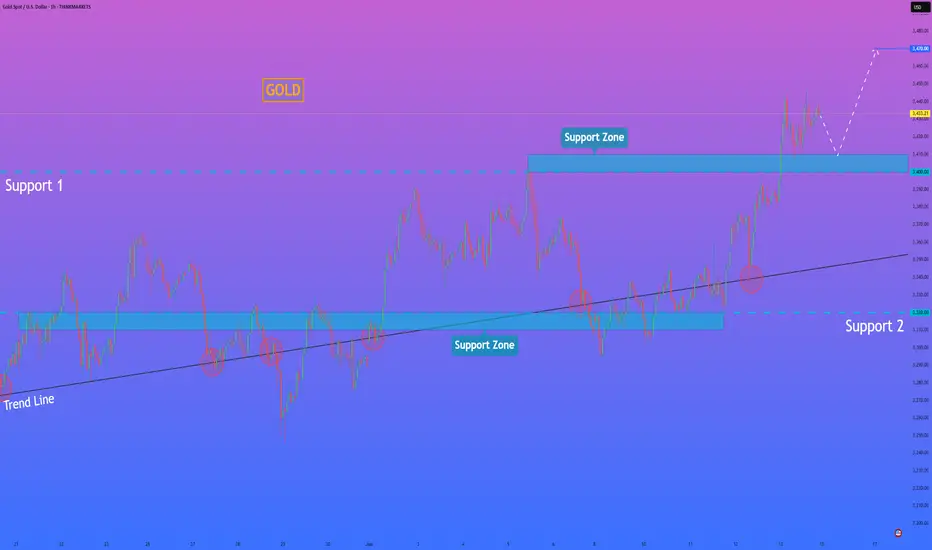
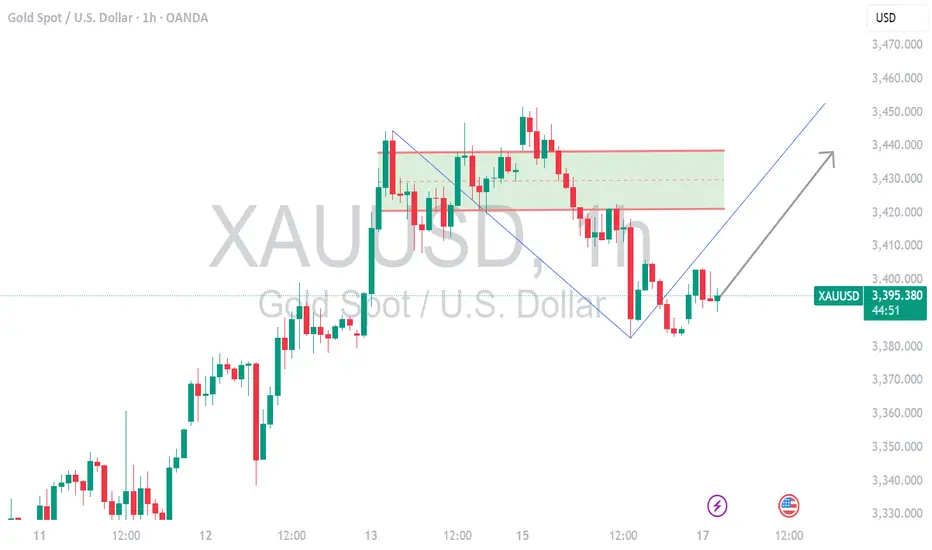
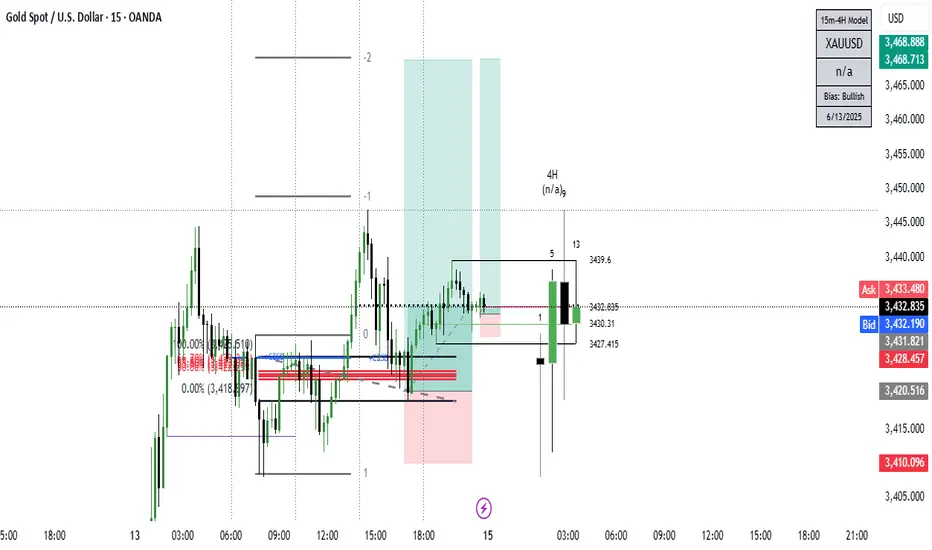
HelenP. I Gold may correct to support zone and then rebound upHi folks today I'm prepared for you Gold analytics. After rebounding from the trend line, XAUUSD began to grow steadily within the rising structure, confidently pushing through local resistance and breaking above the previous support 2 area. This breakout was backed by strong bullish momentum, with the price clearly holding above the broken level, turning it into a support base. Following that surge, the price entered a short-term consolidation, trading within the upper boundary of the chart, just above the 3400 level. This area now acts as a crucial support zone, and the market is currently hovering slightly above it after a local peak. Given the strength of the recent impulse and the confirmation of previous resistance as support, I expect a brief correction to the support zone before a continuation of the bullish move. That’s why I set my current goal at 3470 points — the next potential resistance area where the price may encounter renewed selling pressure after the rally continues. If you like my analytics you may support me with your like/comment ❤️
Disclaimer: As part of ThinkMarkets’ Influencer Program, I am sponsored to share and publish their charts in my analysis.
Analysis
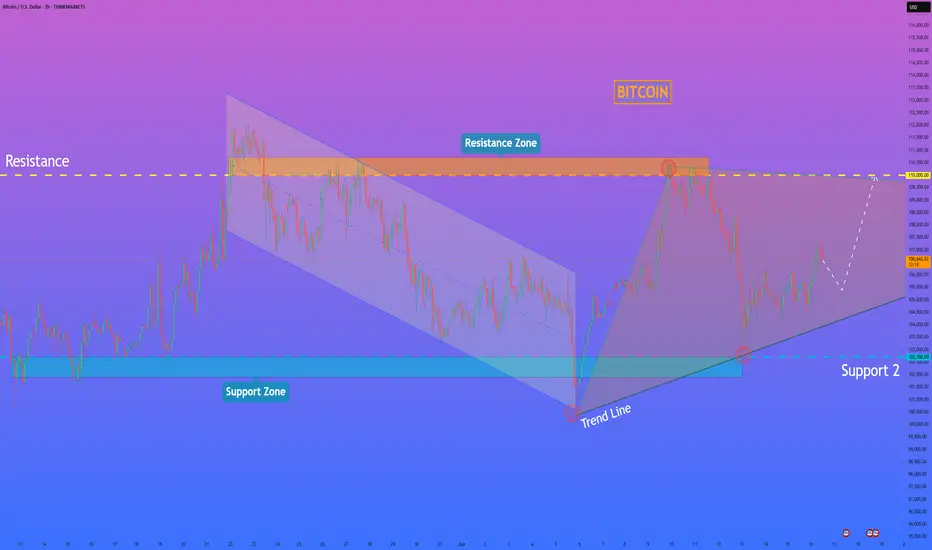
HelenP. I Bitcoin will continue to move up inside triangleHi folks today I'm prepared for you Bitcoin analytics. After rebounding from the support level, the price initially showed strength and moved upward. However, the bullish momentum was short-lived, and the price began a downward correction, forming a well-defined descending channel. During this decline, the price dropped below the support zone, confirming short-term bearish dominance. Despite this breakdown, bulls regained control, and the price started forming a series of higher lows, resulting in the development of a symmetrical triangle. This structure signals compression and potential preparation for a breakout. The current price action confirms that BTC is now recovering within this triangle, supported by the upward trend line drawn from the recent lows. Given the strength of this recovery and the stabilization above the support zone, I expect the price to make a small correction and then continue climbing toward the resistance level at 110000. That’s why my current goal remains focused on this level, representing both a psychological and technical barrier aligned with previous local highs. If you like my analytics you may support me with your like/comment ❤️
Disclaimer: As part of ThinkMarkets’ Influencer Program, I am sponsored to share and publish their charts in my analysis.
Oil Rises, Canadian Yields Surge: Can USD/CAD Rebound?USDCAD 17/06 – Oil Rises, Canadian Yields Surge: Can USD/CAD Rebound?
After a significant drop to the 1.355x area, USD/CAD is showing early signs of recovery. However, the pair remains influenced by strong macro headwinds—particularly oil prices and Canadian monetary policy signals.
🌐 Macro & Sentiment Overview
WTI crude oil is rising due to ongoing tensions between Israel and Iran, which increase the risk of global supply disruptions. This supports the Canadian Dollar (CAD) as a commodity-linked currency.
Canada’s 10-year bond yields have reached their highest levels in 5 months (~3.4%), reinforcing expectations that the BoC may remain hawkish in the near term.
USD weakens slightly as traders await more clarity from the Federal Reserve about the next rate cut timeline, potentially in Q3.
📊 Technical Analysis (M30 Chart)
Price is printing higher lows above the key trendline.
EMAs 13–34–89 are tightening → sign of sideways pressure before breakout.
Short-term bullish channel still intact.
Key resistance zones: 1.3581 and 1.3605.
🎯 Trade Setup Scenarios
📈 Long Scenario
Entry: 1.3556 – 1.3560 (trendline bounce)
Stop Loss: 1.3535
Take Profits: 1.3581 → 1.3605
✅ Wait for M30/H1 confirmation like bullish engulfing or price-action breakout.
📉 Short Scenario
Entry: 1.3605 (if price rejects resistance)
Stop Loss: 1.3630
Take Profits: 1.3581 → 1.3556
⚠️ Trigger only on bearish rejection with strong candle and volume at resistance.
📌 Strategic Outlook
USD/CAD is caught in a tug-of-war: stronger Canadian fundamentals (oil + yields) vs. cautious USD movement post-FOMC. If oil prices and Canadian yields continue to climb, CAD may remain in favor. However, short-term technical rebounds toward 1.3600 remain valid if price structure holds.

Squeeze in Progress: Will BOJ Trigger the Next Breakout?USDJPY 17/06 – Squeeze in Progress: Will BOJ Trigger the Next Breakout?
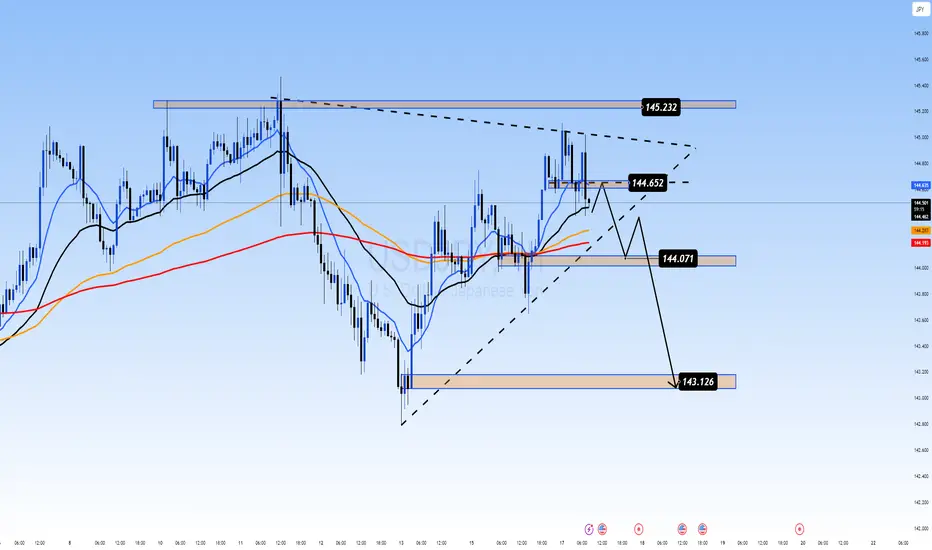
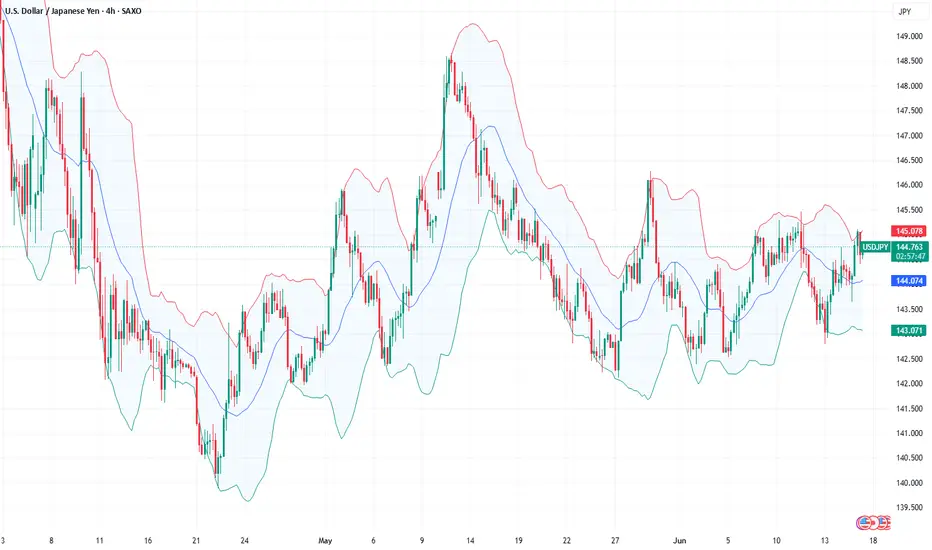
The USDJPY pair is currently consolidating just below the key 144.650 resistance, stuck within a tightening triangle structure. As markets await more clarity from both the Bank of Japan (BOJ) and the Fed, price action is showing signs of indecision — but pressure is building.
🌐 Macro & Sentiment Overview
BOJ maintains a neutral stance: Despite growing speculation of a hawkish shift, the BOJ held rates steady, providing no strong forward guidance. Markets remain cautious.
US Dollar remains resilient amid stable bond yields and expectations that the Fed may delay rate cuts, adding short-term support to USDJPY.
Geopolitical risk is on the rise: Ongoing Middle East tensions are fueling safe-haven demand for JPY, capping bullish momentum.
🔍 Technical Setup (M30 Chart)
Price is trapped inside a symmetrical triangle, tightening between 144.652 resistance and 143.126 support.
EMA 13/34/89 are aligned bullishly, but EMA 200 (red) is acting as a dynamic ceiling near 144.300.
Key support zones:
144.071: Minor structural level and trendline test.
143.126: Major liquidity zone and untested demand.
🎯 Trade Scenarios
📉 Scenario 1 – Sell on Rejection at 144.652
Entry: 144.650–144.700
Stop Loss: 145.250
Take Profit: 144.071 → 143.600 → 143.126
Ideal if BOJ shifts tone or USD weakens post-Fed comments.
📈 Scenario 2 – Buy on Bullish Reaction at 143.126
Entry: 143.100–143.150
Stop Loss: 142.700
Take Profit: 143.600 → 144.071 → 144.650 → 145.200
Valid only with clear bullish confirmation on M15–M30 structure.
🧠 Final Thoughts
USDJPY is coiling tightly ahead of a potential breakout. Macro uncertainty from central banks, geopolitical instability, and upcoming CPI data make this week highly volatile. Instead of chasing, let price come to your zones and react accordingly.
🔔 Focus on structure, confirm with price action, and avoid emotional trades. Patience and discipline are key in this compression phase.
The Calm Before the Storm: All Eyes on UK CPI & Central BanksGBPUSD 17/06 – The Calm Before the Storm: All Eyes on UK CPI & Central Banks
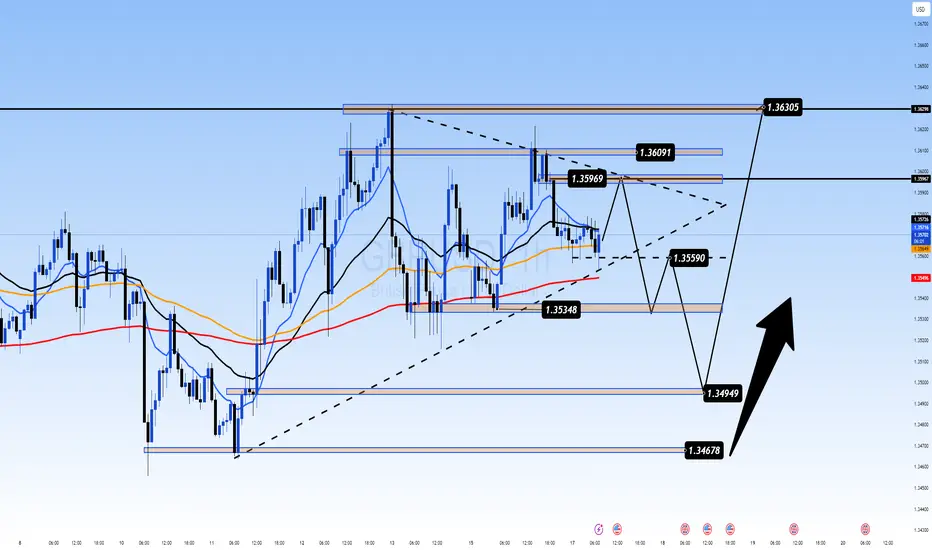
The GBPUSD pair is coiling in a tight range near the mid-1.3500s as traders brace for two high-impact events: UK CPI data on Wednesday and interest rate decisions from both the Fed and BoE this week. Price remains supported above the 200 EMA and is compressing within a symmetrical triangle – typically a precursor to a major breakout.
📊 Macro & Fundamental Outlook
🔹 Federal Reserve (FOMC): Expected to hold rates steady, but growing anticipation of a dovish tilt toward September is weighing slightly on the USD.
🔹 Bank of England (BoE): Markets are pricing in deeper rate cuts following recent UK GDP weakness, pressuring the GBP in the short term.
🔹 Geopolitical Risks: Rising Middle East tensions are fuelling demand for USD as a safe haven, reinforcing its strength ahead of data events.
📝 Bottom Line: The CPI release could be the first trigger to shift GBPUSD’s current consolidation. A hot inflation print might push GBP higher; a miss could fuel further downside.
🔧 Technical Analysis (H1 Chart)
Price is ranging between 1.3535 (support) and 1.3609 (resistance)
EMAs 13/34 crossing below EMA 89 → signal of potential bearish continuation
Uptrend line from 1.3467 is still intact and acting as dynamic support
Break below 1.3559 may lead to a move toward 1.3495 and 1.3467
A confirmed breakout above 1.3609 opens the door to 1.3630+
🎯 Trade Scenarios
Scenario 1 – Buy from Trendline Support
Buy Zone: 1.3495 – 1.3467
Stop Loss: 1.3440
Targets: 1.3535 → 1.3559 → 1.3596 → 1.3630
🟢 Best setup if price prints a bullish engulfing or hammer candle on key support + UK CPI surprise.
Scenario 2 – Sell on Resistance Rejection
Sell Zone: 1.3609 – 1.3630
Stop Loss: 1.3660
Targets: 1.3590 → 1.3559 → 1.3535 → 1.3495
🔴 Only valid with strong rejection signals + softer UK data or hawkish Fed tone.
💡 Market Sentiment
Retail traders are trapped in a waiting zone – expecting a breakout
Institutions may push price into one direction pre-data to collect liquidity
Risk appetite is fragile, and traders are cautious ahead of back-to-back central bank announcements
📌 Final Thoughts
GBPUSD is preparing for volatility. Instead of chasing moves, let the market come to your key zones and react with discipline. The 1.3467–1.3495 support area could be crucial for the next directional move.
Stay patient. Wait for confirmation. Respect your risk.
Gold’s Game of Traps: Is the Dip a Setup for a Bigger Move? Gold’s Game of Traps: Is the Dip a Setup for a Bigger Move?
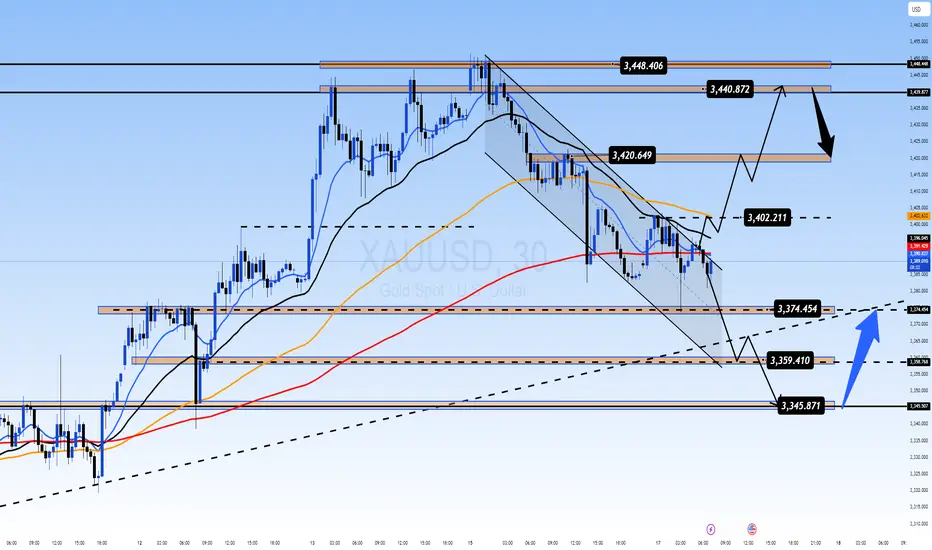
After an aggressive rally fueled by geopolitical FOMO headlines, gold (XAUUSD) saw a sudden pullback — but what looked like weakness might actually be a setup for smart accumulation. The market narrative is shifting, and price action is sending important signals...
🌍 Global Drivers Behind the Volatility
Middle East conflict between Israel and Iran continues to escalate, prompting global safe haven flows. Evacuation warnings and nuclear deal pressure add more uncertainty to the mix.
Despite bullish news, gold failed to hold its highs — a potential bull trap as institutional players took advantage of retail FOMO to offload.
Big capital may now be rotating from gold into other sectors like energy (oil) and discounted equity assets.
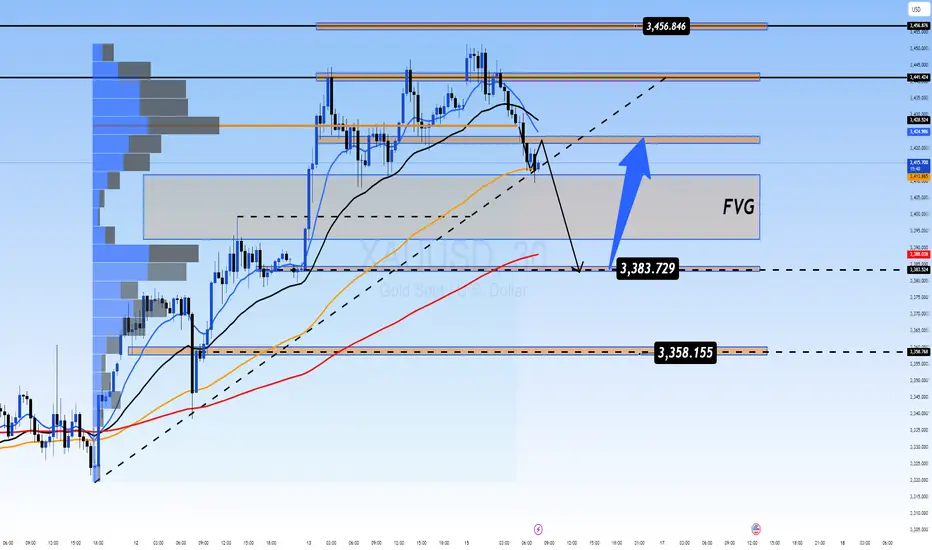
📉 Price Action & Technical Outlook (M30–H1)
After topping around 3442–3440, price snapped back into the mid-range — a sign of liquidity hunting rather than a full reversal.
The EMAs (13/34/89/200) on the M15–M30 timeframes are showing early signs of bearish crossover, hinting at further short-term weakness.
Below current price sits a clean Fair Value Gap (FVG) that could act as a magnet — aligning with a high-probability buy zone.
🎯 Trading Playbook
✅ BUY Setup – "Smart Money Entry Zone"
Buy Zone: 3342 – 3344
Stop Loss: 3338
Take Profit Targets:
→ 3348 → 3352 → 3356 → 3360
→ 3364 → 3368 → 3372 → 3380+
💡 Look for price to tap into the FVG and form a base with bullish confirmation (engulfing candle, divergence, or rising volume) before entering.
❌ SELL Setup – "Fade the Overhead Resistance"
Sell Zone: 3440 – 3442
Stop Loss: 3446
Take Profit Targets:
→ 3436 → 3432 → 3428 → 3424
→ 3420 → 3415 → 3410
⚠️ Only short on a strong rejection or bearish engulfing candle near the resistance — do not short blindly.
🧠 Market Psychology Insight
The initial Asian-session rally was likely a news-driven liquidity event.
Institutions appear to be rotating capital, using emotional retail entries as exit liquidity.
Current market conditions suggest a shakeout before a longer-term bullish move.
📌 Final Note
Don’t chase price. Let it come to your zones. This market is being driven by geopolitical narrative and smart money behavior, not just technicals alone.
✅ Stay patient.
📊 Trade with logic.
🧘♂️ Let others FOMO — you focus on levels and confirmation.
👉 Follow for real-time London session updates and reaction-based entries.
Fundamental Market Analysis for June 17, 2025 USDJPYThe Japanese yen (JPY) continues to experience significant pressure against the US dollar (USD), showing a three-day decline and trading above the key psychological level of 145.000. This weakening is largely due to growing market expectations that the Bank of Japan (BoJ) may delay raising rates until the first quarter of next year. The main reason for this delay is said to be the continuing uncertainty surrounding future US tariff policy, which could have a significant impact on global trade flows and Japan's economic growth. Moderate but steady growth in the US dollar is also contributing to the strengthening of the USD/JPY position, pushing the pair to new highs during the Asian trading session.
However, market participants are cautious about aggressive bearish bets against the yen ahead of the upcoming Bank of Japan monetary policy meeting. This meeting is seen as a critical event that could provide additional signals about the central bank's long-term policy outlook. Any hints of a change in tone or new assessments of the economic situation will be carefully analyzed by traders.
In addition to central bank decisions, growing geopolitical tensions in the Middle East may help limit deeper losses for the Japanese yen. As a traditional “safe haven,” the yen typically attracts investors during periods of global instability, which may offset some of the negative impact of interest rate differentials. In addition, the outlook for the USD/JPY pair is influenced by the growing recognition that the US Federal Reserve (Fed) may lower borrowing costs in 2025. Expectations of future Fed rate cuts could hinder further strengthening of the US dollar and thus limit the upside potential of the USD/JPY pair. Overall, the market remains in anticipation of key decisions that will determine the future trajectory of one of the world's most actively traded currency pairs.
Trading recommendation: SELL 144.550, SL 145.000, TP 143.600
Bitcoin Strategic Interval, CME Dislocation and Macro Friction.⊢
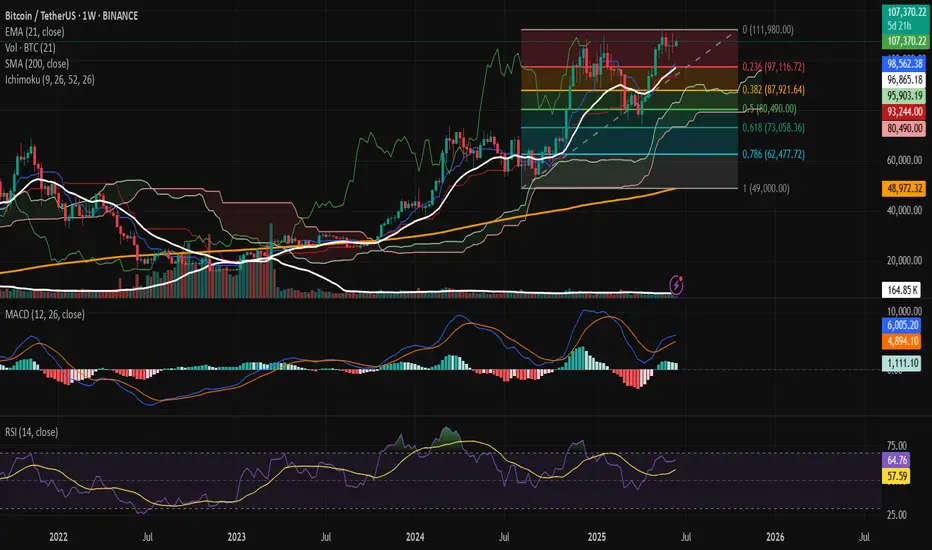
𝟙⟠ - BTC/USDT - Binance - (CHART: 1W) - (June 17, 2025).
⟐ Analysis Price: $106,851.31.
⊢
I. ⨀ Temporal Axis – Strategic Interval - (1W):
▦ EMA21 – ($96,818.00):
∴ The current candle closes +10.3% above the EMA21, maintaining bullish dominance over the mid-term dynamic average;
∴ This is the 17th consecutive weekly candle closing above the EMA21 since its reclaim in February 2025, forming a structurally intact uptrend;
∴ No violation or wick-close below the EMA21 has occurred since April, and the distance from price to EMA21 remains within a standard deviation of mid-trend movement.
✴ Conclusion: The trend is active and preserved. EMA21 acts as dynamic support and bullish pressure zone. A reversion would only be expected if weekly closes return below $98K with volume confirmation.
⊢
▦ SMA200 – ($48,969.73):
∴ The 200-week simple moving average remains untouched since early 2023, never tested during the current cycle;
∴ The slope of the SMA200 is positive and gradually increasing, indicating a long-term structural trend recovery;
∴ Price stands +118% above the SMA200, a level historically associated with mid-cycle rallies or overheated continuation phases.
✴ Conclusion: The SMA200 confirms long-term bullish structure. Its current distance from price makes it irrelevant for immediate action but critical as the absolute invalidation level of the macro trend.
⊢
▦ Ichimoku – Kumo | Tenkan | Kijun:
∴ Price is above the Kumo cloud, with Span A ($107,172.16) and Span B ($98,562.38) creating a bullish tunnel of support;
∴ The Kijun-sen rests at $95,903.19, slightly below EMA21, and aligns with the last strong horizontal range;
∴ Chikou Span is free from historical candles, confirming trend continuity under Ichimoku principles.
✴ Conclusion: All Ichimoku components are aligned bullish. Pullbacks to the Kijun around $96K would be healthy within a macro-uptrend, and only sub-cloud closes would question this formation.
⊢
▦ Fibonacci - (Swing Low $49,000 – High $111,980):
∴ Bitcoin remains between the (0.236 Fibo - $97,116.72) and local top at $111,980, showing respect for fib-based resistance;
∴ The (0.5 Fibo - $80,490.00) has not been retested since March, confirming the range compression toward upper quadrants;
∴ Weekly price is consolidating under fib extension with decreasing body size, suggesting strength with pause.
✴ Conclusion: The Fibonacci structure confirms bullish extension phase. If $97K breaks, retracement to (0.382 Fibo - $87,921.64) is expected. Otherwise, the breakout above $112K enters full projection territory.
⊢
▦ MACD – (Values: 1,077.98 | 5,963.81 | 4,885.82):
∴ MACD line remains above signal line for the third consecutive week, recovering from a prior bearish cross in April;
∴ The histogram has printed higher bars for four weeks, but the slope of growth is decelerating;
∴ Positive cross occurred just below the zero-line, which often results in delayed reactions or failures unless reinforced by volume.
✴ Conclusion: MACD signals a weak but persistent momentum recovery. Reaffirmation depends on histogram expansion above 1,500+ and signal spread widening.
⊢
▦ RSI – (Close: 64.37 | MA: 57.56):
∴ The RSI is in the bullish upper quadrant, but without overbought extension, suggesting active buying without euphoria;
∴ The RSI has been above its moving average since mid-May, maintaining a healthy angle;
∴ Momentum is not diverging from price yet, but is approaching the 70 zone, historically a point of hesitation.
✴ Conclusion: RSI confirms controlled strength. Further advance without consolidation may trigger premature profit-taking. Above 70, caution increases without being bearish.
⊢
▦ Volume - (16.97K BTC):
∴ Weekly volume is slightly above the 20-week average, marking a minor recovery in participation;
∴ There is no volume spike to validate a breakout, which is common in compressive ranges near resistance;
∴ Volume has been declining since mid-May, forming a local divergence with price highs.
✴ Conclusion: Volume profile supports current levels but does not confirm breakout potential. A rejection with strong volume will mark local exhaustion.
⊢
II. ∆ CME Technical Dislocation – BTC1! Futures:
▦ CME GAP – BTC1! – ($107,445.00):
∴ The CME Futures opened this week at $105,060.00 and closed the previous session at $107,445.00;
∴ A clear unfilled gap persists between $105,060.00 and $107,900.00, with price action hovering just above the top edge;
∴ Bitcoin has a consistent historical behavior of returning to close such gaps within a short- to mid-term range.
✴ Conclusion: The unfilled CME gap acts as a gravitational technical force. As long as price remains below $109K without volume expansion, the probability of revisiting the $105K area remains elevated.
⊢
III. ∫ On-Chain Intelligence – (Source: CryptoQuant):
▦ Exchange Inflow Total - (All Exchanges):
∴ Current inflow volume remains below the 1,000 Bitcoin daily threshold, indicating no panic selling or institutional exits;
∴ This inflow level corresponds to accumulation or holding phases, rather than distribution;
∴ The pattern matches a neutral-to-positive mid-cycle environment.
✴ Conclusion: There is no structural on-chain pressure. As long as inflows remain low, risk of capitulation or distribution is minimal.
⊢
▦ Spot Taker CVD - (Cumulative Volume Delta, 90-day) – (All Exchanges):
∴ The 90-day CVD shows continued dominance of taker buys over sells, reflecting ongoing demand strength in spot markets;
∴ However, the curve is flattening, suggesting buyers are meeting resistance or fading interest;
∴ No sharp reversal in the CVD curve is detected — only saturation.
✴ Conclusion: Demand remains dominant, but the pace is decelerating. Without renewed volume, this curve may revert or plateau.
⊢
▦ Exchange Inflow Mean - (MA7) – (All Exchanges):
∴ The 7-day moving average of exchange inflow continues to decline steadily;
∴ This metric often precedes calm phases or pre-breakout plateaus;
∴ Historical patterns show similar inflow behavior before prior volatility expansions.
✴ Conclusion: A period of silence is unfolding. Reduced mean inflow suggests price is awaiting external catalysts for movement.
⊢
▦ Funding Rates – (Binance):
∴ Current funding rates are neutral, with slight positive bias, suggesting balanced long-short sentiment;
∴ No extreme spikes indicate absence of excessive leverage;
∴ This equilibrium typically precedes significant directional moves.
✴ Conclusion: Market is leveled. Funding neutrality reflects hesitation and prepares ground for upcoming directional choice.
⊢
IV. ⚖️ Macro–Geopolitical Axis – (Powell, Middle East & BTC/XAU):
▦ MACRO CONTEXT:
∴ Jerome Powell is scheduled to speak on Wednesday (June 19), with markets anticipating remarks on rate stability or future hikes;
∴ Ongoing tensions in the Middle East (Israel–Iran) elevate risk-off behavior in traditional markets;
∴ Bitcoin has triggered a rare Golden Cross vs. Gold, as noted by U.Today, signaling digital strength over legacy value.
✴ Conclusion: Macro remains the primary external catalyst. Powell’s statement will determine short-term volatility. Until then, Bitcoin floats between its technical support and CME magnetism, with gold dynamics providing long-term bullish backdrop.
⊢
⚜️ 𝟙⟠ Magister Arcanvm – Vox Primordialis!
⚖️ Wisdom begins in silence. Precision unfolds in strategy.
⊢
GOLD- XAU-USD Hello Traders! The GOLD MARKET is on fire! 🚨🔥
XAUUSD has officially broken above the key resistance zone — this is not just a move, this could be the start of something BIG! 💥📈
Is this the golden breakout we’ve been waiting for, or just a short-lived spike?
Are we heading toward the next major target, or is a pullback on the horizon? 🎯🔍
Your insights matter — comment below with your analysis and let’s decode this golden move together!
Stay sharp, stay golden! ⚔️💰
#XAUUSD #GoldBreakout #ForexTraders #MarketMomentum #GoldAnalysis #TradeSmart
XAUUSD 16 June – Liquidity Trap or Smart Money Rotation? XAUUSD 16 June – Liquidity Trap or Smart Money Rotation?
Gold surprised many traders with a sharp spike during the Asian session, only to reverse aggressively hours later. While headlines screamed “war” and panic, the price behavior told a different story—one of strategic distribution and smart money rotation...
🌍 Macro & Fundamental Context
Geopolitical triggers: Rising tensions in the Middle East (Israel-Iran) and political assassinations triggered emotional buying across safe-haven assets like gold and oil.
Institutional rotation: Major funds appear to be offloading gold positions to rebalance into equities (in correction) and oil (strong upside potential).
Market narrative: News-induced FOMO drives retail into overbought zones, allowing larger players to exit at premium prices.
📈 Technical Overview (M30 Structure)
Price Action: Gold tapped into major resistance at 3456–3458, showing an aggressive rejection shortly after.
EMA Behavior: EMAs (13/34/89/200) are flattening across M15 and M30—early signs of a possible bearish crossover.
Volume Drop: Declining volume after the spike suggests buyer exhaustion, reinforcing the idea of a bull trap.
Fair Value Gap (FVG): A visible liquidity void remains below the 3390 area. Price often returns to fill these zones.
🎯 Trading Plan for Today
✅ Scenario A: Buy from Demand Zone (Liquidity Fill)
Entry: 3383 – 3385
Stop Loss: 3377
Targets: 3386 → 3390 → 3394 → 3398 → 3402 → 3406 → 3410+
📌 Best executed during London or NY session if price shows absorption or reversal confirmation.
❌ Scenario B: Sell from Resistance Only on Clear Rejection
Entry: 3456 – 3458
Stop Loss: 3462
Targets: 3452 → 3448 → 3444 → 3440 → 3435 → 3430
⚠️ Only enter shorts if clear bearish engulfing or pin-bar setup forms near resistance zone.
🧠 Market Psychology
Retail FOMO is being exploited by larger players to exit risk positions.
Liquidity engineering is likely in play—smart money drives price up on headlines, then exits into buyer momentum.
Equity & Oil rotation signals a shift in institutional preference short-term.
📌 Final Thoughts
This isn’t a time to chase breakouts. Gold is entering a volatile re-accumulation phase where news is being weaponized to induce emotional trading. The real edge lies in waiting for price to come to your level and only executing with confirmation.
🎯 Zone to Watch: 3383 – 3385
📉 Avoid chasing moves
📊 Respect your SL & manage risk like a pro
—
🧭 Stay patient. The next big move will reward those with discipline and timing.
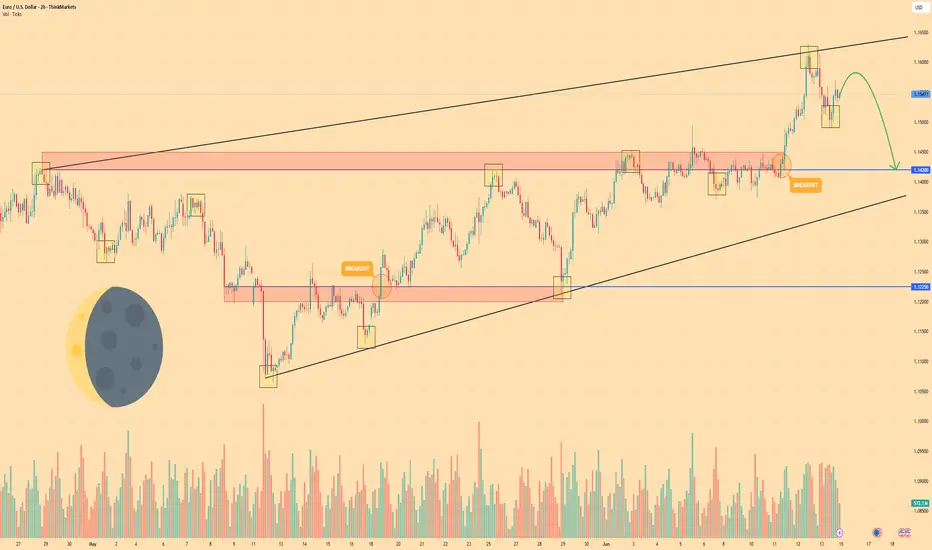
EURO - Pirce can make movement up and then drop to $1.1420Hi guys, this is my overview for EURUSD, feel free to check it and write your feedback in comments👊
After entering the wedge, Euro began to slow down, creating a tightening structure between support and resistance.
Price corrected toward the support line of the wedge, where it briefly paused and bounced with weak momentum.
The bounce triggered a breakout above local resistance, but buyers failed to hold the price at higher levels.
Soon after, the market reversed from the wedge’s upper boundary and began forming a bearish rejection pattern.
Now price trades just below the recent highs, showing fading demand and early signs of short-term reversal.
I expect Euro to move lower and reach the $1.1420 support level — my current target in this scenario.
If this post is useful to you, you can support me with like/boost and advice in comments❤️
Disclaimer: As part of ThinkMarkets’ Influencer Program, I am sponsored to share and publish their charts in my analysis.
$MANA Trading SignalKey Zones: Clear supply zone above and demand zone below the current price.
Fair Value Gaps (FVGs):
3 FVGs on the 4H timeframe below the current price.
2 FVGs on the 1H timeframe above the current price.
Trend & Indicators:
Market structure remains bullish.
OBV is forming a rising wedge, indicating potential momentum exhaustion.
Anchored volume profile shows high volume concentration below the current price, suggesting strong support.
Trade Plan:
Scalp Setup: Based on the smaller Fibonacci retracement tool, with a target at the previous swing high. Risk-to-reward (R:R) is approximately 1:1.
Swing Setup: Entry between the two 4H FVGs around 0.2874, targeting the psychological levels above. Stop loss set below the most recent swing low.

EURUSD 16 June – Technical Rebound or Liquidity Trap? EURUSD 16 June – Technical Rebound or Liquidity Trap?
The EURUSD pair has shown sharp movements after testing key resistance near 1.1607. While the price action may appear bullish at first glance, deeper analysis suggests we might be facing either a continuation of the uptrend or a strategic liquidity hunt.
🌍 Macro & Fundamental Overview
The ECB remains hawkish with rates still high, but recent commentary hints at a more dovish tone possibly leading to rate cuts in late Q3 2025.
Meanwhile, the Federal Reserve maintains its cautious stance, holding off on rate cuts due to sticky core inflation.
This divergence in policy expectations creates a neutral to slightly USD-favorable bias, depending on upcoming economic data.
⏳ Bottom line: EURUSD remains in a choppy environment with compression–expansion cycles, and no confirmed macro-driven trend yet.
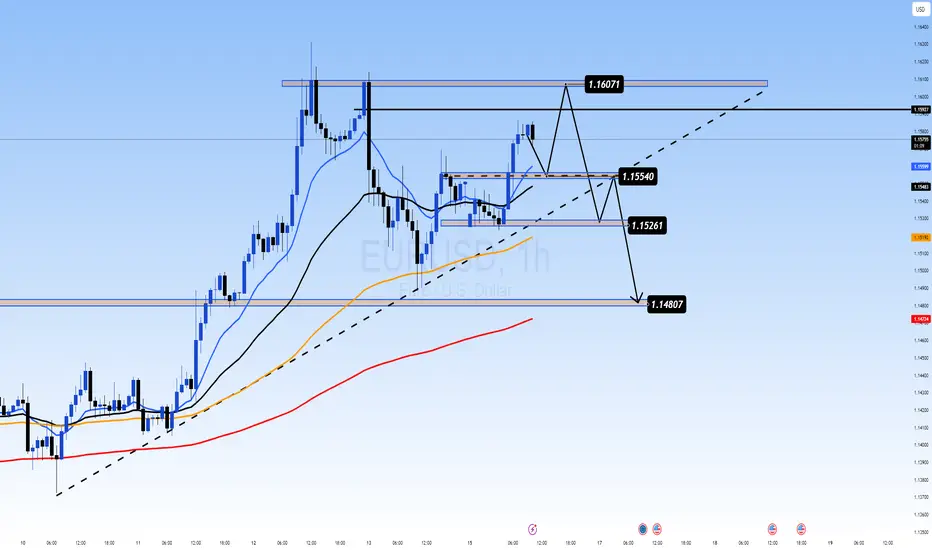
📉 Technical Outlook (H1 Chart)
Price Structure: The pair is moving within a short-term ascending channel, but current price is testing the upper boundary.
EMA Analysis (13/34/89/200): Still supports an uptrend, but flattening out — potential bearish crossover if price fails to hold.
Key Resistance:
1.1607: Major resistance and local top (double rejection zone).
Critical Support Zones:
1.15540: Minor structural support — a decisive level for intraday direction.
1.15261 & 1.14807: Unfilled FVG zones and liquidity pools that may get targeted if the price breaks lower.
🎯 Trade Setup Ideas
📘 Scenario A – BUY from 1.15540 support (bullish continuation)
Entry: 1.15540 (upon bullish candle confirmation or strong bounce)
Stop Loss: 1.15200
Take Profits: 1.15850 → 1.16070 → 1.16300+
✅ Ideal if European sentiment remains positive or if USD weakens across the board.
📕 Scenario B – SELL if price breaks and retests 1.15540
Entry: 1.15540 (after a breakdown + rejection retest)
Stop Loss: 1.15720
Take Profits: 1.15261 → 1.14807 → possibly 1.1450
✅ Best used if USD gains strength or EUR shows weakness after economic releases.
🧠 Market Psychology
The market is currently reactive to any shift in tone from ECB and Fed, causing price whipsaws near key zones.
Smart traders will avoid chasing breakouts and instead focus on reaction zones like 1.15540 for confirmation-based trades.
Watch for fakeouts, as institutional players may be hunting liquidity before choosing direction.
📌 Final Thoughts
EURUSD is in a sensitive zone, and 1.15540 is the intraday pivot. Holding above could trigger a push toward 1.1607 and higher. But failure to hold would likely attract sellers toward the 1.1480–1.1450 liquidity range.
🎯 Discipline is key. Avoid emotional entries. Let the market come to your level — and execute only with confirmation.
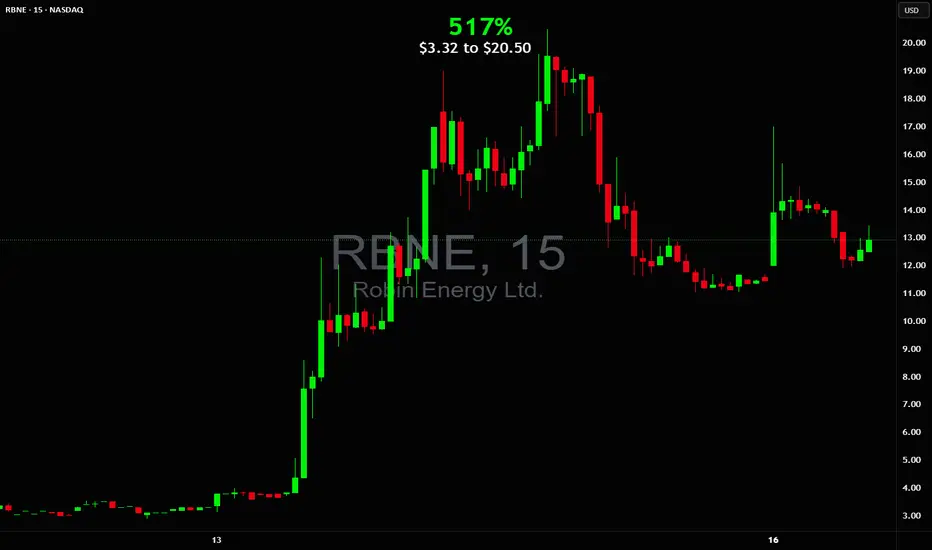
$3 to $20 in 1 day! 517% verticalPrice action was signaling $20 so I alerted a buy in teens and said if you don't mind swings give it a chance for $20. Soon after we got the $20 for an awesome win! NASDAQ:RBNE
EUR/CAD Long Bias🚀 EUR/CAD – Strong Long Opportunity Based on Multi-Factor Confluence
Over the past week, I conducted a comprehensive macro and sentiment-driven analysis across G10 FX pairs. Among several potential setups, EUR/CAD emerged as the most fundamentally and technically aligned long opportunity, supported by a confluence of high-probability signals across positioning, macro divergence, and capital flow sentiment.
🔍 Key Drivers Behind the EUR/CAD Long Bias:
1️⃣ Macroeconomic Divergence (ENDO View)
🇪🇺 Eurozone has shown relative stability in core macro indicators:
Inflation continues to cool, providing flexibility for ECB rate guidance.
GDP growth remains structurally flat but not contracting — suggesting resilience.
🇨🇦 Canada, on the other hand:
Shows a deteriorating inflation-growth mix.
Retail Sales and Industrial Production trends are softening.
ENDO analysis flags CAD as one of the weakest among G10 currencies.
2️⃣ Positioning – COT Report & Z-Scores
Speculative traders are increasing their long exposure to EUR (COT net longs rising +13,887 last week).
Z-Score on EUR long positions: +1.33 → statistically elevated interest in long EUR exposure.
CAD positioning is flat-to-negative, with no bullish buildup in speculative flows.
This gives EUR a clear relative edge in terms of speculative conviction.
3️⃣ Score & EXO Sentiment Framework
EUR/CAD is one of few pairs showing clear directional consensus across:
✅ EXO Score Sheet: Long Bias confirmed.
✅ RR_w Sheet: Strong risk/reward rating supports further upside.
✅ IR Forecast Sheet: ECB-CAD policy spread favors EUR strength in medium term.
4️⃣ Market Sentiment – Risk Regime
We are currently in a “Risk-On” sentiment regime, which generally favors currencies like EUR over defensive, commodity-linked currencies like CAD.
CAD tends to underperform in reflationary sentiment waves — especially when Oil fails to support the currency.
5️⃣ Cluster & Trend Confirmation
While not a primary factor, cluster analysis shows that EUR/CAD is not in a weak trend regime.
Trend alignment over 30 and 14 days remains favorable.
🔚 Conclusion:
EUR/CAD is one of the few pairs this week that aligns across all analytical fronts: macro, positioning, sentiment, and structure. In a crowded FX environment, such confluence is rare and valuable.

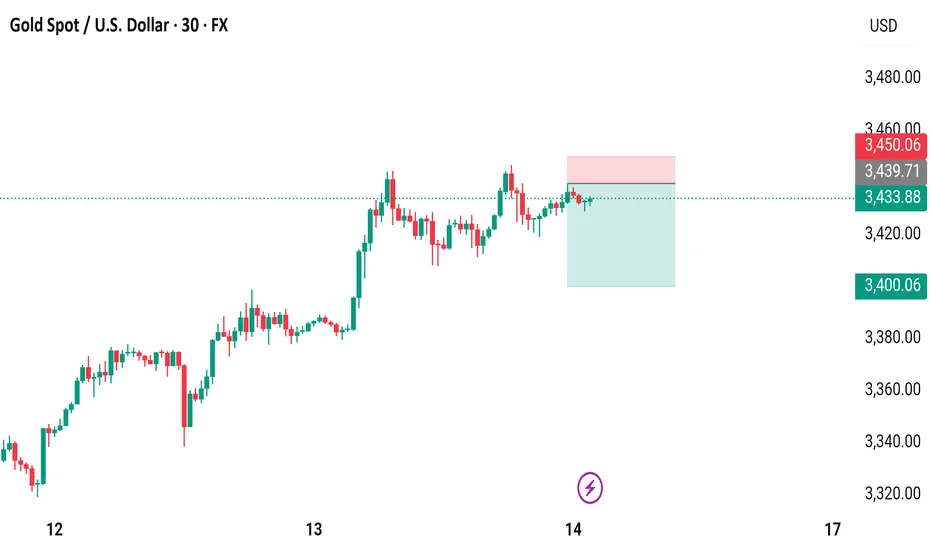
Gold Spot / U.S. Dollar (XAUUSD) - 30m ChartA 30-minute candlestick chart showing the price movement of Gold Spot against the U.S. Dollar (XAUUSD). The current price is $3,433.88, reflecting a +$48.32 (+1.43%) increase. The chart highlights a recent upward trend with a shaded resistance zone around $3,460.06 and a support level near $3,400.06, as of 10:52 AM PKT on June 15, 2025.
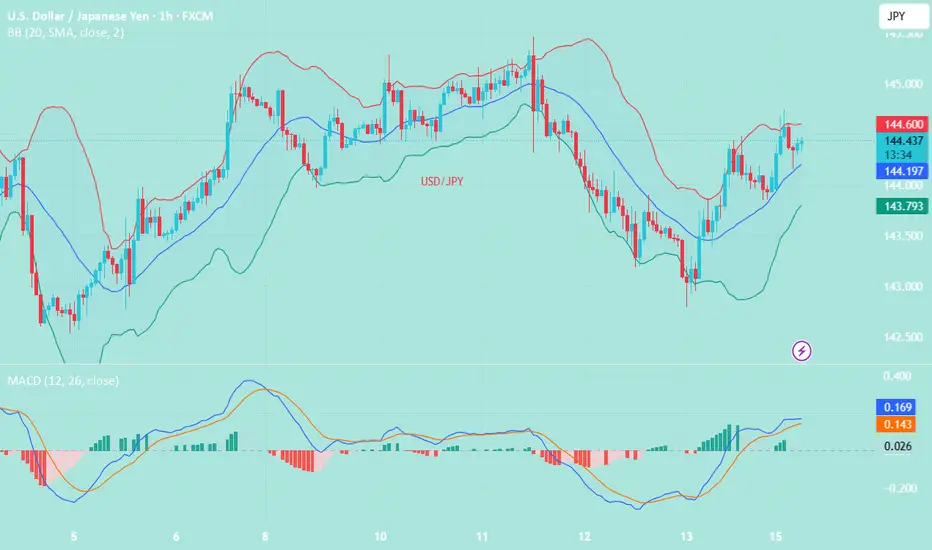
USD/JPY(20250616)Today's AnalysisMarket news:
Trump: The United States may still intervene in the Iran-Israel conflict. If Iran launches an attack on the United States, the United States will "fight back with all its strength on an unprecedented scale." Iran and Israel should reach an agreement.
Technical analysis:
Today's buying and selling boundaries:
143.79
Support and resistance levels:
145.47
144.84
144.43
143.15
142.74
142.12
Trading strategy:
If the price breaks through 144.43, consider buying in, the first target price is 144.84
If the price breaks through 143.79, consider selling in, the first target price is 143.15
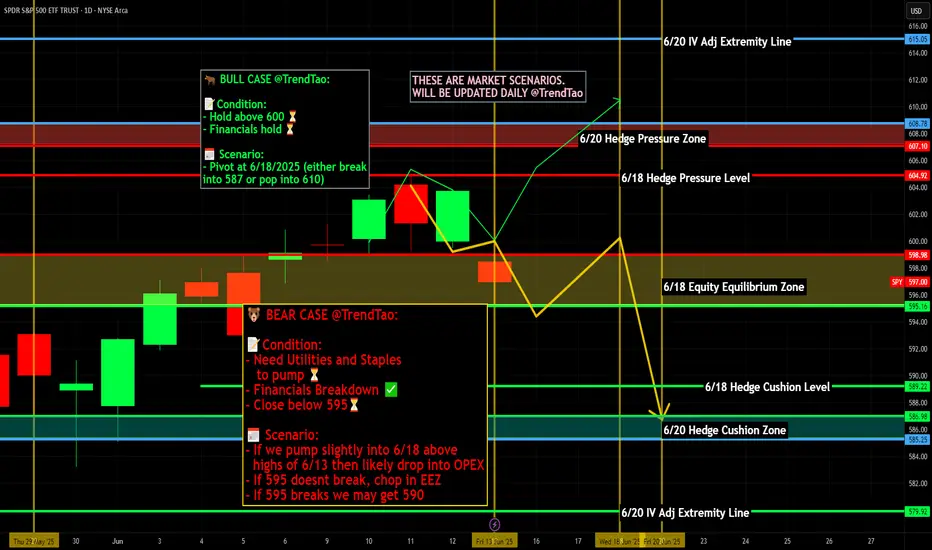
Weekly $SPY / $SPX Scenarios for June 16–20, 2025 🔮 Weekly AMEX:SPY / SP:SPX Scenarios for June 16–20, 2025 🔮
🌍 Market-Moving News 🌍
🏦 Fed Holds Rates, Powell Expresses Caution
The Federal Reserve is widely expected to keep rates at 4.25–4.50%, though Chair Powell likely won’t provide fresh guidance. Markets see limited upside without stronger inflation or growth cues
💱 Dollar Strengthens on Geopolitical Risk
The U.S. dollar rose slightly as investors flocked to safe assets amid global tensions with Iran. Treasury yields eased slightly on risk-off flows
🛢️ Oil Near Multi-Week Highs on Mideast & OPEC Dynamics
Oil held near seven-week highs (~$67–70/barrel), buoyed by Iran-Israel tensions and OPEC+ output hikes (411K bpd added from May–July), offset by demand concerns .
⚠️ G7 Summit Faces Heightened Stakes
G7 finance ministers meet in Canada under pressure from Middle East escalation. Watch for policy coordination and commentary on trade, inflation, and global economic risks .
📊 Key Data Releases & Events 📊
📅 Monday, June 16
Regular markets open after Juneteenth holiday
Quiet day; oil & geopolitical headlines dominate
📅 Tuesday, June 17
8:30 AM ET – Retail Sales (May): Signals consumer spending strength/duration
8:30 AM ET – CPI (May): Confirms inflation trend post-CPI cooler reading
10:00 AM ET – Housing Starts & Building Permits (May): Gauges housing market demand
Unexpected Tesla Robotaxi Demo (Austin): Watch for surprise developments this week
📅 Wednesday, June 18
Global Central Bank Day: FOMC, BoE, BoJ policy updates; U.S. Fed will most likely hold steady
📅 Thursday, June 19 – Juneteenth Holiday – U.S. markets closed
📅 Friday, June 20
8:30 AM ET – Existing Home Sales (May): Measures U.S. housing activity
10:00 AM ET – Leading Economic Indicators (May): Early snapshot of economic momentum
⚠️ Disclaimer:
This information is for educational and informational purposes only and should not be construed as financial advice. Always consult a licensed financial advisor before making investment decisions.
📌 #trading #stockmarket #economy #news #trendtao #charting #technicalanalysis
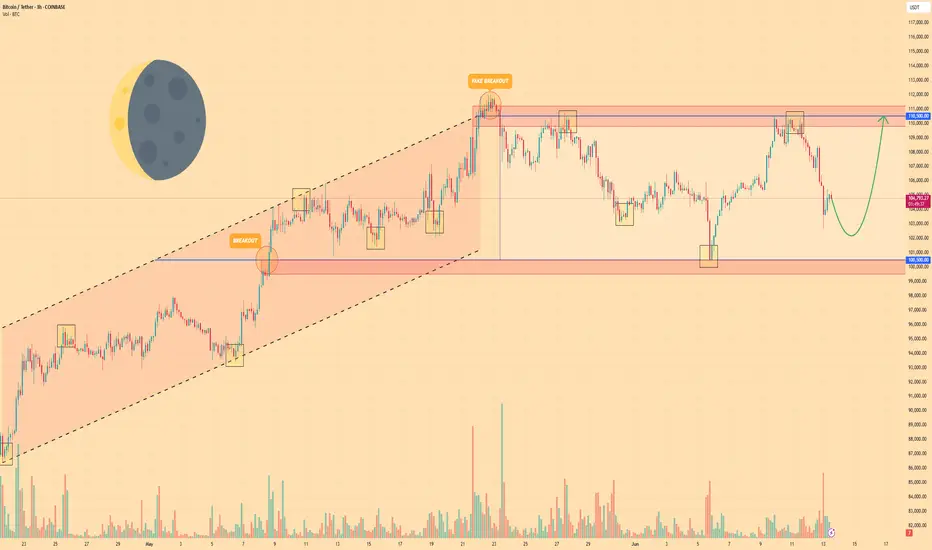
BITCOIN - Price can fall a little and start to move upHi guys, this is my overview for BTCUSDT, feel free to check it and write your feedback in comments👊
Price entered to rising channel, where at once bounced from support line and rose a little, and then corrected.
Next, price continued to move up and soon reached $100500 level, after which broke it and rose to resistance line.
After this movement, BTC corrected and continued to grow in rising channel and later reached $110500 level.
Bitcoin exited from rising channel, made a fake breakout of resistance level, and started to trades inside flat.
In flat, price tried to grow but failed and fell to support level and then grew back again, after which started to decline.
Now, I expect that BTC can repeat as move before, it falls a little and then grows to $110500 resistance level.
If this post is useful to you, you can support me with like/boost and advice in comments❤️
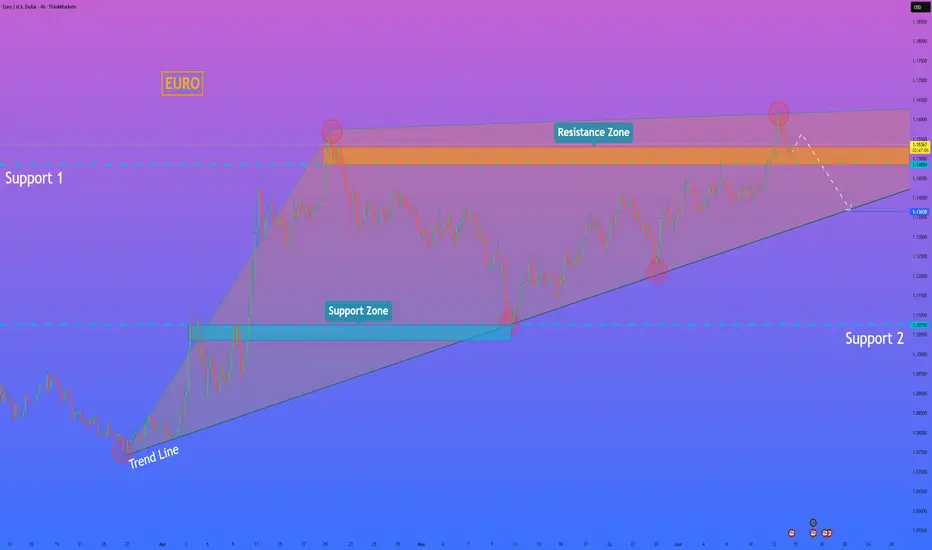
HelenP. I Euro may break suppot level and drop to trend lineHi folks today I'm prepared for you Euro analytics. Observing this chart, we can see how the price strongly declined and reached the trend line, where it found solid support and reversed. From that point, EUR began to grow, forming a clear upward pennant structure. This movement included a break above the local support level at 1.1485, indicating temporary bullish strength. However, despite this breakout, the price failed to secure a strong push through the resistance zone between 1.1485 and 1.1530, instead consolidating just below it. Now the chart shows clear signs of slowing upward momentum. The price remains inside the pennant, but current movement suggests potential weakness near the top boundary. Given the structure and previous reaction points, I expect EURUSD to break below the support level and move toward the trend line again. This would be a natural retest of the lower boundary of the pennant. That’s why I’ve set my target at 1.1365, a level that coincides perfectly with the trend line, offering a realistic area for price to react once more. If you like my analytics you may support me with your like/comment ❤️
Disclaimer: As part of ThinkMarkets’ Influencer Program, I am sponsored to share and publish their charts in my analysis.
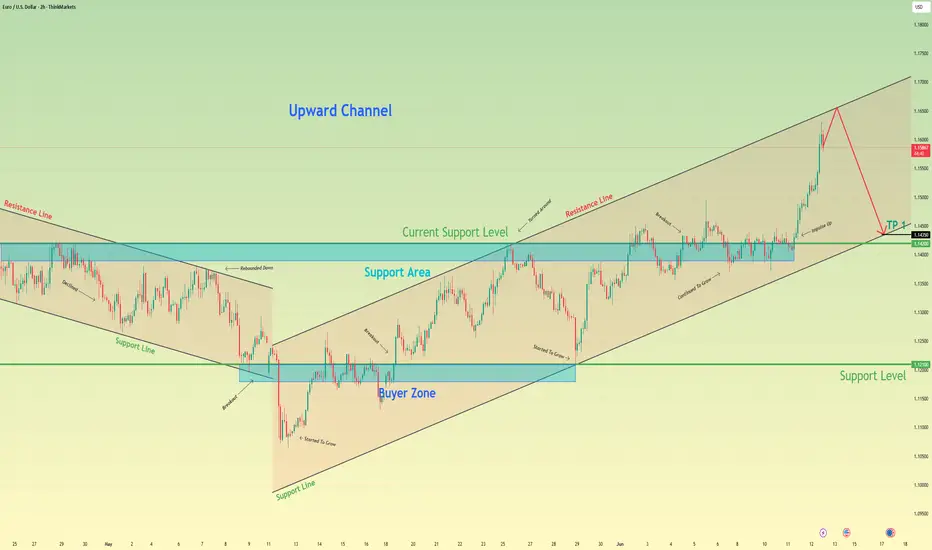
Euro can reach resistance line of channel and make correctionHello traders, I want share with you my opinion about Euro. Previously, price was trading inside a downward channel, gradually declining from the resistance line while forming a series of lower highs and lower lows. During that phase, sellers were clearly in control, and every attempt to grow was met with pressure near the channel’s upper boundary. However, that trend shifted once the price broke through the resistance line, confirming the end of the bearish momentum and the start of a new upward structure. After the breakout, EUR entered an upward channel, supported by multiple bullish impulses and consistent reactions near the support line. Price continued to rise, pushing through the support area and current support level around 1.1420. This upward movement showed strong bullish conviction, especially after the clean breakout and consolidation inside the channel body. Now the pair has approached the resistance line of the rising channel, where previous impulses typically slowed down or reversed. Given the channel geometry and past market behavior, I expect Euro to react to this upper boundary and move downward. For this reason, I set my TP at 1.1325, which aligns with the support line of the upward channel. Please share this idea with your friends and click Boost 🚀
Disclaimer: As part of ThinkMarkets’ Influencer Program, I am sponsored to share and publish their charts in my analysis.
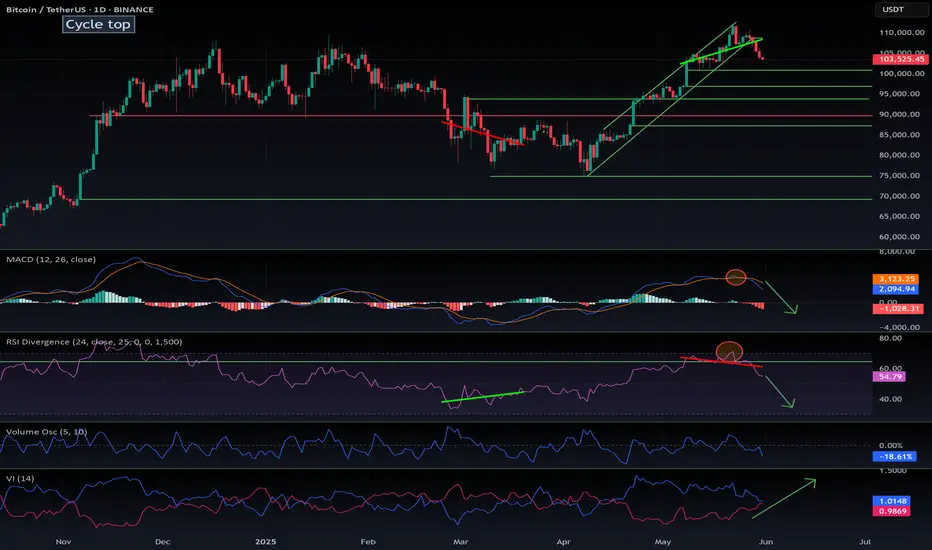
$BTC correction has just started. What is coming next?As I previously stated in my CRYPTOCAP:OTHERS , CRYPTOCAP:BTC.D , and CRYPTOCAP:TOTAL2 analysis — this move was expected. Check out my other ideas for more detailed breakdowns.
So, what’s happening?
Bitcoin maximalists have been buying heavily at the top, right when RSI and MACD were in overbought territory, creating a clear bearish divergence.
Something Saylor and others seem to ignore: you can't defy mathematics — what needs a correction will correct.
CRYPTOCAP:BTC still looks bullish on the weekly timeframe, so we’re not entering a bear market. However, the pump is over, key supports have broken, and altcoins are correcting — some by -25% in a single day.
Purely from a charting perspective, we can identify multiple potential support levels for CRYPTOCAP:BTC :
$101K, $94K, $89K, $87K, with a lower-probability retest down to $75K.
We’re likely entering a 2-week correction, after which CRYPTOCAP:BTC could resume its uptrend — potentially closing June at a new all-time high.
DYOR.
#Bitcoin #BTC #Altcoins #CryptoCrash #TechnicalAnalysis #BTCdominance #TOTAL2 #BearishDivergence #Saylor #RSI #MACD #ATH #DYOR