GBP/USD Breakout (28.05.2025)The GBP/USD Pair on the M30 timeframe presents a Potential Selling Opportunity due to a recent Formation of a Breakout Pattern. This suggests a shift in momentum towards the downside in the coming hours.
Possible Short Trade:
Entry: Consider Entering A Short Position around Trendline Of The Pattern.
Target Levels:
1st Support – 1.3424
2nd Support – 1.3380
🎁 Please hit the like button and
🎁 Leave a comment to support for My Post !
Your likes and comments are incredibly motivating and will encourage me to share more analysis with you.
Best Regards, KABHI_TA_TRADING
Thank you.
Disclosure: I am part of Trade Nation's Influencer program and receive a monthly fee for using their TradingView charts in my analysis.
Analysis

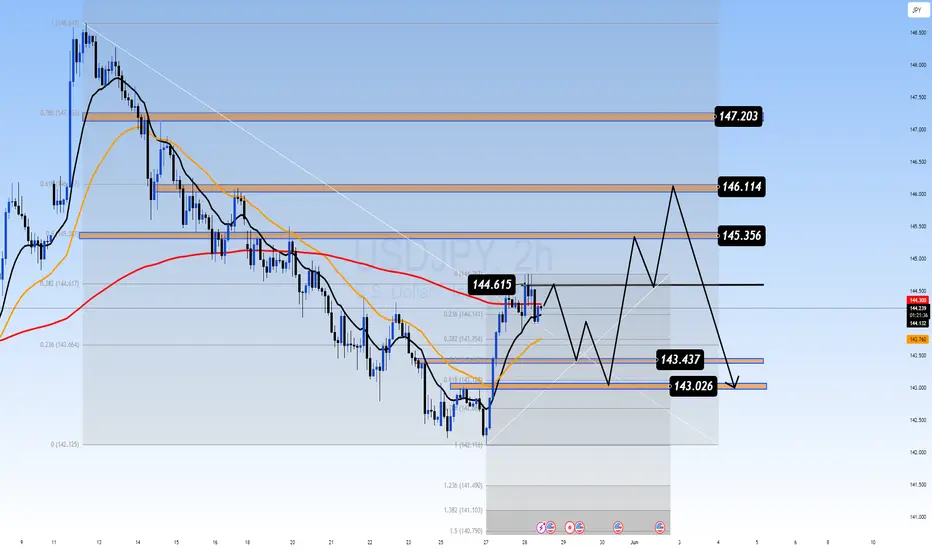
USDJPY PLAN – Will FOMC Be the Next Big Catalyst?USDJPY PLAN – Will FOMC Be the Next Big Catalyst?
💬 After several sessions of sideways movement, USDJPY is showing signs of a potential breakout, supported by both technical signals and macro fundamentals. As the FOMC meeting approaches, the market is poised for a major shift — making this the perfect time to prepare actionable trade plans.
🔍 TECHNICAL ANALYSIS
Primary Trend: Short-term bullish retracement within a broader downtrend – currently testing the 200 EMA on H2.
EMAs in use: EMA13 (black), EMA34 (orange), EMA89 (red) – effective dynamic support/resistance indicators.
Key Resistance Levels:
145.35: Major confluence zone with 0.618 Fibonacci and trendline resistance.
146.11 – 147.20: Previous highs and Fibonacci extension targets.
Key Support Zones:
144.61: EMA200 acting as immediate pressure point.
143.43 – 143.02: Crucial demand zone with strong reaction expected on pullback.
🌍 MACRO & FUNDAMENTAL FACTORS
FOMC Outlook: With recent CPI data softening and labor numbers moderating, markets anticipate a hold on rates. However, any hawkish tone from Chair Powell could trigger a sharp bullish move on USDJPY.
BOJ’s Dovish Stance: The Bank of Japan remains accommodative, showing no clear intent to hike rates. This weakens the Yen and supports mid-term upward momentum for USDJPY.
Interest Rate Differentials & Carry Trade Flows continue to drive volatility and directional bias in this pair.
🎯 TRADE SETUP SUGGESTION
If price breaks and sustains above 144.61 (EMA200): look to BUY on pullback toward 144.15–144.20, targeting 145.35 and 146.11.
If price gets rejected at 145.35: consider a short-term SELL toward 144.00 – 143.43 for a corrective leg.
⚠️ STRATEGY NOTE:
Avoid entering right at the time of the FOMC release. Wait for post-event confirmation. Prioritize strong breakouts or rejections, and manage risk carefully under volatile conditions.
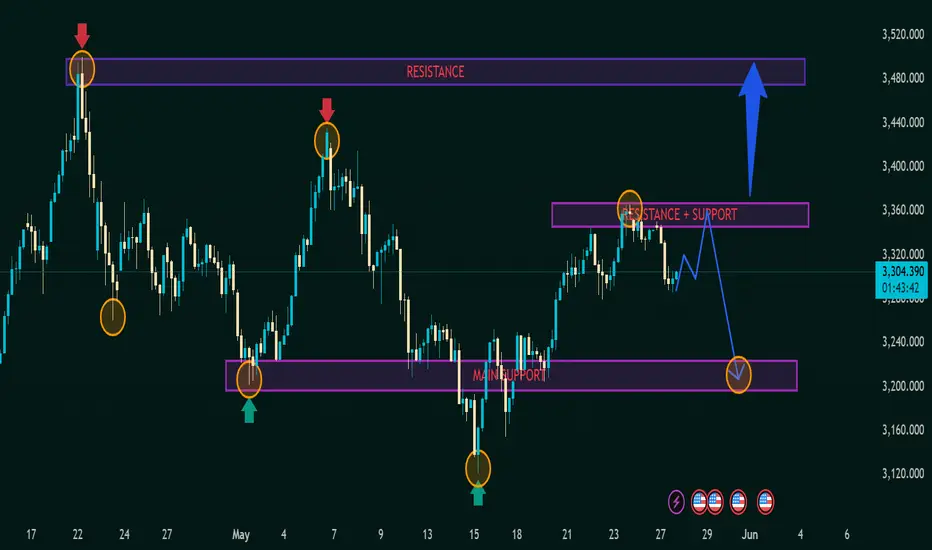
Technical Analysis: XAU/USD (Gold) Price Action📊 Technical Analysis: XAU/USD (Gold) Price Action
🕒 Timeframe: 4H (Based on candlestick structure)
📅 Published: May 27, 2025
💰 Current Price: 3,303.860
🔴 Major Resistance Zone
📍 3,480 – 3,500
📌 Seen with red arrows and price rejections.
📉 Strong selling pressure has occurred twice from this level (double top-like behavior).
❗ Until price breaks above this, bulls face a major hurdle.
🟣 Key Mid-Level Zone (S/R Flip)
📍 3,340 – 3,360
🔄 This area has flipped between support and resistance.
🔸 Price tested this level recently and pulled back (orange circle), suggesting sellers are active.
🔮 This is the pivot zone – watch for break/rejection to determine next trend leg.
🟪 Main Support Zone
📍 3,180 – 3,220
✅ Multiple bounce reactions visible (green arrows and circles).
💪 This zone has held strong; indicates solid buyer interest.
📉 If price returns here and breaks below, we could see further downside to 3,120 or lower.
🧭 Market Structure Summary
🔁 The market is in a range-bound structure between 3,220 – 3,360, with spikes towards 3,480.
🔃 The recent higher low followed by rejection at mid-resistance suggests potential distribution.
🧠 Forecast Scenarios
🔵 Bullish Scenario (Blue Path)
Break above 3,360 → Retest as support → 📈 Potential rally to 3,480
📍 Target: 3,480+
🟢 Confirmation: Strong bullish engulfing candle + volume surge
🔻 Bearish Scenario (Blue-Arrow + Orange Circle)
Rejection at current resistance → Drop toward 3,220
📍 Target: Main Support zone
❗ Watch for bearish candle pattern confirmation at 3,340
⚖️ Trading Strategy Tips
🔍 Wait for confirmation at the mid-resistance before entering.
🛡️ Place stops below support zones for long positions.
💥 Aggressive short sellers may look to enter near 3,340 with tight stops above.
🧩 Conclusion
The asset is in a critical decision zone. Whether it breaks higher toward the resistance or retraces to support will shape the next directional move. Traders should remain cautious, and let price action confirm bias before committing.
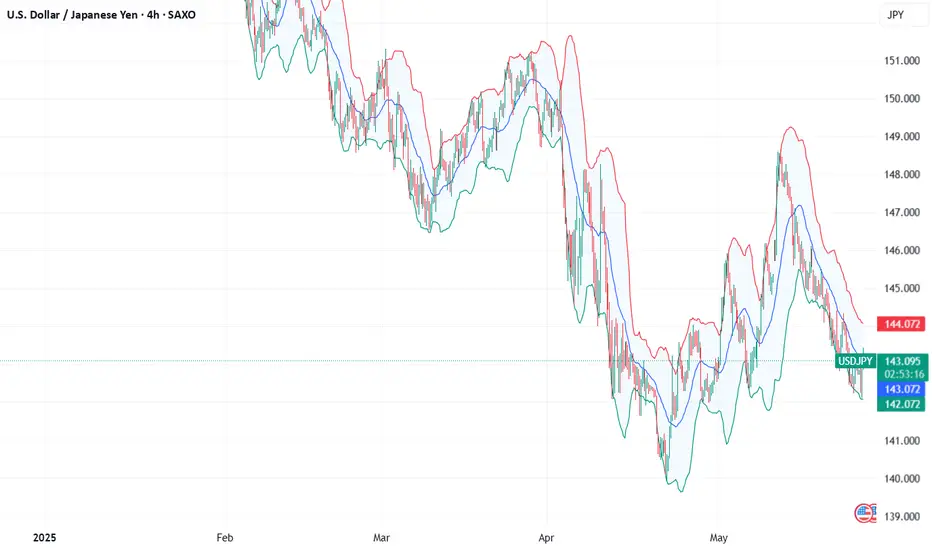
USD/JPY Poised for Upside: Momentum Building Toward Key TargetsBy examining the USD/JPY chart on the daily timeframe, we can see that the price is currently trading around 144. Given the momentum, I expect this pair to rise soon. The potential bullish targets are 145.5, 147.35, and 148.65 respectively.
Please support me with your likes and comments to motivate me to share more analysis with you and share your opinion about the possible trend of this chart with me !
Best Regards , Arman Shaban

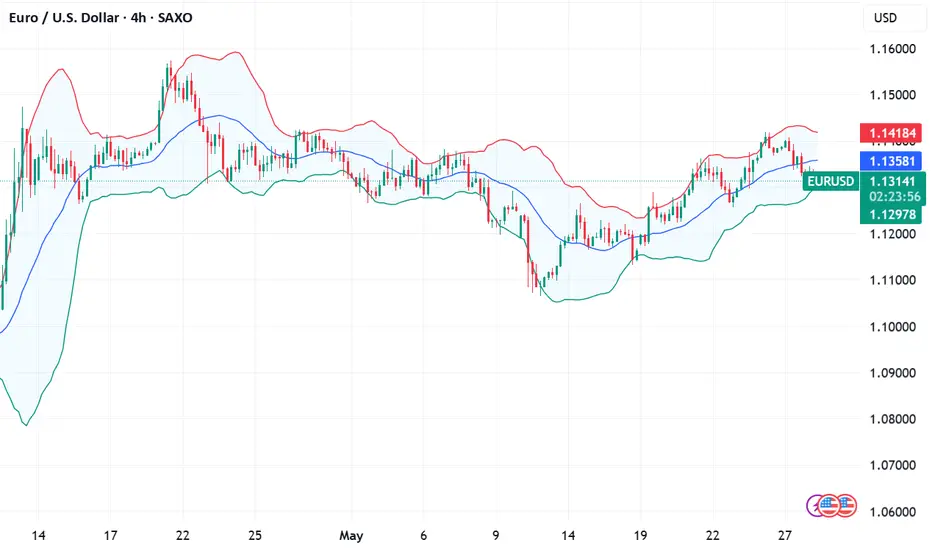
Fundamental Market Analysis for May 28, 2025 EURUSDThe EUR/USD pair retreated below 1.1400 for the second consecutive day, helped by a recovery in the US Dollar (USD) following the release of a positive consumer confidence report.
Risk appetite increased as market participants digested the news that US President Donald Trump said that trade talks between the United States (US) and the European Union (EU) have gained momentum following his threats to impose 50 percent tariffs last Friday. Although he backtracked on his words, allowing some room for negotiations, it remains to be seen if the two sides will reach an agreement before July 9.
The convincing US consumer confidence data for May released by the Conference Board (CB) put pressure on EUR/USD. The US Dollar Index (DXY), which tracks the value of the US currency against the other six currencies, rose more than 0.62% to 99.54.
The ECB's Gediminas Simkus said he sees scope for an “interest rate cut in June”. Robert Holzmann, a member of Austria's central bank and a member of the ECB, told the Financial Times (FT) that he sees no reason to cut rates at the June and July policy meetings.
Trade recommendation: SELL 1.1265, SL 1.1365, TP 1.1065
$EGLD Gearing Up for Next Leg – Bull Flag in PlayCRYPTOCAP:EGLD is forming a clean bull flag on the 6H chart after a strong move up.
Price is holding the trendline, and a breakout above $19.7 could target $27 that’s a 47% potential move.
This setup appears solid, incorporating confluence from Fib levels and volume zones.
Eyes on this breakout that could be explosive.
Flag breakout incoming?
DYOR, NFA.
#EGLDUSDT #Altseason2025

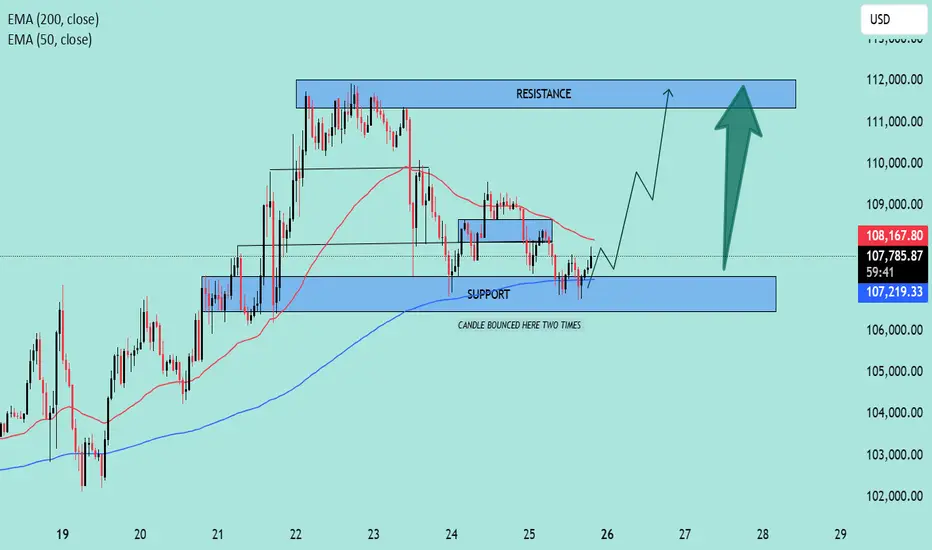
BTC/USD Rebound in Play! | Key Support Holding, Eyes on $112K📊 BTC/USD Technical Analysis
🗓️ Chart Date: May 25, 2025
🔍 Key Levels:
🔵 Support Zone: $106,800 – $107,300
Notably, price bounced twice in this region, indicating strong buying interest.
This area aligns closely with the 200 EMA (currently at $107,213.51), adding further confluence as dynamic support.
🔴 Resistance Zone: $111,800 – $112,300
Previous highs and consolidation make this a significant area where sellers may re-enter the market.
📈 Indicators:
🔵 EMA 200 (Blue): $107,213.51
Acts as a strong dynamic support; price bounced off it recently.
🔴 EMA 50 (Red): $108,182.91
Price is currently below the 50 EMA, suggesting short-term bearish pressure remains until this level is reclaimed.
🧠 Market Structure & Price Action:
After a sharp drop from the resistance zone, price found solid footing at the support zone.
Recent candles show rejection wicks from the downside, hinting at potential bullish reversal.
A breakout above minor consolidation and 50 EMA could trigger a bullish continuation toward the resistance.
📌 Forecast:
✅ If the price holds above the support zone and breaks above $108,200, we can expect a bullish move toward $112,000.
⚠️ However, a failure to break above the 50 EMA could lead to a retest of the support zone.
🧭 Trade Idea (Not Financial Advice):
📥 Long Bias:
Entry: On confirmed breakout above $108,200
SL: Below $107,000
TP: $111,800 – $112,300
📌 Conclusion:
The chart setup suggests a potential bullish reversal 📈 from a key support zone, supported by EMA 200. Watch for a break above the 50 EMA for momentum confirmation.
🧠 Always confirm with volume and wait for confirmation before entering a position.
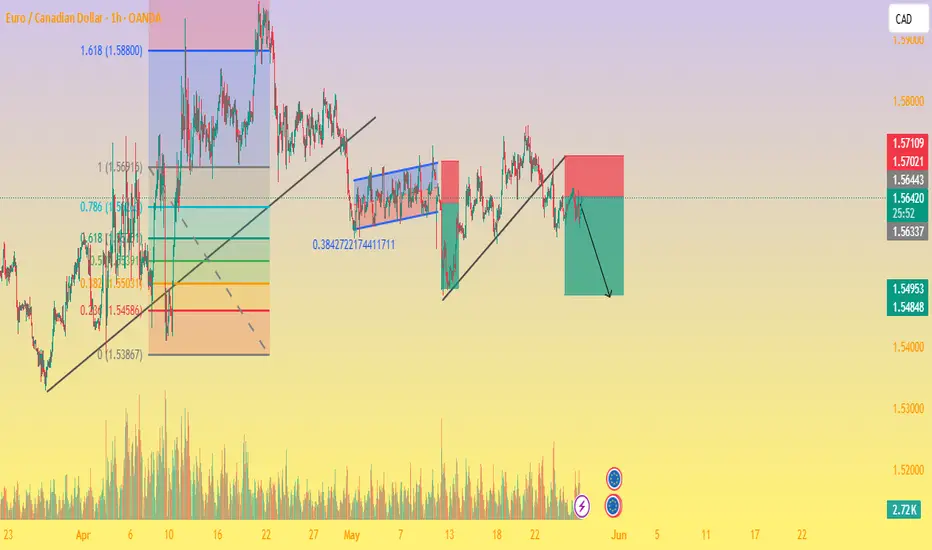
EUR/CAD Bearish Flag Breakdown Toward Fibonacci SuppAnalysis
1. **Trend Breakdown:**
* The chart shows a clear **bearish structure** developing after a strong rally to the 1.58800 area (Fibonacci 1.618 extension level).
* Two upward trendlines were broken successively, confirming bearish momentum.
2. **Fibonacci Levels:**
* The retracement from 1.58800 down to the 0.382 level (1.54586) has held significant importance.
* Price action is respecting the **Fibonacci retracement zones**, with rejection near the 0.786 and 1.0 levels (1.56915 - 1.57109).
3. **Bearish Flag Pattern:**
* A small **bearish flag/pennant** formed after a strong drop, which has now broken downward.
* This confirms the **continuation of the bearish move**.
4. **Volume Confirmation:**
* Volume spikes during the initial sell-off and again on recent bearish candles suggest **strong selling interest**.
5. **Trade Setup (Marked on Chart):**
* **Entry:** Near 1.56443
* **Stop-Loss:** Around 1.57109 (just above recent highs)
* **Target:** Around 1.54848–1.54500 zone, aligning with prior demand and 0.382 Fib level
---
**Conclusion:**
The chart signals a high-probability **short setup**, backed by a break of structure, Fibonacci confluence, bearish flag breakdown, and volume. A continued decline toward the 1.54500–1.54800 region is likely, provided the price stays below 1.57100.
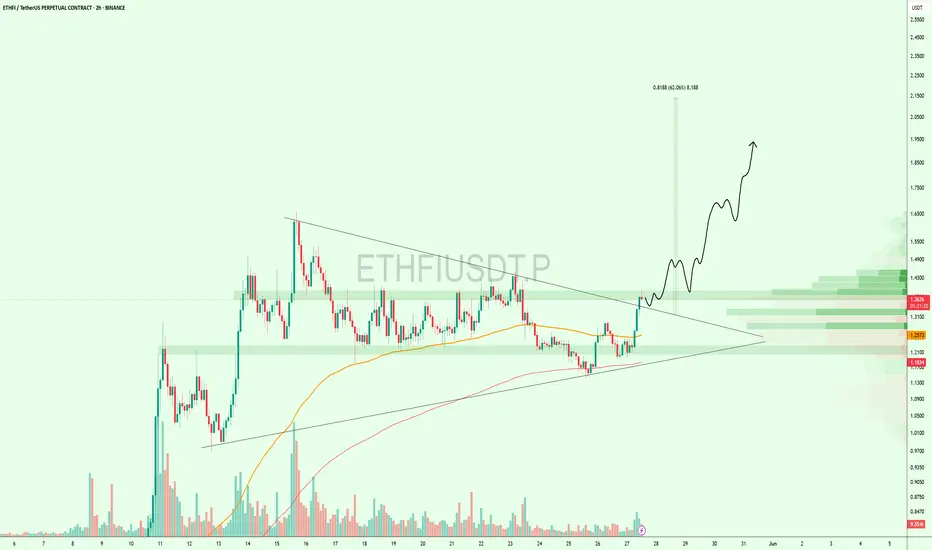
Symmetrical Triangle Breaks – $ETHFI Targets $2+CRYPTOCAP:ETHFI just broke out of a strong symmetrical triangle on the 2H chart finally escaping a long consolidation phase.
Price surged above resistance and reclaimed key EMAs, showing clear bullish momentum. If this breakout sustains, the next leg could take us toward $2.00+
Risk is tight below $1.27 the breakout zone and previous resistance-turned-support.
This move could be the start of something big.
Watch closely!
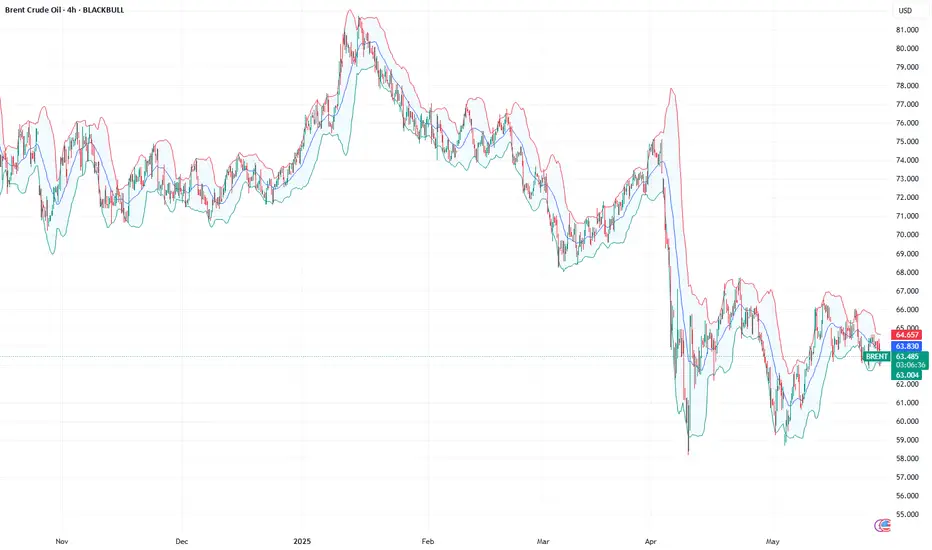
Dive into the oil storm of 2025!In 2025, oil prices declined due to rising output from OPEC+ countries, growing inventories in the U.S., weakening global demand, a stronger dollar, and ongoing trade tensions between major economies. Further pressure came from OPEC+’s plan to boost production by 411,000 barrels per day — three times more than previously scheduled. A final decision is expected at the May 31 meeting. This move aims to strengthen the Alliance’s market position, particularly against U.S. shale producers, but it has deepened the supply-demand imbalance, pushing prices to their lowest levels in four years .
Despite current challenges, several factors could support a recovery in oil prices :
1. Rising demand in emerging markets : Developing economies are expected to continue increasing energy consumption as they grow, boosting oil demand.
2. Limited investment in production : Lower investment in exploration and drilling — especially in a low-price environment — may lead to tighter future supply, which can support prices.
3. Geopolitical risks : Conflicts and instability in oil-producing regions can disrupt supply chains, traditionally driving prices higher.
4. Slower non-OPEC+ output growth : While non-OPEC+ production is expected to rise in 2025, the U.S. Energy Information Administration forecasts slower growth in 2026, easing pressure on prices.
5. Possible OPEC+ output cuts : If the current production increase fails to deliver the desired results, OPEC+ may reverse course and reduce output to stabilize the market.
In 2025, the oil market is under strain due to surging OPEC+ output, inventory surpluses, weak global demand, and economic uncertainty. Yet, despite prices plunging to four-year lows, there’s still room for recovery. Future price trends will hinge on OPEC+ decisions, emerging market demand, geopolitical events, and investment patterns in the energy sector. The upcoming OPEC+ meeting could be a turning point for the entire market.
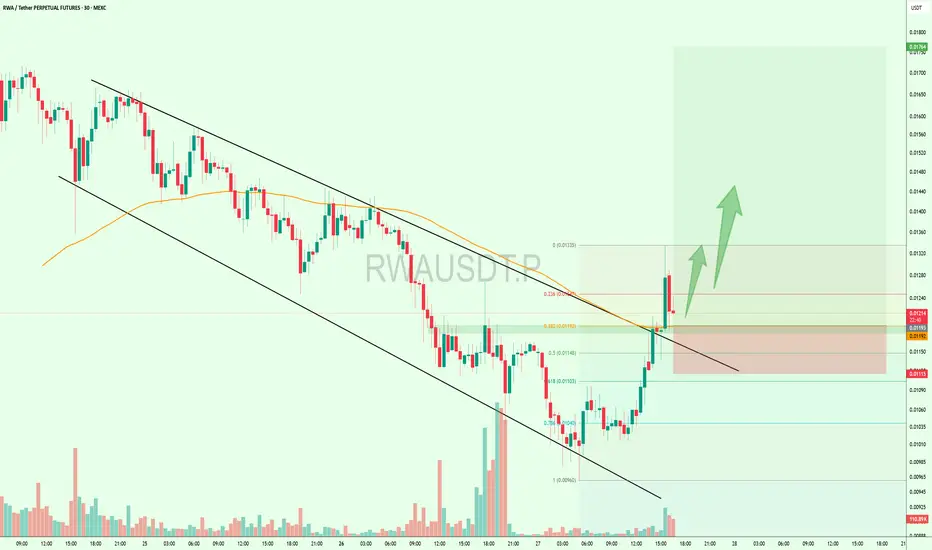
$RWA Breakout Alert – Trend Reversal in Play?LSE:RWA just broke out of a falling channel with strong volume — signaling a potential trend reversal.
It’s now retesting the breakout zone near the 0.382–0.5 Fib level, which could act as a support area before the next leg up.
If this reclaim holds, upside targets extend toward $0.017+—a 40%+ move from here.
Keep it on your radar.
DYOR, NFA.
DXY OUTLOOK BEFORE FOMC | Will the Dollar Break Trend DXY OUTLOOK BEFORE FOMC | Will the Dollar Break Trend or Just Retrace?
The US Dollar Index (DXY) has rebounded after weeks of relentless selling pressure, but this bounce is now approaching key decision zones just ahead of two critical events: the April PCE report and the next FOMC meeting. With macro data and sentiment diverging, traders should closely monitor how the dollar reacts to upcoming catalysts.
🌍 MACRO & FUNDAMENTAL CONTEXT
Core PCE Price Index (Apr) – due Friday – is the Fed’s preferred inflation gauge. A higher-than-expected print may reinforce the “higher for longer” stance on rates.
FOMC Minutes revealed a growing divide within the committee: some members remain open to further tightening if inflation stalls.
Bond market stress is emerging again, as 10Y yields hover near 4.5%. Fiscal concerns and treasury auctions are weighing on investor sentiment.
Political noise – particularly from former President Trump’s shifting tariff threats – adds short-term volatility to USD expectations.
🧠 Bottom line: While the dollar has regained ground, macro risks remain asymmetric. A hot PCE may spark short-term demand for USD, but structural credibility risks are still on the table.
📊 TECHNICAL INSIGHT – H1 STRUCTURE
Price Channel: DXY broke slightly above a well-respected descending channel that started mid-May.
EMA Confluence: EMA 13, 34, and 89 are beginning to align upward but haven’t fully confirmed a bullish trend yet.
Key Retest Zone: 99.08 is a critical zone — a Fibonacci 38.2% level of the recent breakout. A hold here may support another test higher.
🔑 KEY TECHNICAL LEVELS
Immediate Support: 99.08 (Fib 38.2% + channel retest)
Mid Resistance: 100.02 (round number + previous structure high + near 200 EMA)
Major Target Zone: 100.48 (Fib 61.8% + multi-day pivot)
📈 POTENTIAL PRICE SCENARIOS
If DXY respects 99.08, a continuation toward 100.02 and even 100.48 is plausible as a technical correction.
If DXY fails to hold 99.08, the breakout above the trend channel may turn into a false break, opening the door for a re-test of lower channel support near 98.30.
Watch for price behavior around 100.02 — aggressive sellers may re-enter at this level, especially if macro data disappoints.
⚠️ STRATEGIC REMINDER
Avoid chasing mid-range price action.
Let the market reveal its hand post-PCE.
Volatility is expected to spike — be patient and let key levels define directional conviction.

Double Top Alert: Key Resistance at 1.3570 Before US PCE DataGBPUSD PLAN – MAY 27 | Double Top Alert: Key Resistance at 1.3570 Before US PCE Data
GBPUSD is currently testing a critical resistance zone near 1.3570, forming a potential Double Top pattern. As markets await this week’s US Core PCE inflation release, the pair may be at risk of a short-term pullback.
🌍 MACRO FUNDAMENTALS
USD Rebounds Slightly ahead of April’s PCE inflation report – a key Fed inflation gauge due this Friday.
GBP Under Pressure as dovish tones from Bank of England (BoE) officials signal a potential pause in rate hikes.
UK Political Uncertainty and sluggish EU-UK trade talks continue to dampen investor confidence in the pound.
📊 TECHNICAL ANALYSIS
Price Structure: GBPUSD surged from 1.3446 support but is now facing resistance near 1.3570, where a Double Top formation is emerging.
Key Levels:
Resistance: 1.3570 – 1.3580 (previous high and psychological barrier)
Support 1: 1.3496 (confluence of EMA89 and 38.2% Fibonacci retracement)
Support 2: 1.3446
Indicators:
EMA13, EMA34 show early signs of bearish crossover on the 30-minute chart.
RSI approaches overbought territory, hinting at potential bearish divergence.
🎯 TRADE SETUP (IF PRICE REJECTS 1.3570)
🔻 SELL SETUP
Entry: 1.3570 – 1.3550
Stop-Loss: 1.3595
Take-Profit Targets:
TP1: 1.3496
TP2: 1.3446
📌 A bullish breakout only becomes valid if price closes strongly above 1.3590 on the H1 chart.
🧠 STRATEGIC NOTES
Wait for a clear reaction or bearish confirmation near 1.3570 before entering trades.
Avoid chasing trades mid-range; focus on clean breakouts or rejections.
PCE data may trigger volatility — manage risk tightly and prepare for directional momentum.
👉 What do you think of this Double Top scenario? Will GBPUSD reject or break through resistance? Drop your analysis below and follow for daily structured plans!

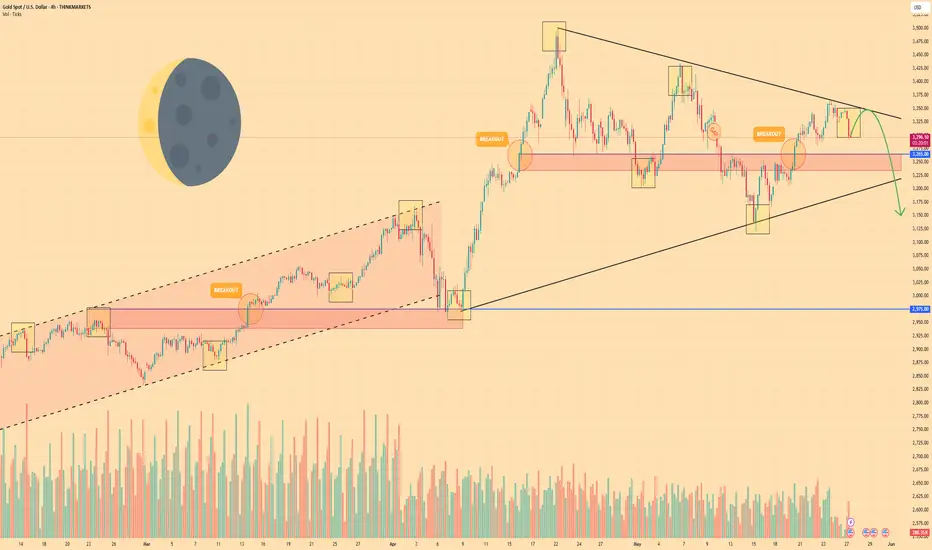
GOLD - Price can continue to fall and exit from triangle patternHi guys, this is my overview for GOLD, feel free to check it and write your feedback in comments👊
Some days ago, price entered to rising channel, where it turned around and made a correction to the support line.
Then it continued to grow and rose to the $2975 level, which continued with a support area, and continued to grow.
Later price rose to the resistance line, but then made a correction movement, thereby exiting the channel.
Next, Gold turned around and started to trade inside the triangle, where it at once made an upward impulse.
Price broke $3265 level, rose to resistance line, after which in a short time declined to this level.
But recently it has come back, so I expect that Gold can continue to fall to $3150, breaking the support level.
If this post is useful to you, you can support me with like/boost and advice in comments❤️
Disclaimer: As part of ThinkMarkets’ Influencer Program, I am sponsored to share and publish their charts in my analysis.
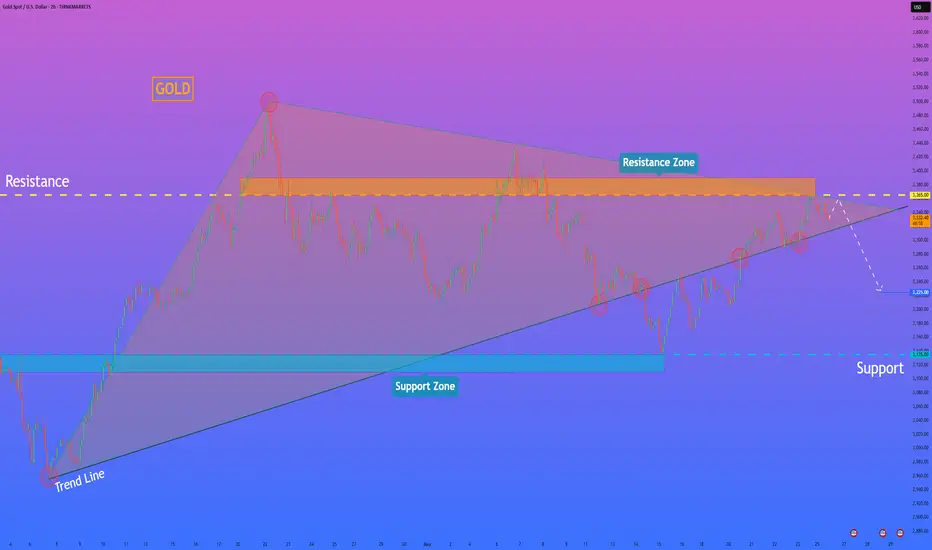
HelenP. I Gold may break trend line and continue to fallHi folks today I'm prepared for you Gold analytics. The trend line on this chart has consistently acted as a dynamic support for price, with multiple clean rebounds confirming its strength. As the price continued respecting this diagonal line, the structure gradually began tightening, forming a large symmetrical triangle. This pattern suggests a buildup of pressure between buyers and sellers. Once inside the triangle, the price action turned more volatile, with higher lows pushing against a strong resistance zone around the 3365 - 3390 range. Despite multiple attempts to break through, the market failed to sustain any move above this level. Each rally was met with rejection, and bearish momentum slowly started to emerge. Recently, the price reached the upper boundary of the triangle and touched the resistance zone again, but it quickly pulled back without breaking out. Currently, Gold is trading close to the intersection of the resistance zone and the trend line, where a decisive move is likely to occur. Given the weakening bullish momentum and the triangle’s narrowing formation, I expect the price to exit the pattern to the downside. A break of the trend line may trigger stronger selling, leading to a move toward the 3225 level - my current goal based on this potential bearish breakout. If you like my analytics you may support me with your like/comment ❤️
Disclaimer: As part of ThinkMarkets’ Influencer Program, I am sponsored to share and publish their charts in my analysis.
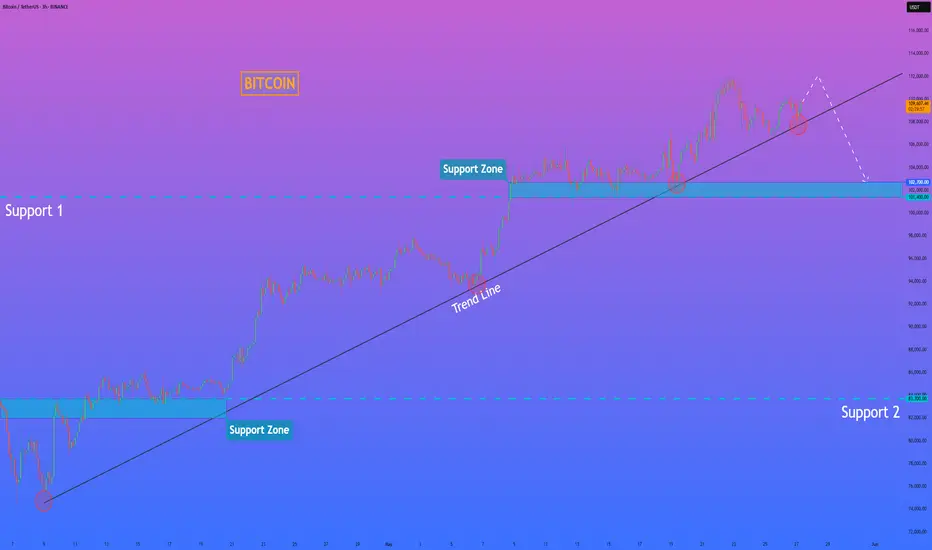
HelenP. I Bitcoin will start to decline and break trend lineHi folks today I'm prepared for you Bitcoin analytics. Observing this chart, we can see how the price dropped from support 2, which coincided with the support zone and reached the trned line. Then it turned around and started to grow, and soon reached the 83700 support level again and even broke it. Next, price some time traded near this level and after a retest, it turned around and made an impulse up, after which it turned around and then declined to the trend line, after which it rose to support 1, which coincided with one more support zone. Soon, BTC broke the 101400 level and then repeated movement when it traded near the support 2 level. Price, after trading near the 101400 level, rebounded from the trend line and rose to new ARH 112000 points and then went into correction. At the moment, I expect that BTCUSDT will start to decline, break the trend line, and continue to fall to the support zone. That's why I set my goal near this area, at the 102700 points. If you like my analytics you may support me with your like/comment ❤️
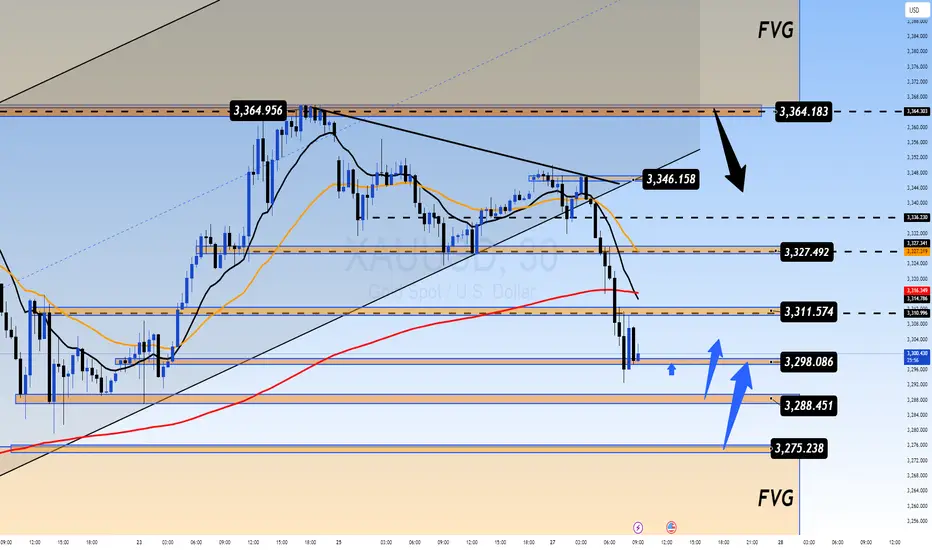
SELLERS TAKE CONTROL – BUYERS WAITING BELOW 3300? XAUUSD TRADING PLAN – 27/05 | SELLERS TAKE CONTROL – BUYERS WAITING BELOW 3300?
Gold has sharply reversed after failing to break through the key 3364 – 3366 resistance zone. Price action now suggests a corrective structure is in play, potentially setting the stage for further downside before NFP week.
🌍 MACRO & FUNDAMENTAL CONTEXT
The Federal Reserve maintains a hawkish stance with U.S. 10-year yields holding above 4.5%, placing short-term pressure on safe-haven assets like gold.
U.S.–EU Trade Tensions have temporarily eased after Trump postponed 50% tariffs on EU goods until July 9. However, this pause may be short-lived, keeping geopolitical risk priced into gold.
Key data this week will influence market sentiment:
• U.S. Core PCE (April) – critical for inflation outlook
• EU HICP (May) – will shape ECB rate cut expectations for June
Gold remains caught between macro-driven demand and technical exhaustion — creating opportunities for range-based trading.
📉 TECHNICAL OUTLOOK (H1/H4)
Price broke below the rising trendline and is now trading under the EMA 13, 34, and 89, confirming a bearish shift in short-term momentum.
The 3284 – 3286 region aligns with a previous Fair Value Gap (FVG), EMA200 (H4), and structural support — a strong potential buy zone.
If this level fails, deeper pullback toward the 3247 – 3250 region (major FVG zone) becomes likely.
🔑 TRADE SETUP ZONES
🟢 PRIMARY BUY ZONE:
Entry: 3286 – 3284
Stop-Loss: 3280
Take-Profit: 3290 → 3294 → 3298 → 3302 → 3310 → 3320
🟢 BUY SCALP:
Entry: 3298 – 3296
Stop-Loss: 3292
Take-Profit: 3302 → 3306 → 3310 → 3314 → 3320 → 3330
🔴 SELL SCALP:
Entry: 3346 – 3348
Stop-Loss: 3350
Take-Profit: 3342 → 3338 → 3334 → 3330 → 3320 → 3310
🔴 STRONG SELL ZONE:
Entry: 3364 – 3366
Stop-Loss: 3370
Take-Profit: 3360 → 3356 → 3352 → 3348 → 3344 → 3340 → 3330
⚠️ STRATEGIC INSIGHTS
Selling on retracements below 3348 is favorable unless a strong breakout above 3366 occurs.
Buying is only valid near 3284 with confirmation of bullish structure (EMA support bounce or bullish engulfing pattern).
Avoid trading the mid-range between 3310–3330 unless a clear reversal setup forms — price action here remains noisy and indecisive.
AMD: Short and Long Position IdeasThe current market structure indicates a potential bullish reversal within a broader descending channel. Following a previous decline of approximately 12.76% (−14.11 points), the price has staged a notable recovery, rallying 17.53% (+16.96 points) from a key horizontal support zone near 93.61. This area has historically acted as a demand zone, validating its significance with multiple touchpoints and a recent strong reaction.
Currently, the price action is approaching a critical resistance zone near 115.81, which also aligns closely with the upper boundary of the downward sloping blue channel. A sustained breakout above this resistance would constitute a technical breakout from the bearish structure and could signal a shift toward a medium-term bullish trend. In such a scenario, the next target would be the horizontal resistance zone around 120–122, supported by previous highs and structural confluence.
From a trade setup perspective, a long position could be considered on confirmation of a breakout and close above 115.81, with a target range of 120–122. A more conservative entry may be planned on a retest of the breakout level (115.81) as new support. Stop-loss levels could be strategically placed below the most recent higher low or the green support band near 105 to maintain a favourable risk-reward ratio. Conversely, failure to break above the resistance could trigger a reversion back to the mid-channel zone or retest of the 93.61 support level, favoring a range-bound or mean-reversion strategy in the short term.
Overall, the chart suggests a tactical bullish bias, contingent on breakout confirmation and broader market momentum.

Fundamental Market Analysis for May 27, 2025 USDJPYThe Japanese yen (JPY) is attracting fresh buyers in Tuesday's Asian session following the release of strong inflation data. Additionally, comments from Bank of Japan Governor Kazuo Ueda left the door open for further policy tightening by the central bank. This is in sharp contrast to expectations that the Federal Reserve (Fed) will continue to cut interest rates this year, and is proving to be a key factor that is providing a nice lift for the yen.
In addition, persistent geopolitical risks related to the protracted war between Russia and Ukraine and conflicts in the Middle East are contributing to the yen's safe haven status. The US dollar (USD), on the other hand, remains near its lowest level since April 22 amid concerns over the deteriorating US fiscal situation. This contributes to the USD/JPY pair's fall to 142.000, or more than a one-month low, and supports the prospects for further losses.
Trading recommendation: SELL 143.300, SL 143.900, TP 142.000
xau live trade and educational breakdown Gold hold on to higher ground above $3,330
Despite last week's significant climb, Gold has begun the week on the back foot, with gains restricted around $3,350 per troy ounce. The recent surge in market mood makes it difficult for XAU/USD to regain momentum. Monday is Memorial Day, thus financial markets in the United States will be closed.

$PENGU Approaching Apex – Breakout Watch On!CSECY:PENGU is forming a symmetrical triangle on the 4H chart, and price is getting close to the apex.
It’s currently holding above the support trendline and the 200 EMA a key zone to watch.
A breakout above the triangle could push the price toward the $0.022–$0.023 range.
I’m watching closely. If it breaks out with strong volume, it could be a solid setup.
Use a tight stop-loss and manage your risk properly.

USDJPY – Diverging Policies Drive Yen into Pressure Zone near 14USDJPY – Diverging Policies Drive Yen into Pressure Zone near 144
🌍 Macro Landscape: JPY Stuck Between Two Diverging Forces
In recent weeks, the US dollar has regained strength as the Federal Reserve remains committed to its "higher-for-longer" interest rate stance. On the flip side, the Bank of Japan (BoJ) is maintaining an ultra-loose monetary policy, widening the yield spread between the USD and JPY, and putting pressure on the yen.
The surge in US 10-year yields toward 4.5% is further dampening demand for JPY as a safe haven, prompting institutional capital outflows from the yen and inflows into USD-based assets.
🏦 Central Bank Policy Divergence: Fed Remains Firm, BoJ Stays Dovish
Federal Reserve: FOMC members continue to signal patience on rate cuts. Recent inflation data (PCE, CPI) shows sticky price pressure, especially in services.
Bank of Japan: BoJ remains hesitant to normalize policy despite inflation consistently above the 2% target.
This policy divergence is reminiscent of the conditions that pushed USDJPY above 151 last year — and current dynamics hint that history may repeat.
🌐 Capital Flows: JPY Loses Safe-Haven Appeal
Global capital flow models indicate a major shift. While gold and the US dollar are once again sought-after hedges amid US-China tensions and EU fiscal risk, the Japanese yen is being overlooked.
Japan’s debt-to-GDP ratio — the highest in the G7 — forces BoJ to maintain low rates to keep the fiscal structure sustainable. As a result, JPY is no longer viewed as a reliable store of safety.
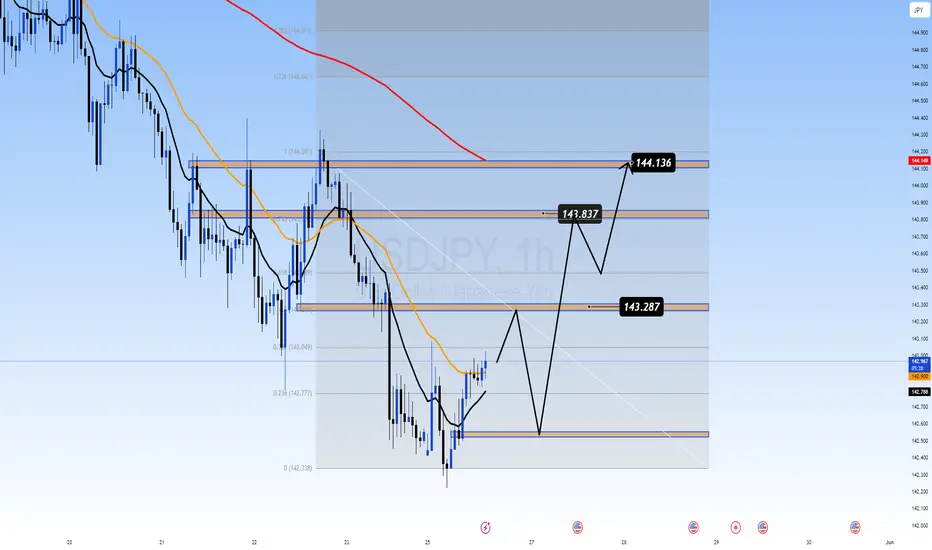
📊 Technical Structure: Momentum Building Toward 144.1
On the H1 chart:
Price bounced sharply from the 142.33 demand zone, forming a higher low.
EMA 13 – 34 – 89 show a bullish alignment ("fan-out formation") confirming short-term bullish momentum.
Resistance near 144.13–144.20 is key: a clean breakout could trigger an extended rally to 145.00+
However, this zone may also trigger profit-taking, especially if traders react to upcoming macro data.
🎯 Trade Strategy Recommendations
Scenario 1 – Buy the Pullback (Preferred):
Entry: 142.70 – 142.90
Stop-Loss: 142.30
Take-Profit: 143.80 → 144.13 → 144.60
Scenario 2 – Breakout Momentum Buy:
Entry: 144.15
Stop-Loss: 143.70
Take-Profit: 145.00 → 145.50
⚠️ Key Events to Watch:
US PCE Price Index (April): If hotter-than-expected, this would reinforce the Fed’s hawkish tone and lift USD.
BoJ Governor Speech (end of week): Any unexpected hawkish shift could trigger a short-term rebound in JPY.
Will It Break Through 3366 or Reversal Ahead of NFP Week? XAU/USD PLAN – 26/05 | Gold at Crossroads: Will It Break Through 3366 or Reversal Ahead of NFP Week?
Gold is currently testing a key resistance zone following a sharp rebound last week. With the Fed maintaining its hawkish stance and US-EU trade tensions on hold, the market is in a wait-and-see mode, creating an ideal environment for structured trades.
🌍 MACRO CONTEXT:
Trump Delays 50% Tariffs on the EU Until July 9: This temporarily reduced market tension, but the long-term risks remain.
US 10-Year Yields Surge Above 4.55%: Bond markets are still pricing in tighter financial conditions, supporting the USD.
The Fed Faces Operational Pressure: The Fed continues to trim its workforce by 10%, signaling internal challenges as rate hikes push up reserve interest payments.
➡️ Investors should brace for high volatility ahead of NFP week, closely monitoring any central bank statements and reactions.
🔍 TECHNICAL OUTLOOK – H1/H4 VIEW:
Gold is consolidating near the 3360-3366 region, which is a critical sell zone where price has faced resistance. The chart reveals a rising channel and clear Fair Value Gaps (FVGs) both above and below the current price, hinting at significant volatility and liquidity sweeps in the near term.
🔑 KEY LEVELS TO WATCH:
🔺 Resistance Zones:
3364 – 3366: Local top and key reversal zone, a critical point to watch for potential rejection.
3406 – 3408: The upper bound of the FVG zone, with a potential blow-off target if a breakout occurs.
🔻 Support Zones:
3324 – 3326: 20 EMA retest, a possible bullish bounce if price holds here.
3310 – 3308: Trendline + EMA89 confluence, a strong support area.
3304: A break below this level would invalidate the short-term bullish outlook.
🎯 TRADE SETUPS:
🟢 BUY SCALP:
Entry: 3326 – 3324
Stop-Loss: 3320
Take-Profit: 3330 → 3334 → 3338 → 3342 → 3346 → 3350
🟢 BUY ZONE:
Entry: 3310 – 3308
Stop-Loss: 3304
Take-Profit: 3314 → 3318 → 3322 → 3326 → 3330 → 3340
🔴 SELL SCALP:
Entry: 3364 – 3366
Stop-Loss: 3370
Take-Profit: 3360 → 3356 → 3352 → 3348 → 3344 → 3340
🔴 SELL ZONE:
Entry: 3406 – 3408
Stop-Loss: 3412
Take-Profit: 3400 → 3396 → 3392 → 3388 → 3385 → 3380
⚠️ STRATEGY RECOMMENDATION:
If price breaks above 3366 with momentum, expect a run to 3408 and potentially 3450.
If price rejects 3366 or fails to hold above 3320, look for short positions with tight stops.
📌 Final Note:
Avoid chasing price in the middle of the range. Wait for a clear rejection or breakout confirmation to enter.
