I have almost good fundamental views about Berkshire HathawayHello Traders and Investors,
According to my fundamental analysis considering EPS revisions and forecasts and also by taking the analysis TP and recommendations. I give a good score to BRK-B.
By considering the technical matters I think BRK.B, while is not a really good option for short-term, could be a great option for the mid-term investment.
I'll have more BRK-B in my portfolio.
Analysis

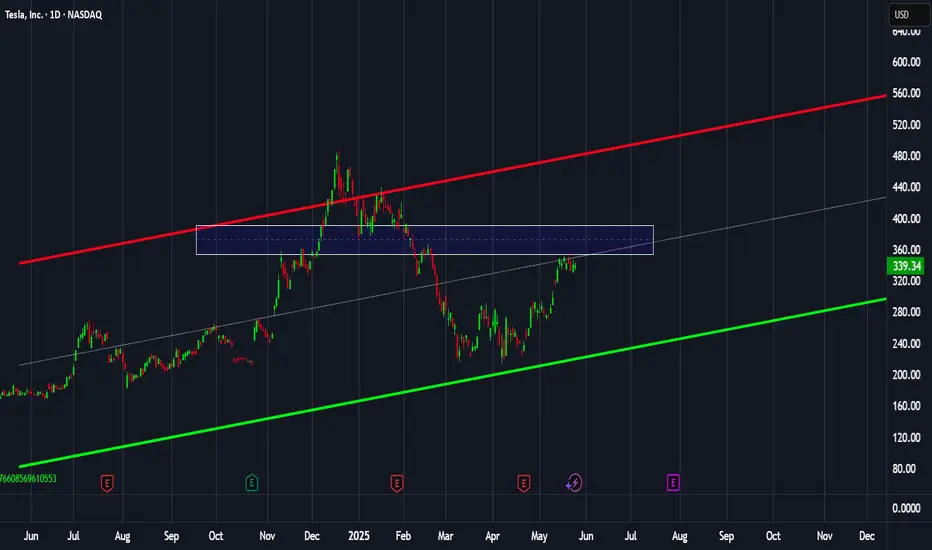
TSLA: Not recommended by me!Hello Traders,
TSLA Tesla fundamental score is not really good for me! My score is based on EPS data and EPS forecasts. there might be better stocks out there!
Regarding the technical aspects, White it reacted to the bottom of the channel median of the channel might be a small struggle. There is a strong possible resistance on the way up. I prefer to give a better/safer score after breaking this zone. Also, if we just consider technical analysis, any long options should have a SL, the possible rational SL is so far from the current price. in case of correction or breaking the zone, the possible SL could be very tighter.
Fundamental: Not recommended.
Technical: So-So.
Overall: I don't buy
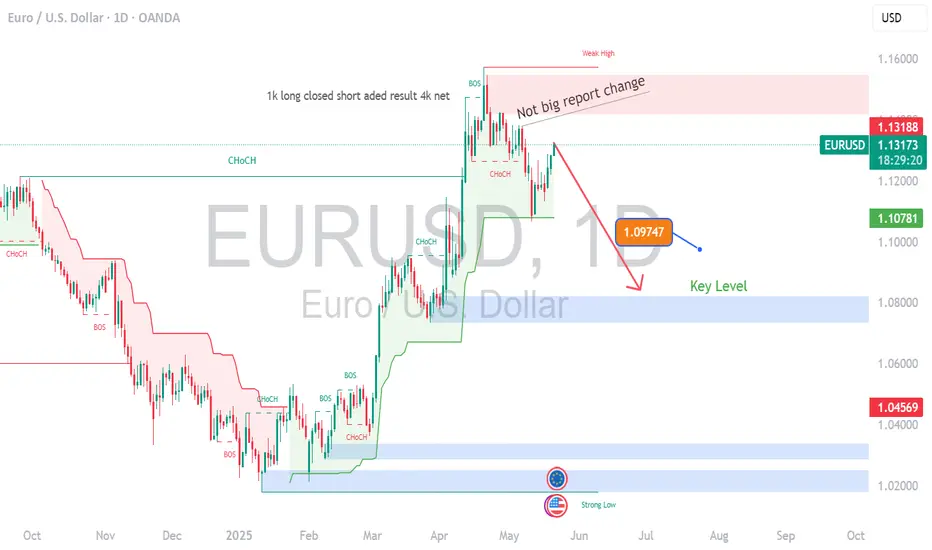
EUROUSD COT and Liquidity Analysis chart The EUR/USD pair has demonstrated a convincing upward momentum, which might suggest a sustained long opportunity. However, traders should exercise caution—this bullish move could be a classic trap. Despite the current strength, signs of exhaustion are beginning to appear in the price action and volume. The market may soon shift direction, and a downward correction or full reversal could be imminent. Now is not the time to chase the high—stay alert, as the fall could happen sooner than expected.
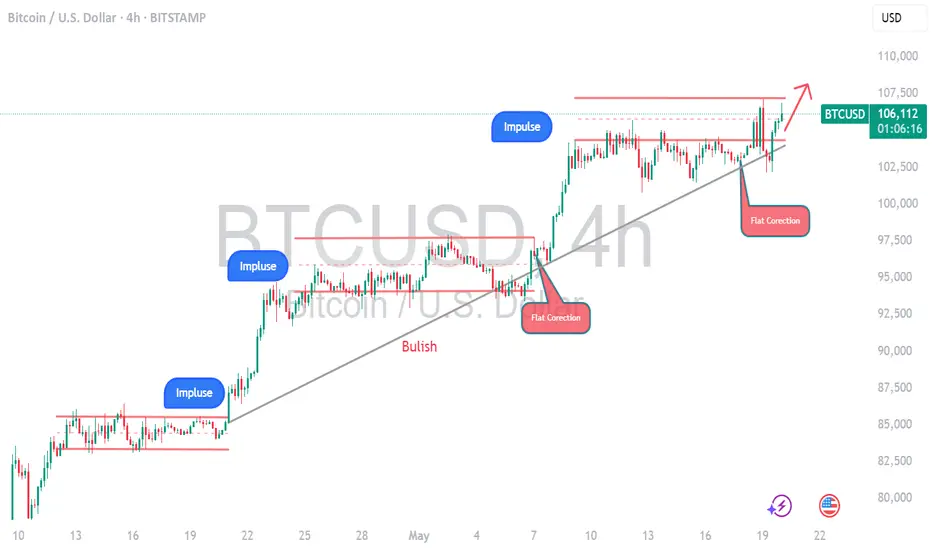
BTC- New Impulse Soon You Can See read captionbitcoin (BTC) – Bullish Outlook
Price action breaking above key resistance, signaling potential trend continuation
Strong volume supports the move, confirming buyer strength
Higher highs and higher lows forming—classic bullish market structure
RSI and MACD both showing bullish divergence
Next target zone: TSXV:XX ,XXX – watch for consolidation or breakout
Overall sentiment shifting positive with macro tailwinds
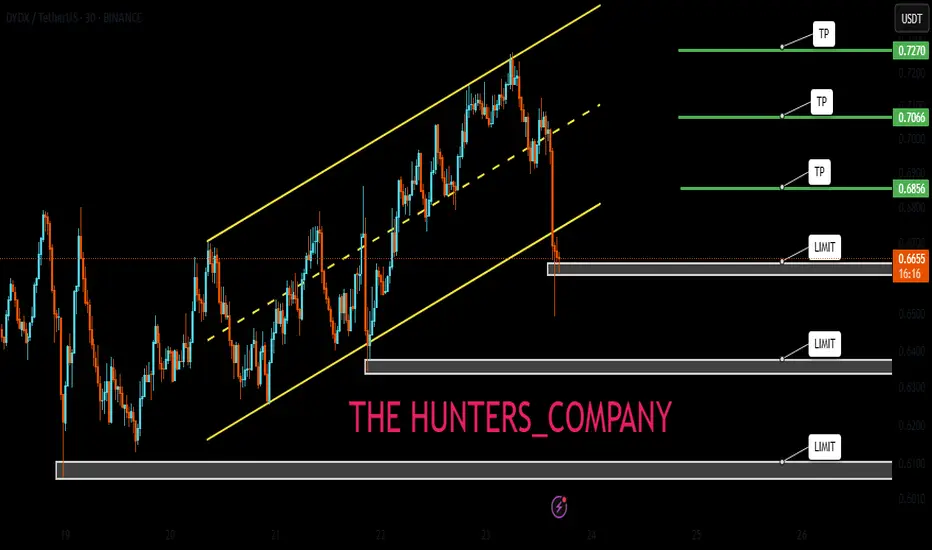
Free signal todayHello friends
Given the good growth, now the price is correcting and we can buy within the support ranges with capital and risk management and move with it to the specified targets.
*Trade safely with us*
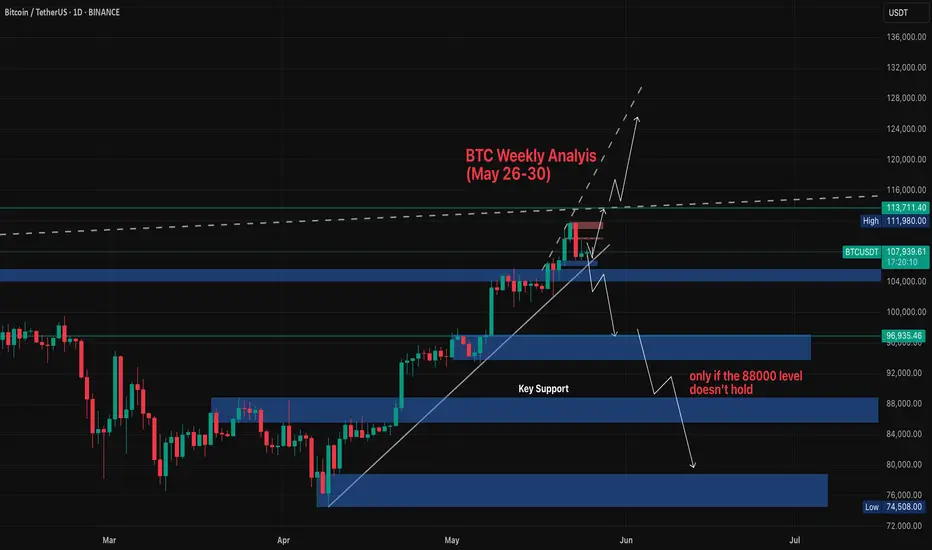
Weekly Analysis for BTC (May 26–30)BTC played out clean last week. Broke above 108k, tapped a new ATH at 110.5k, and pulled back slightly. Structure still bullish — 4H HLs holding strong and 107k retest held nicely into weekend close.
Key level to watch is 110k. If we break that with momentum, price can push to 115k or even 120.7k based on fibs and hype continuation. If we reject again, we might pull back to 107k or 100k — still a buy zone unless 88k breaks.
On the macro side, confluence is heavy:
– ETFs still driving big money inflow
– US debt growing after Trump’s new tax bill
– Moody’s downgrade adds more pressure
– Geopolitical tensions + safe-haven flow also helping BTC hold strength
– Holiday week in the US (Memorial Day), so volume might be low — fakeouts possible if liquidity dries up
Best zones to watch this week:
🔸 110k breakout for continuation
🔸 107k and 100k pullback buys
🔸 110.5k ATH for possible rejection scalps
As long as 88k holds, structure is clean. Bias remains bullish with both TA and macro pointing up.
Will be posting more detial daily anaylsis. follow for more updates. Or check out Streefree_trade IG.
Market Analysis For DXY: Week of May 26thFurther downside momentum looks like a strong possibility this week with liquidity and imbalances resting in short-term zones.

XAU/USD Outlook: Will Gold Open with a Bullish Gap?XAU/USD Outlook: Will Gold Open with a Bullish Gap?
Date Range: 26th – 30th May 2025
Timeframe: H4 (4-hour chart)
Market Bias: Short-term bullish
🔍 Fundamental Analysis
US–China Trade Tensions:
China halting imports of US goods puts pressure on the dollar (gold tends to move inversely).
Escalating tensions support gold as a safe-haven asset.
Tariff Threats to the EU:
Trump proposes 50% tariffs on EU products → potential retaliatory measures raise global uncertainty.
Risk-averse sentiment may push capital into gold.
Physical Gold Demand:
High seasonal demand from India and China ahead of festivals.
Inflation fears globally increase gold's appeal.
🌍 Macro Overview
Monetary Policy:
The Fed may face pressure to cut rates if trade tensions weaken the economy → bearish for USD, bullish for gold.
PBOC could devalue the yuan in response to trade friction, boosting gold prices in USD terms.
Market Sentiment:
A potential rise in the VIX (fear index) may drive investors towards safe havens like gold.
Strong demand for physical gold and ETFs, particularly in Asia, continues to support price.
Key Events This Week:
US Core PCE (inflation indicator)
US Consumer Confidence
EU and China responses to recent US trade policy
📊 Technical Analysis (H4)
Trend: Clear ascending channel
Current Price: 3,407.554
Key Resistance Levels:
3,407 – 3,444 (major resistance zone)
3,444.436 = potential all-time high
Support Zones:
3,361.648 (channel midpoint)
3,325.347 (lower channel boundary)
Fair Value Gaps (FVG):
FVG 1: 3,361 – 3,407
FVG 2: 3,325 – 3,340
Price Action Note:
A doji candle near resistance suggests a possible short-term pullback before continuation
🔄 Possible Scenarios
🔼 Bullish Scenario (60% probability):
Break above 3,444 with momentum could trigger a bullish gap and extend toward 3,500
Strong fundamental and technical support for upside
🔽 Bearish Scenario:
Rejection from 3,444 may lead to a pullback toward 3,361 or even 3,325 for buy setups
💡 Trade Plan
✅ Long Setup:
Entry: 3,361 – 3,370 (pullback into FVG or mid-channel support)
Take Profit: 3,444 (TP1), 3,500 (TP2)
Stop Loss: Below 3,325
❌ Short Setup (only on confirmed rejection):
Entry: On clear rejection at 3,444 (e.g. bearish engulfing or head & shoulders pattern)
Take Profit: 3,361
Stop Loss: Above 3,444
⏰ Optimal Trading Times
Monitor market open (Sunday, 26th May) for confirmation of a potential bullish gap
Best liquidity during London and New York sessions
📝 Summary:
Gold is well-positioned for a bullish move amid escalating trade tensions and USD weakness.
Watch closely for a breakout above 3,444 or a retracement to 3,361 as a strategic buy zone.
Stay updated on US inflation data and trade policy developments to adjust accordingly.

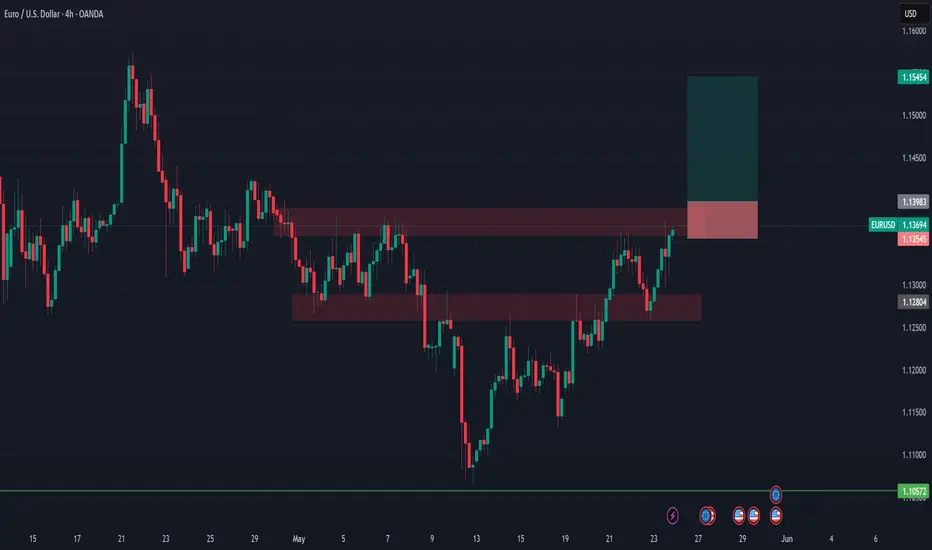
EURUSD Long Setup – Bullish Breakout PlayBias: ✅ Strong Buy
Timeframe: 4H
Pair: EURUSD
Week: 26–30 May 2025
🔍 Technical Analysis:
EURUSD has broken through a prior resistance and is currently testing a second resistance zone at 1.13983. I’m looking for a confirmed breakout above this level to enter long.
Entry: Break and 4H close above 1.13983
Stop Loss: Below support zone at 1.13545
Take Profit: Targeting resistance zone near 1.15454
Risk-Reward Ratio: ~3.36R
Structure: Higher highs forming, potential breakout continuation
🧠 Macro Confluence:
📉 USD Weakness: Dovish Fed + poor fundamentals (Investogenie Score 1.8 ↓, Conditional Score 3 ↓)
📈 EUR Strength: Improving Eurozone outlook, strong COT positioning, ECB easing bias
📊 Seasonal Bias: EURUSD bullish for this period
⚠️ Risk Management:
Watch for FOMC and GDP releases (USD) mid-week
Avoid premature entries without clear break and 4H confirmation
Optional: Wait for break & retest for higher probability
Drop your thoughts or setups below 👇
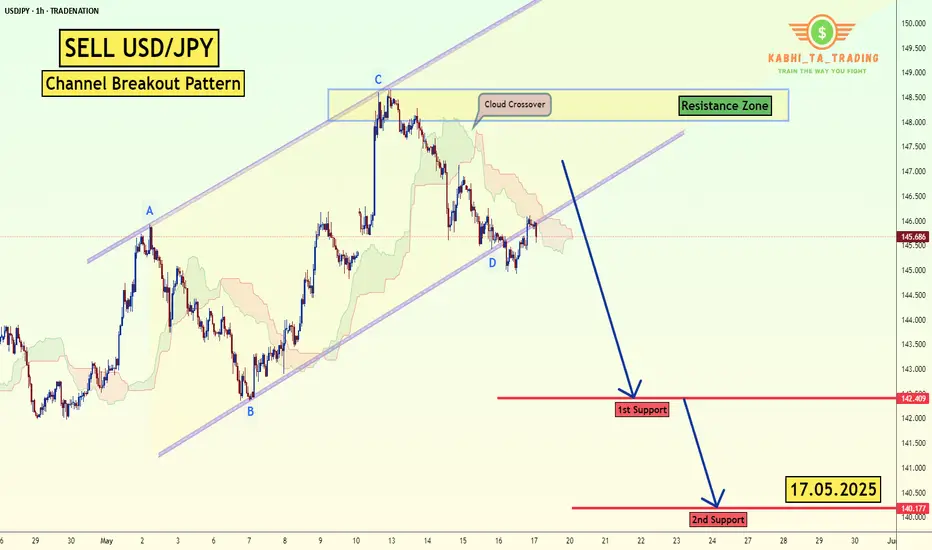
USD/JPY - H1 - Channel Breakout (17.05.2025) The Pair on the H1 timeframe presents a Potential Selling Opportunity due to a recent Formation of a Channel Breakout Pattern. This suggests a shift in momentum towards the downside in the coming hours.
Possible Short Trade:
Entry: Consider Entering A Short Position around Trendline Of The Pattern.
Target Levels:
1st Support – 142.40
2nd Support – 140.17
🎁 Please hit the like button and
🎁 Leave a comment to support for My Post !
Your likes and comments are incredibly motivating and will encourage me to share more analysis with you.
Best Regards, KABHI_TA_TRADING
Thank you.
Disclosure: I am part of Trade Nation's Influencer program and receive a monthly fee for using their TradingView charts in my analysis.
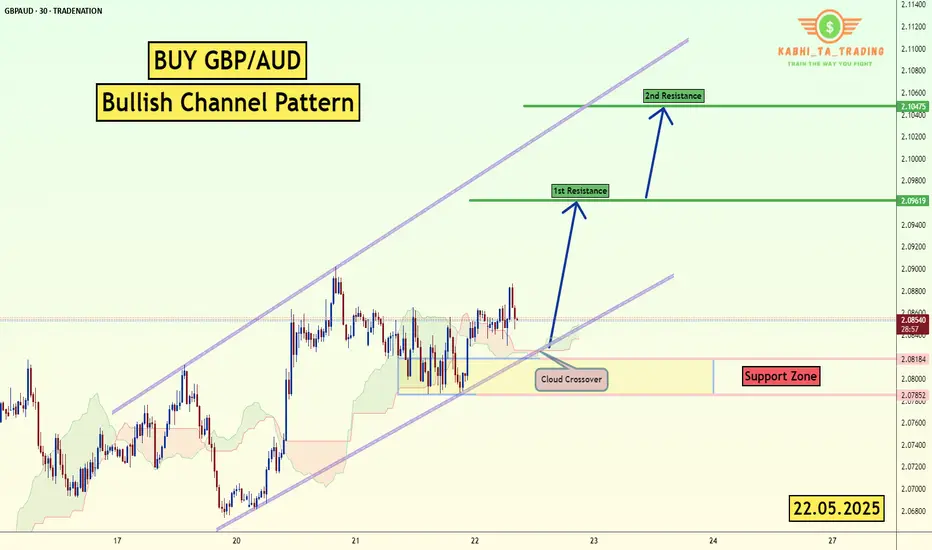
GBP/AUD - Bullish Channel (22.05.2025)The GBP/AUD pair on the M30 timeframe presents a Potential Buying Opportunity due to a recent Formation of a Channel Pattern. This suggests a shift in momentum towards the upside and a higher likelihood of further advances in the coming hours.
Possible Long Trade:
Entry: Consider Entering A Long Position around Trendline Of The Pattern.
Target Levels:
1st Resistance – 2.0961
2nd Resistance – 2.1047
🎁 Please hit the like button and
🎁 Leave a comment to support for My Post !
Your likes and comments are incredibly motivating and will encourage me to share more analysis with you.
Best Regards, KABHI_TA_TRADING
Thank you.
Disclosure: I am part of Trade Nation's Influencer program and receive a monthly fee for using their TradingView charts in my analysis.
Gold may break resistance level and then continue to growHello traders, I want share with you my opinion about Gold. In this chart, price previously formed a clear triangle pattern, where price was squeezed between two converging trend lines. After a period of consolidation, the market broke above this formation, reaching the resistance zone near 3365, but then started to retrace. Following that breakout, a new structure emerged, an upward wedge. The asset has been moving within this narrowing channel, forming higher lows and approaching the upper boundary with weakening momentum. This type of pattern often signals an upcoming strong move once the price breaks out from either side. Currently, Gold is trading near the resistance line of the wedge and just beneath the seller zone. I expect that the price may fall back to the support line of the wedge around the 3205 - 3185 area. After that, a bounce from this zone could trigger a bullish breakout from the wedge. That’s why I set my TP 1 at the 3420 level, this target aligns with a full wedge breakout and continuation of the upward movement through the resistance level and beyond the seller zone. Please share this idea with your friends and click Boost 🚀
Disclaimer: As part of ThinkMarkets’ Influencer Program, I am sponsored to share and publish their charts in my analysis.

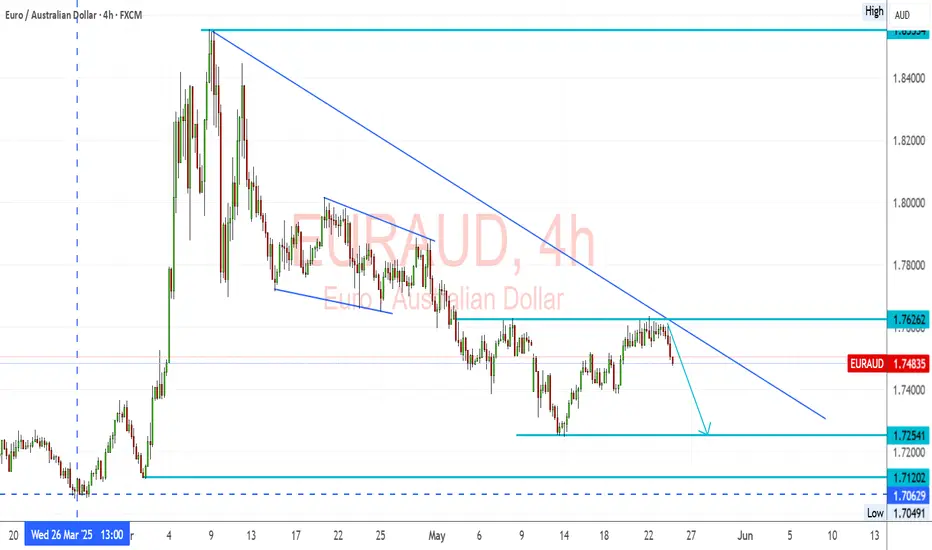
EURAUD – Trendline Holds, Bearish Setup Below 1.7626EURAUD Trend: EURAUD pair remains in a strong downtrend, marked by consistent lower highs and a descending trendline.
Resistance: 1.7626 has been retested and rejected, confirming it as a short-term ceiling.
Structure: The latest rejection from both horizontal resistance and the trendline confirms bearish intent.
🔽 Bearish Targets:
1.7254 – minor support and near-term target
1.7120 – stronger support zone
1.7060 – previous low and potential extended target
A clear break below 1.7400 could confirm continuation of the trend toward those levels.
Fundamental Overview:
🔻 EUR Weakness:
The Eurozone is slowing, particularly in Germany and France.
ECB remains cautious; recent comments show concern about tight financial conditions and sticky inflation.
Political uncertainties and mixed data prints are adding pressure.
🟢 AUD Support:
The RBA remains firm with hawkish language, holding rates while global peers lean dovish.
Commodities remain stable, and Australia benefits from demand out of Asia.
Domestic data (jobs and retail) shows surprising resilience.
Summary:
Bias: Bearish below 1.7626
Break Trigger: 1.7400
Target Range: 1.7250 – 1.7060
Fundamentals: Favor AUD on stronger economic footing and RBA policy tone
📉 EURAUD looks ready for another leg lower unless we see a breakout above 1.7630 with conviction.
HelenP. I Gold will reach trend line and then start to declineHi folks today I'm prepared for you Gold analytics. Observing this chart, we can see how the price traded inside the support zone, which coincided with the support level, and then dropped below. After this price turned around and made impulse up, reached the 3135 level, broke it, and made a retest. Next, price continued to move up and later it reached the resistance level, which coincided with the resistance zone, and even broke this level and rose to the trend line. But then Gold at once rebounded and fell below the 3385 level, breaking it again, and continued to decline next. When the price fell to 3215 points, it turned around and in a short time rose to the trend line, breaking the resistance level again, after which it turned around and started to fall. Gold broke the 3385 level one more time and later made a gap and then fell to the support level. But not a long time ago, it turned around and started to grow. At the moment, price has almost reached the trend line, so I expect that XAUUSD will reach the trend line finally and then rebound and start to decline. For this case, I set my goal at 3185 points. If you like my analytics you may support me with your like/comment ❤️
Disclaimer: As part of ThinkMarkets’ Influencer Program, I am sponsored to share and publish their charts in my analysis.

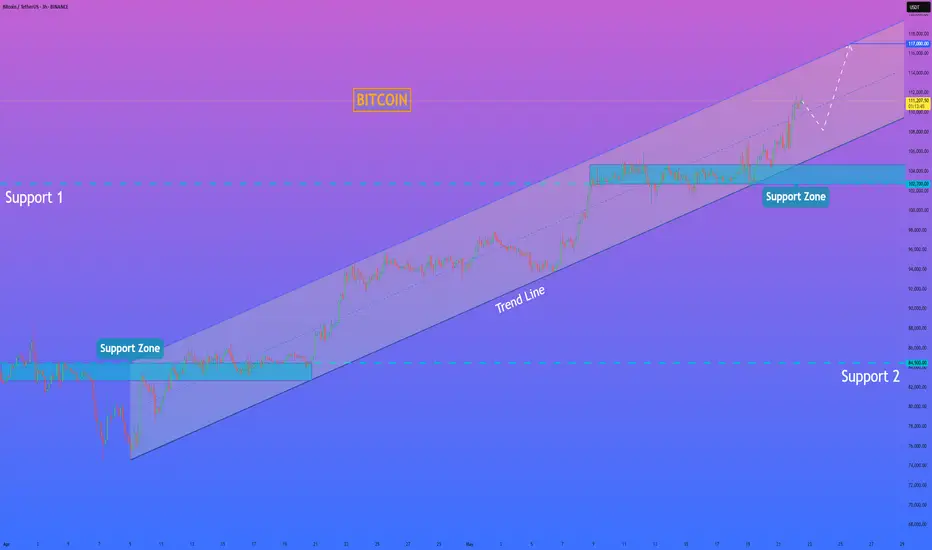
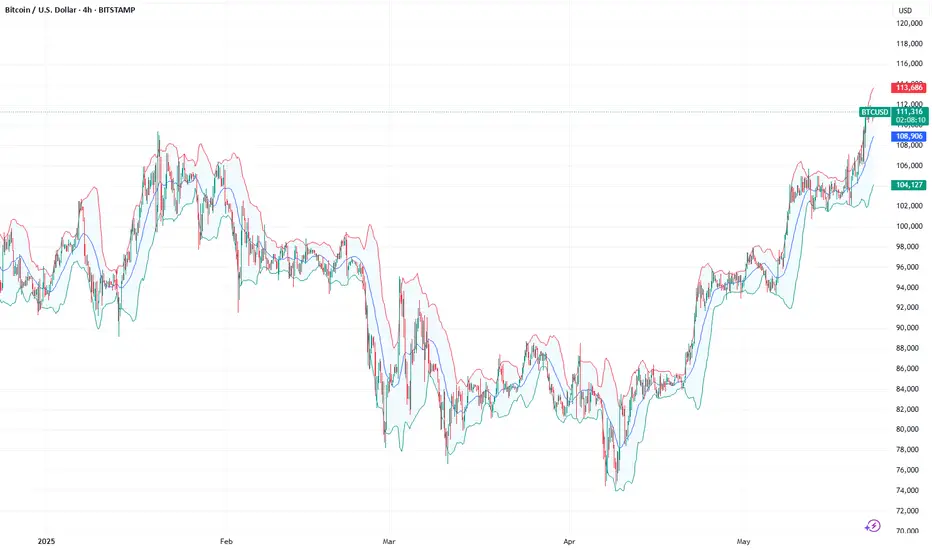
HelenP. I Bitcoin may continue to grow inside upward channelHi folks today I'm prepared for you Bitcoin analytics. In this chart, we can see how the price has been steadily moving within a well-defined upward channel, respecting its trend structure with clean rebounds from the lower boundary. The price has shown signs of a minor pullback after reaching the upper part of the consolidation range. However, it remains well-supported above the 102700 - 104700 zone, which aligns closely with both the trend line and a previous accumulation area. This confluence strengthens the case for a bullish continuation. Given the consistently higher lows, strong reaction from buyers near the channel support, and the overall bullish momentum, I believe this correction will be short-lived. The market appears to be gathering liquidity before attempting another leg upward. If the current structure holds, BTCUSDT is likely to continue climbing along the lower edge of the channel, gradually pushing toward the next significant target. My current goal remains at 117000 points, a level that aligns with the channel’s upper resistance and reflects the natural extension of the ongoing bullish movement. If you like my analytics you may support me with your like/comment ❤️
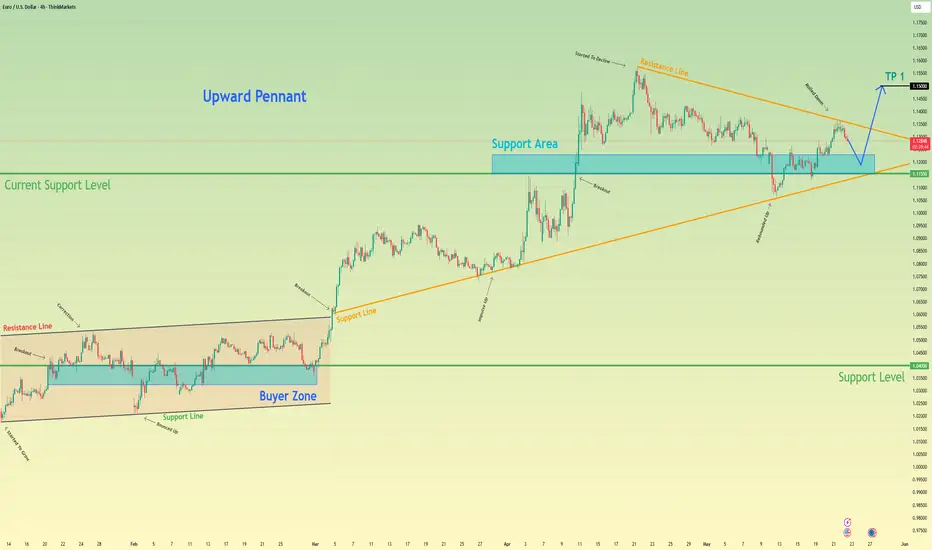
Euro will start to grow from support and then leave pennantHello traders, I want share with you my opinion about Euro. Previously, price was moving confidently inside an upward channel, forming steady higher highs and higher lows. After a clear breakout from that structure, the price started consolidating inside a new pattern, an upward pennant. This formation usually appears as a continuation structure, where the market builds pressure before a new impulse. Currently, the price is trading near the middle of the pennant, after rolling down from the resistance line and rebounding up from the support area. The structure is compressing, and a retest of the support line near 1.1155 may occur before a breakout happens. Given the confluence of the pennant structure, the strong support area, and the previous bullish momentum, I expect the Euro to rebound again from the lower trend line and initiate an upward breakout. That’s why I set my TP 1 at the 1.1500 level, a logical target aligned with the upper boundary of the pattern and next key resistance. Please share this idea with your friends and click Boost 🚀
Disclaimer: As part of ThinkMarkets’ Influencer Program, I am sponsored to share and publish their charts in my analysis.
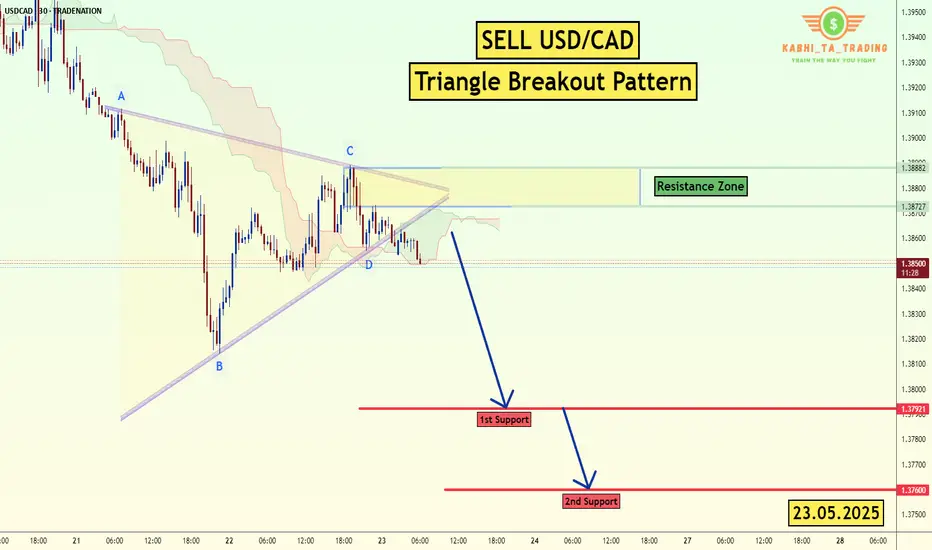
USD/CAD - Triangle Breakout (23.05.2025)The USD/CAD Pair on the M30 timeframe presents a Potential Selling Opportunity due to a recent Formation of a Triangle Breakout Pattern. This suggests a shift in momentum towards the downside in the coming hours.
Possible Short Trade:
Entry: Consider Entering A Short Position around Trendline Of The Pattern.
Target Levels:
1st Support – 1.3792
2nd Support – 1.3760
🎁 Please hit the like button and
🎁 Leave a comment to support for My Post !
Your likes and comments are incredibly motivating and will encourage me to share more analysis with you.
Best Regards, KABHI_TA_TRADING
Thank you.
Disclosure: I am part of Trade Nation's Influencer program and receive a monthly fee for using their TradingView charts in my analysis.
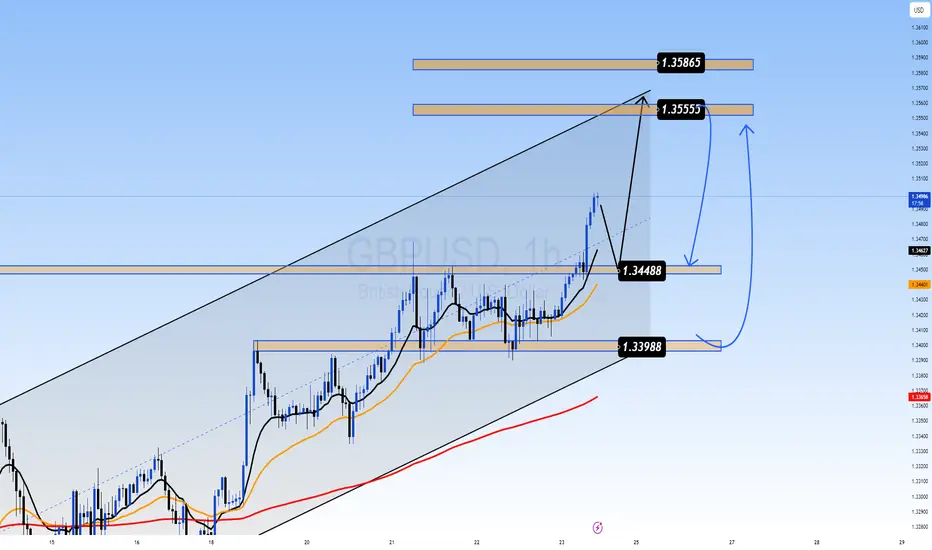
IS THE BULLISH CHANNEL NEARING EXHAUSTION OR JUST GEARING UP?GBPUSD OUTLOOK – IS THE BULLISH CHANNEL NEARING EXHAUSTION OR JUST GEARING UP?
📊 Macro Overview:
The USD continues to soften slightly as markets begin pricing in a potential rate cut by the Fed later in Q3. Meanwhile, the British Pound (GBP) is holding firm, supported by stronger-than-expected UK macroeconomic data—particularly retail sales and inflation figures.
However, UK fiscal concerns remain a headwind, and GBPUSD is highly sensitive to upcoming U.S. data—especially Core PCE and employment figures this week.
📉 Technical Analysis:
On the 1H chart, GBPUSD is moving within a broad ascending channel and is now approaching the upper resistance trendline at 1.3555 – a key zone that could trigger short-term profit-taking.
EMAs 13 and 34 are still in bullish alignment, supporting ongoing momentum.
Despite the bullish setup, current candle structure suggests a potential pullback to the 1.3448 support zone before a continuation higher—if buyers regain control.
🔑 Key Price Levels:
Resistance Zones:
🔸 1.3555 – Channel top resistance
🔸 1.3586 – Extended resistance zone
Support Zones:
🔹 1.3448 – Technical and Fibo confluence
🔹 1.3398 – Major structure support in case of breakdown
🛠️ Trade Scenarios:
✅ Scenario 1: BUY on retracement
Entry: 1.3448 (watch for bullish confirmation on H1)
Stop Loss: 1.3394
Take Profit: 1.3500 → 1.3555 → 1.3585
✅ Scenario 2: SELL scalp from resistance
Entry: 1.3555
Stop Loss: 1.3588
Take Profit: 1.3500 → 1.3460
🧠 Final Thoughts:
GBPUSD remains bullish in structure but is testing key resistance levels. A clean pullback to the 1.3448 region may provide a strong buying opportunity if confirmed by price action. If this level breaks, bearish divergence could kick in and push the pair back to deeper support zones. Stay alert for high-impact economic releases and trade with solid risk management!
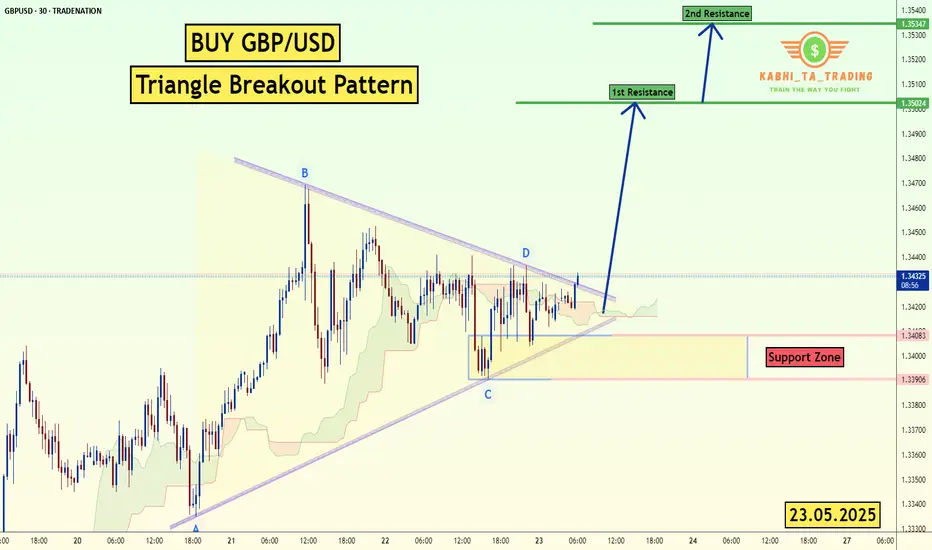
GBP/USD - Triangle Breakout (23.05.2025)The GBP/USD pair on the M30 timeframe presents a Potential Buying Opportunity due to a recent Formation of a Triangle Pattern. This suggests a shift in momentum towards the upside and a higher likelihood of further advances in the coming hours.
Possible Long Trade:
Entry: Consider Entering A Long Position around Trendline Of The Pattern.
Target Levels:
1st Resistance – 1.3502
2nd Resistance – 1.3534
🎁 Please hit the like button and
🎁 Leave a comment to support for My Post !
Your likes and comments are incredibly motivating and will encourage me to share more analysis with you.
Best Regards, KABHI_TA_TRADING
Thank you.
Disclosure: I am part of Trade Nation's Influencer program and receive a monthly fee for using their TradingView charts in my analysis.
Digital gold breaks records: Bitcoin broke through the $111,000 On May 22, 2025, Bitcoin (#BTCUSD) reached a new all-time high, surpassing the $111,000 mark. Notably, this record was set on the day marking the 15th anniversary of Bitcoin Pizza Day - a symbolic date commemorating the first real-world purchase made with #BTCUSD in 2010.
Several major factors have contributed to the recent rise of Bitcoin:
Institutional Investment : The launch of spot Bitcoin ETFs by BlackRock, Fidelity, and others has opened the door for large-scale investors to access #BTCUSD, boosting both liquidity and demand.
Regulatory Clarity : The adoption of clear cryptocurrency regulations in the U.S. and the EU has increased trust in digital assets and attracted more conservative capital.
Banking Integration : Support for #BTCUSD by apps like PayPal, Revolut, and major banks has simplified access for millions of users and expanded its real-world usage.
Macroeconomic Instability : Inflation, geopolitical tensions, and the weakening of fiat currencies have strengthened demand for #BTCUSD as "digital gold" and a means of capital preservation.
Halving and Technological Progress : The reduction in BTC issuance and the ongoing development of the Lightning Network are reinforcing Bitcoin’s scarcity and enhancing its fundamental value.
Surpassing such a significant price level has reinforced #BTCUSD’s position as one of the key assets in today’s financial markets, confirming its status as "digital gold." The rally has sparked a wave of optimism and renewed activity on crypto exchanges, while also drawing increased interest in digital assets from the broader public.
FreshForex analysts share the view that #BTCUSD still holds significant growth potential. In our assessment, the breakout above $111,000 in May signals a continuing upward trend and the possibility of further gains, driven by growing institutional interest.
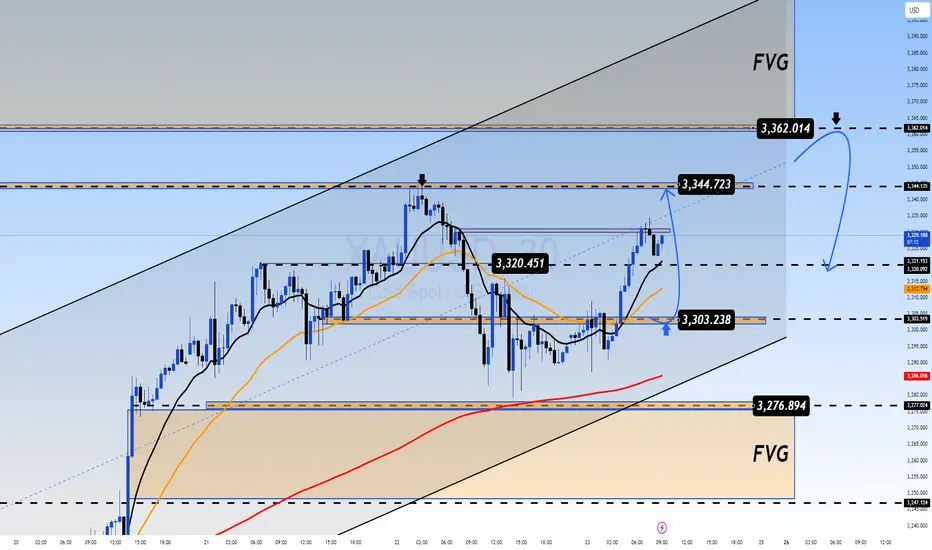
GOLD XAUUSD PLAN – MAY 23 IS GOLD READY TO SURGE AGAIN?GOLD XAUUSD PLAN – MAY 23 | GEOPOLITICAL RISKS FLARE UP – IS GOLD READY TO SURGE AGAIN?
🌍 MACRO CONTEXT:
Iran-Israel-US Tension: Iran has warned that if Israel attacks its nuclear facilities, the U.S. will also be held responsible. Tehran vows to take “special measures” to protect its nuclear program, and has filed formal complaints with the UN. Markets are reacting sharply to this growing geopolitical risk.
Goldman Sachs Alert: Goldman Sachs recommends gold and crypto (Bitcoin) as safe-haven assets amidst soaring bond yields, fiscal crisis fears, and a failed 20-year U.S. Treasury auction. They warn that rising yields are now posing serious threats to equities while the dollar faces longer-term pressure.
📉 TECHNICAL OUTLOOK (M30):
Price has bounced off the 3303 zone, and is showing signs of a bullish breakout if 3360 is taken out.
There is a clear Fair Value Gap (FVG) above 3360–3380, which has yet to be fully filled. Below, the untested FVG zone near 3274–3250 remains vulnerable if support fails.
EMA 13 is trending above EMA 34 and EMA 200 → bullish bias remains valid as long as 3274 holds.
🔑 KEY LEVELS TO WATCH:
SELL Side Key Level: 3358–3360 → A breakout above this zone could lead to a retest of ATH near 3400–3450.
BUY Side Key Level: 3276–3274 → Losing this zone could push gold back below 3200, targeting deeper correction levels.
📈 TRADE SETUPS:
🔵 BUY ZONE: 3276 – 3274
SL: 3270
TPs: 3280 → 3284 → 3288 → 3292 → 3296 → 3300
🔵 BUY SCALP: 3304 – 3302
SL: 3298
TPs: 3308 → 3312 → 3316 → 3320 → 3325 → 3330 → 3340
🔴 SELL ZONE: 3376 – 3378
SL: 3382
TPs: 3372 → 3368 → 3364 → 3360 → 3350
🔴 SELL SCALP: 3344 – 3346
SL: 3350
TPs: 3340 → 3336 → 3332 → 3328 → 3324 → 3320
🧠 FINAL THOUGHTS:
Gold remains highly sensitive to geopolitical headlines and macro instability. As long as the 3303 support area holds, look for bullish continuation towards FVG highs. Break below 3274 may shift the bias sharply to the downside. Stay alert — volatility is expected to rise ahead of the next U.S. data and developments in the Iran nuclear issue.GOLD XAUUSD PLAN – MAY 23 | GEOPOLITICAL RISKS FLARE UP – IS GOLD READY TO SURGE AGAIN?
🌍 MACRO CONTEXT:
Iran-Israel-US Tension: Iran has warned that if Israel attacks its nuclear facilities, the U.S. will also be held responsible. Tehran vows to take “special measures” to protect its nuclear program, and has filed formal complaints with the UN. Markets are reacting sharply to this growing geopolitical risk.
Goldman Sachs Alert: Goldman Sachs recommends gold and crypto (Bitcoin) as safe-haven assets amidst soaring bond yields, fiscal crisis fears, and a failed 20-year U.S. Treasury auction. They warn that rising yields are now posing serious threats to equities while the dollar faces longer-term pressure.
📉 TECHNICAL OUTLOOK (M30):
Price has bounced off the 3303 zone, and is showing signs of a bullish breakout if 3360 is taken out.
There is a clear Fair Value Gap (FVG) above 3360–3380, which has yet to be fully filled. Below, the untested FVG zone near 3274–3250 remains vulnerable if support fails.
EMA 13 is trending above EMA 34 and EMA 200 → bullish bias remains valid as long as 3274 holds.
🔑 KEY LEVELS TO WATCH:
SELL Side Key Level: 3358–3360 → A breakout above this zone could lead to a retest of ATH near 3400–3450.
BUY Side Key Level: 3276–3274 → Losing this zone could push gold back below 3200, targeting deeper correction levels.
📈 TRADE SETUPS:
🔵 BUY ZONE: 3276 – 3274
SL: 3270
TPs: 3280 → 3284 → 3288 → 3292 → 3296 → 3300
🔵 BUY SCALP: 3304 – 3302
SL: 3298
TPs: 3308 → 3312 → 3316 → 3320 → 3325 → 3330 → 3340
🔴 SELL ZONE: 3376 – 3378
SL: 3382
TPs: 3372 → 3368 → 3364 → 3360 → 3350
🔴 SELL SCALP: 3344 – 3346
SL: 3350
TPs: 3340 → 3336 → 3332 → 3328 → 3324 → 3320
🧠 FINAL THOUGHTS:
Gold remains highly sensitive to geopolitical headlines and macro instability. As long as the 3303 support area holds, look for bullish continuation towards FVG highs. Break below 3274 may shift the bias sharply to the downside. Stay alert — volatility is expected to rise ahead of the next U.S. data and developments in the Iran nuclear issue.
SOL/USDTHello, I hope you are well. I left you the analysis of Solana. Tell me your opinion. I saw that it is bullish and it may reach the target I set. If the white area breaks, we can buy again and go up.

Fundamental Market Analysis for May 23, 2025 EURUSDEvent to pay attention today:
17:00 EET. USD- Volume of home sales on the primary market
EURUSD:
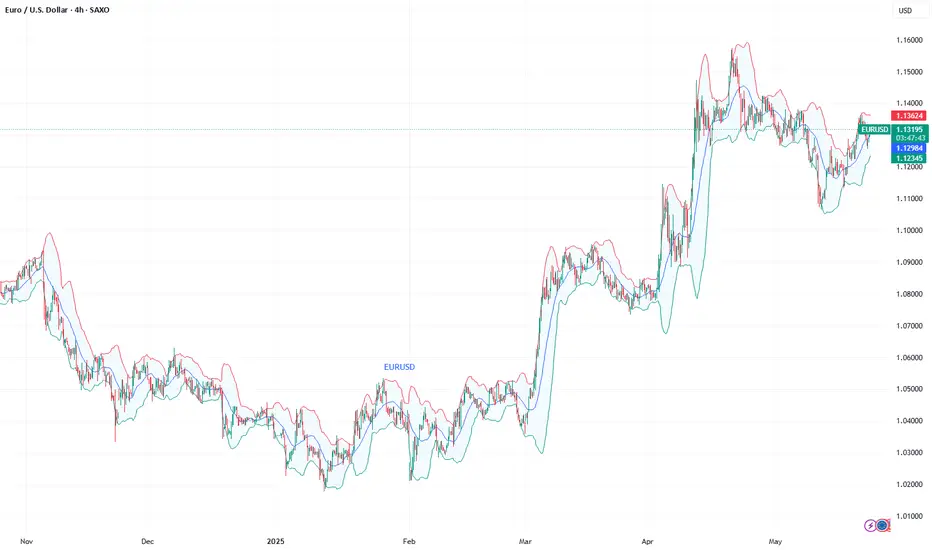
EUR/USD is recovering its recent losses from the previous session and is trading around 1.1310 during Asian hours on Friday. The pair is rising on the back of lower US Treasury yields, which continue to decline after the US 30-year bond yield retreated from 5.15 per cent, the highest in 19 months.
US President Donald Trump's ‘One Big Beautiful Bill’ has passed the House of Representatives and is on its way to the Senate, sparking fears of a widening budget deficit in the United States (US).
However, EUR/USD lost around 0.50 per cent on Thursday as the US dollar gained as the S&P Global Composite Purchasing Managers' Index (PMI) for May came in at 52.1, up from April's 50.6. Meanwhile, the manufacturing PMI rose to 52.3 from 50.2 previously, while the services PMI rose to 52.3 from 50.8.
Fed Chairman Christopher Waller noted on Thursday that markets are watching fiscal policy. Waller also said that if rates are close to 10%, the economy will be in good shape for H2 and the Fed may be in a position to cut rates later this year.
The Financial Times reported that President Trump is pushing the European Union (EU) to cut tariffs or impose more duties. US Trade Representative Greer is set to tell fellow EU Commissioner for Trade and Economic Security, Maroš Šefčovič, that the recent ‘explanatory memorandum’ does not meet US expectations.
Trading recommendation: BUY 1.13200, SL 1.13000, TP 1.14200