BA: Boeing down on better than expected results! 30-07-2025Yesterday we get Boeing earnings report which came better than expected, but the stock down more than 4% as the company is not expected to make positive profit or free cashflow before 2026. No dividends currently paid, so there is nothing attractive to me now.
Disclaimer: This content is NOT a financial advise, it is for educational purpose only.
Analysis

DCF VALUATION ANALYSIS OF BSEConclusion: OVERVALUED
:-OVERVIEW
BSE Limited has shown strong financial growth in recent years. Its revenue jumped from ₹924.84 crore in FY23 to ₹1,592.50 crore in FY24 (a 72% increase), and further surged to ₹3,212 crore in FY25, doubling year-on-year. EBITDA grew impressively to ₹1,779 crore in FY25 with a 60% increase, and EBIT reached ₹1,670 crore, up 56%. Net profit also rose significantly to ₹1,112 crore, with earnings per share increasing to ₹81. Dividend per share improved to ₹23, reflecting healthy returns
DCF:
-The valuation was performed using a Discounted Cash Flow (DCF) approach based purely on verified financial data and market risk parameters without relying on user-specific growth assumptions.
-The cost of equity was calculated using an adjusted risk-free rate plus equity risk premium multiplied by beta, resulting in a discount rate of approximately 13.58%. The terminal growth rate was conservatively taken as 4%. Using these reliable inputs and actual EBIT cash flows, the intrinsic enterprise value was estimated at around ₹36,839 crore, translating to an intrinsic value per share of approximately ₹1,364.
-Currently, BSE’s market price is around ₹2,480 per share, which is substantially higher than the intrinsic value derived from fundamentals, indicating the stock is trading at a significant premium. This valuation is grounded in audited company financials and globally accepted valuation methodologies, providing a trustworthy reference point for investors.

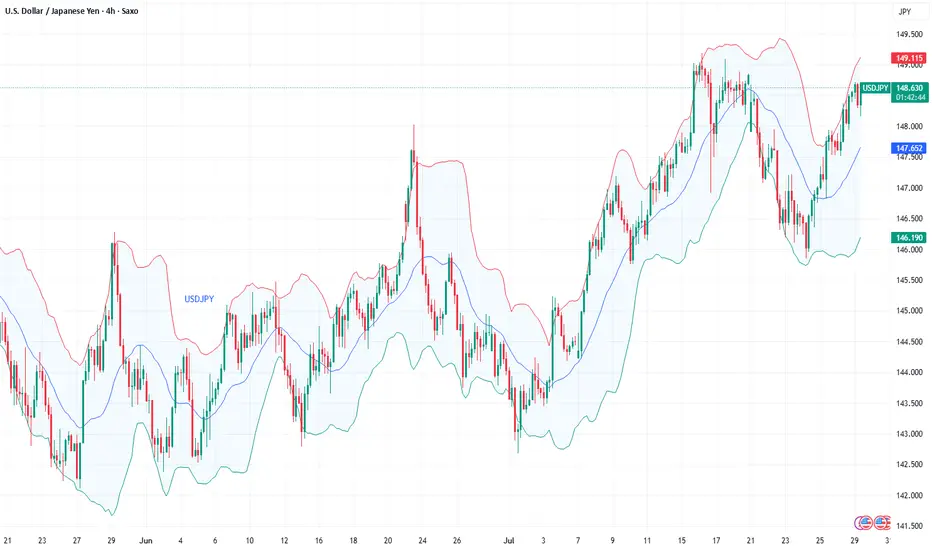
Fundamental Market Analysis for July 29, 2025 EURUSDThe pair is consolidating at 148.500, leaving behind a nearly 1% gain since the start of the week. High Treasury yields (10-year bonds — 4.34%) are supporting demand for the dollar, while the easing of the US-Japan trade conflict is reducing defensive demand for the yen. As part of yesterday's statement by the US Treasury, tariffs on Japanese cars are being reduced to 10%, which improves the outlook for export-oriented corporations, but at the same time reduces investors' need for safe-haven currencies.
Despite inflation of 3.7% y/y and rising food costs, the Bank of Japan is likely to keep its rate at 0.5% following its July 30-31 meeting and only revise its CPI forecasts upward. Former Deputy Governor of the Central Bank Hiroshi Nakaso acknowledges that further increases are only possible after assessing the effect of US tariffs, i.e., not before 2026. This scenario reinforces negative real interest rates and a widening yield differential with the US.
In addition, the inflow of Japanese investment into foreign bonds has resumed amid confidence in a gradual, rather than sharp, normalization of BOJ policy. Taken together, these factors point to the likelihood of a test of 150.00 in the coming days in the absence of verbal intervention by the Japanese Ministry of Finance.
Trading recommendation: BUY 148.500, SL 147.900, TP 150.500
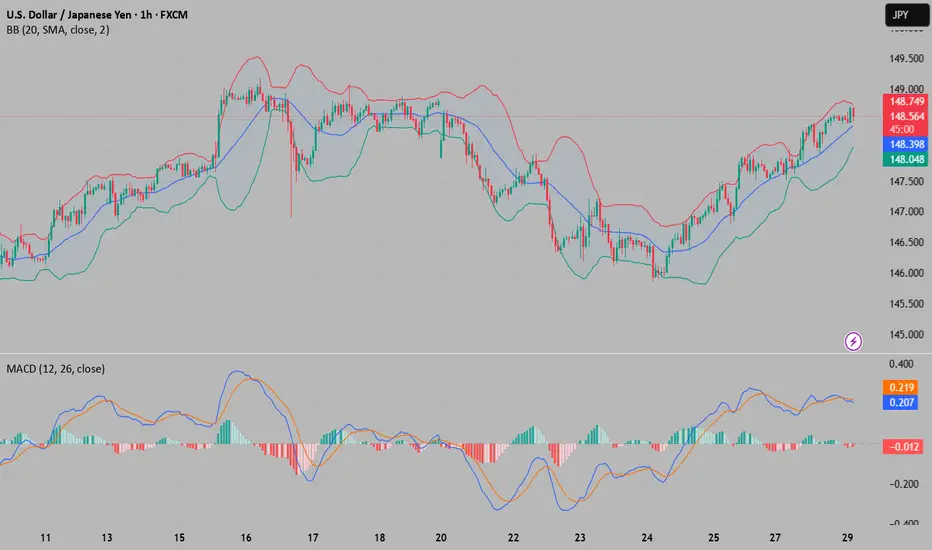
USD/JPY(20250729)Today's AnalysisMarket news:
After gold prices soared to an all-time high of more than $3,500 an ounce in April, the latest report from the Commodity Futures Trading Commission (CFTC) showed that fund managers have increased their bullish bets to the highest level in 16 weeks.
Technical analysis:
Today's buy and sell boundaries:
148.19
Support and resistance levels:
149.23
148.84
148.59
147.78
147.53
147.14
Trading strategy:
If the price breaks through 148.59, consider buying, the first target price is 148.84
If the price breaks through 148.19, consider selling, the first target price is 147.78
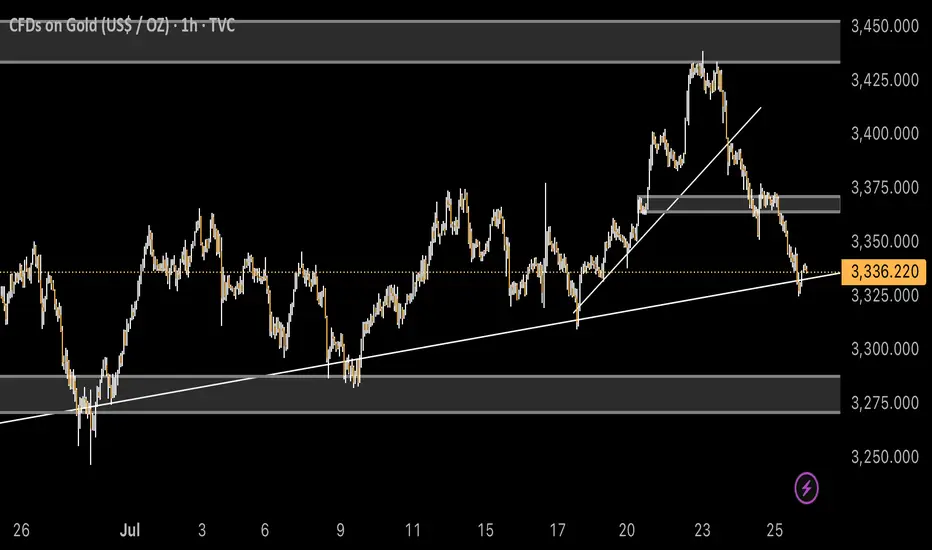
Analysis for the next week (XAUUSD) Hello Traders, Happy Weekend.
The market is going to open tonight, As you see the down trend is running, the price is falling like a waterfall.
Now the market is on the support area according to H1 & H4 TimeFrame.
The market is respecting the support area and there is a Trend line support according to D1 TimeFrame.
The market is respecting the Trend line and support area.
According to my analysis gold will drop till 3287 to 3271.
If gold fly, it can fly till 3350 then it will fall.
Stay tune for update.
Kindly share your views and leave positive comments here, Thanks.
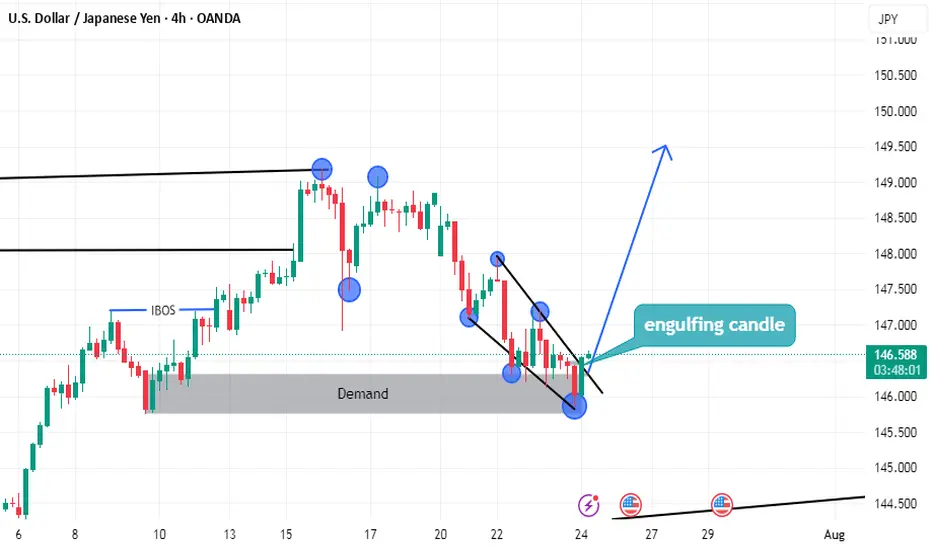
USDJPY LONG setupsimply
we have demand
and the price can't lower low
end we have break of structure on low time frame
and we have more but i don't have enough time to tell you
Look the photo well
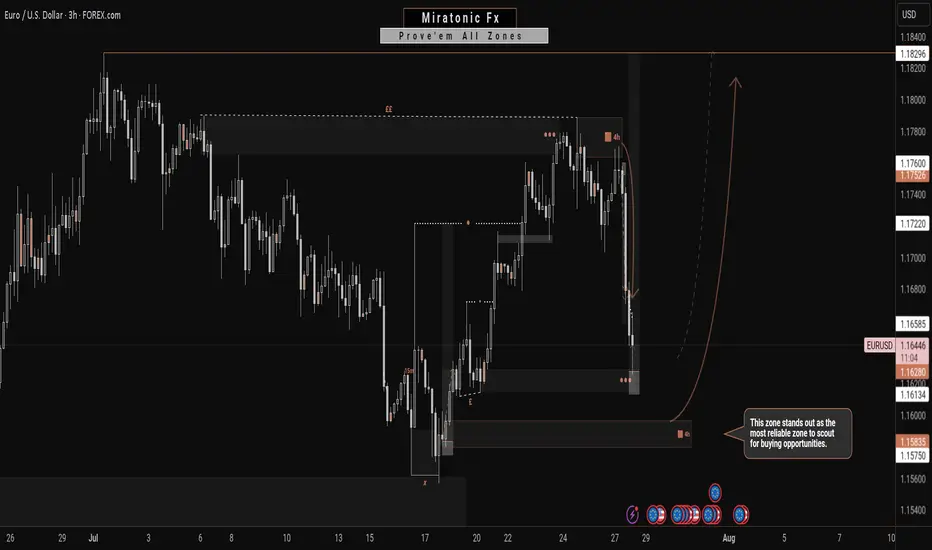
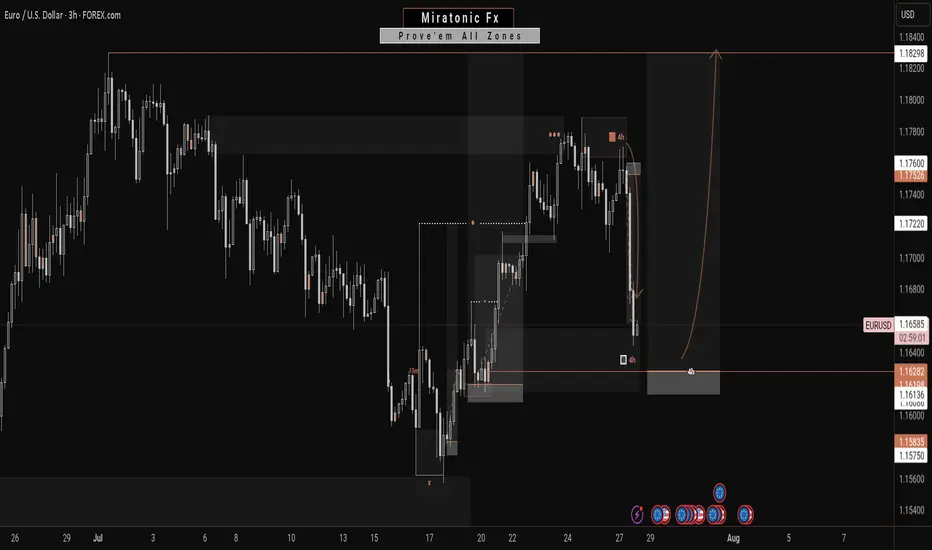
Potentially, A Safer Way To Long The EURUSDIn contrast to my previous outlook, the current price action suggests an increased probability of a deeper bearish move—potentially invalidating the buy zone marked out in the previous analysis. This sudden change is largely driven by the prospect of untapped liquidity residing beneath that zone, reinforcing the well-known market principle that price seeks out liquidity before committing to directional moves.
Given this development, the newly identified zone on the chart emerges as a more technically sound and reliable area from which to anticipate bullish interest. It aligns better with the broader liquidity profile and offers a stronger base for accumulation. Traders may opt to wait for confirmations within this zone or, depending on their risk appetite, consider executing buy positions upon price entry.
As always, patience and clarity are key as we allow price to reveal its intention.
Fingers crossed 🤞
Wishing you all a focused and profitable trading week.
Catch you on the next one. 🫡
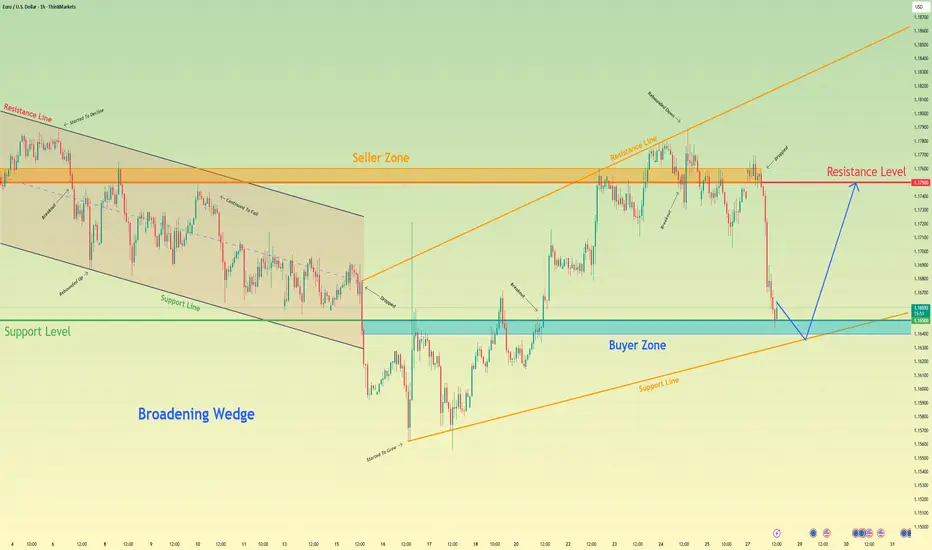
Euro will rebound from support line of wedge to resistance levelHello traders, I want share with you my opinion about Euro. After breaking out decisively from a prior downward channel, the euro initiated a significant structural shift, moving from a clear downward trend into a new and more volatile market condition. This transition has led to the development of a large broadening wedge pattern, which is characterised by higher highs and lower lows, indicating an expansion in volatility as both buyers and sellers fight for control. The boundaries of this struggle are well-defined by a major buyer zone around 1.1650 and a formidable seller zone near 1.1750. Currently, the pair is in a corrective phase, moving downwards within the wedge after a recent upward rebound was rejected from the upper resistance line. The primary working hypothesis is a long scenario, which anticipates that this downward correction will find strong support at the confluence of the wedge's ascending support line and the horizontal buyer zone around 1.1650. A confirmed bounce from this critical area of support would validate the integrity of the broadening wedge pattern and likely trigger another powerful upward rotation. Therefore, the TP is strategically placed at the 1.1750 resistance level. Please share this idea with your friends and click Boost 🚀
Disclaimer: As part of ThinkMarkets’ Influencer Program, I am sponsored to share and publish their charts in my analysis.
Next Move On EURUSD: A Bullish ContinuationWith this 4H bearish impulsive move, it’s easy to assume a reversal is underway to break the previous daily swing low. However, this appears more like a liquidity grab—fueling the next leg to the upside.
Price has retraced into a key zone that previously performed a strong liquidation. With significant liquidity already swept and clean inducements now resting above, this level becomes crucial.
This zone is the last stand: a break downward may target the daily swing low, while a hold and reaction could propel price toward the swing high.
Fingers crossed 🤞 as we watch price play out.
Have a great trading week, traders.
Catch you in the next one. 🫡
EUR/USD Technical Analysis📈 EUR/USD Technical Analysis
🔍 1. Market Structure
⚙ Trend Context
• The overall trend since mid-July has been bullish, with higher highs and higher lows forming after a bounce from a key demand zone (around 1.15380).
• However, recent candles show indecision and a potential reversal, suggesting weakening momentum.
⸻
🧱 2. Volume Profile Insight (VRVP)
• High Volume Nodes (HVNs):
• Significant trading activity occurred between 1.172–1.176, now acting as resistance.
• Low Volume Gaps:
• Thin liquidity zones exist between 1.165–1.158, which could result in swift price movement if selling pressure increases.
📘 Educational Insight: Thin volume areas on a profile typically allow for faster price transitions due to lack of order density.
⸻
📊 3. Envelope Indicator – Nadaraya-Watson (8,3)
• A mean-reversion tool estimating dynamic overbought and oversold areas.
• Price recently rejected the upper boundary, reinforcing the bearish outlook.
• The lower envelope, around 1.158–1.160, aligns with the projected bearish target.
⸻
🟫 4. Demand Zone Analysis
• Labeled “DEMAND ZONE” at 1.15380–1.15830
• Previously caused a strong bullish reversal, marking it as an area of institutional interest.
• A re-test of this zone may attract buyers once again, presenting a key support area.
📘 Educational Insight: Demand zones reflect

Fundamental Market Analysis for July 28, 2025 GBPUSDThe pound is sliding to 1.34250, reacting to a fresh slowdown in UK inflation and reduced expectations of further tightening from the Bank of England. The annual CPI for June fell to 2.2%, the lowest since March 2022, allowing the regulator to keep rates unchanged at the August meeting.
Meanwhile, rising Treasury yields intensify capital inflows into dollar assets after a strong US Q2 GDP report (+2.4% q/q). The British economy remains close to stagnation: the services PMI fell to 49.8, indicating shrinking orders and wage pressure.
Political risks also weigh on the pound: the ruling party's parliamentary majority shrank after unscheduled by-elections, complicating the government's implementation of fiscal stimulus. Collectively, this increases the attractiveness of selling the pair ahead of the Fed meeting, where markets price in a possible rate hike by year-end.
Trade recommendation: SELL 1.34250, SL 1.34450, TP 1.33250

USOIL Analysis : MMC Bullish Setup Building on USOIL – Target🧠 Introduction & Trade Philosophy
In today’s 4H USOIL chart analysis, we are at a critical decision-making zone, where price action is preparing to make a major move in either direction, based on the response to a central demand zone. We are applying the MMC Rule, which emphasizes mirroring supply-demand behavior and validating market moves through structural confirmation.
The current price structure presents a classic MMC scenario, where price must either confirm a bullish double demand reaction or invalidate the setup by breaking the key zone and moving bearish.
📍 Chart Structure Explained
🔷 1. Central Reversal Zones (CRZs)
There are two CRZs highlighted:
The upper CRZ around 65.90–66.20, where price was previously rejected.
The lower CRZ, where price is currently consolidating, is around 64.80–65.50.
These zones are liquidity-rich areas where big players react—either by absorbing positions or driving directional moves.
🟢 2. Bullish Scenario – MMC Rule In Play (Path 1)
"If we want it bullish, we want 50% supply and demand will be double according to MMC Rule"
According to MMC, a bullish move must be confirmed by a strong reaction from demand, showing double the pressure of the last bearish move. Here's how that plays out:
Price respects the lower CRZ, bouncing near the 65.00 mark.
If this bounce gains momentum and breaks above the trendline resistance, the first target is the minor resistance at $69.00, followed by the major resistance zone near $70.50–$71.00.
A retest of broken structure, followed by bullish continuation, is expected. This is marked with the white zigzag projection labeled as “1” on the chart.
Watch for a clear higher high formation, which would indicate a shift in structure and validate bullish momentum.
🔻 3. Bearish Scenario – Breakdown Confirmation (Path 2)
"If it breaks, USOIL will go bearish"
If price fails to hold the current demand and closes below $64.80–64.50, it signals that demand has been absorbed, and MMC reversal has failed. In that case:
A clean breakdown below the demand zone will confirm bearish control.
The next downside target becomes $62.00, as labeled “2” on the chart.
The downward move is likely to follow a steep path as marked with the sharp downward trendline extension, especially if supported by volume and news catalysts.
🔄 Mirror Concept Highlight – Ellipse Area
The ellipse shape on the chart marks a previous compression zone followed by a breakout. This area represents an imbalance in supply that led to a sell-off. The MMC principle suggests the market tends to mirror these zones—if that was previous supply, and the current demand zone mirrors its positioning and structure, we can anticipate a similar reaction, but to the upside.
This is where the "50% double reaction" rule comes in—demand needs to show twice the strength to overcome the previous sell-side pressure.
🔧 Technical Levels Summary
Zone Type Price Range Notes
Major Resistance 70.50 – 71.00 Final target if bullish scenario plays out
Minor Resistance 68.80 – 69.20 First bullish checkpoint
Upper CRZ 65.90 – 66.20 Key structure to break for bulls
Lower CRZ (Support) 64.80 – 65.50 Demand base for bullish setup
Bearish Target Zone 62.00 – 61.80 Projected zone if support breaks
🧭 Trader’s Mindset & Risk Notes (MMC Style)
Wait for clear confirmation and price behavior near the CRZs before entering.
Use trendline breaks, candlestick confirmation, and volume to validate direction.
Avoid guessing the direction—let price tell the story.
Stick to MMC rules: No confirmation, no position.
✅ Bullish Criteria Checklist:
✔️ Price respects lower CRZ
✔️ Breakout above trendline
✔️ Closes above $66.20
✔️ Higher highs + strong bullish candles
✔️ MMC Double Demand Reaction Confirmed
❌ Bearish Breakdown Triggers:
❌ Breaks below $64.50
❌ Weak bounce + lower highs
❌ Volume increases on downside
❌ Clean breakdown structure
🚀 Trade Plan & Outlook
We’re now at a critical zone where market sentiment will soon be clear. Based on your MMC analysis, the bias remains bullish as long as price holds above $64.80. Be patient and let the setup complete with structure confirmation.
This is not just a technical play—it's a psychological zone, where institutional traders also make decisions. Follow the MMC logic and react with confirmation.

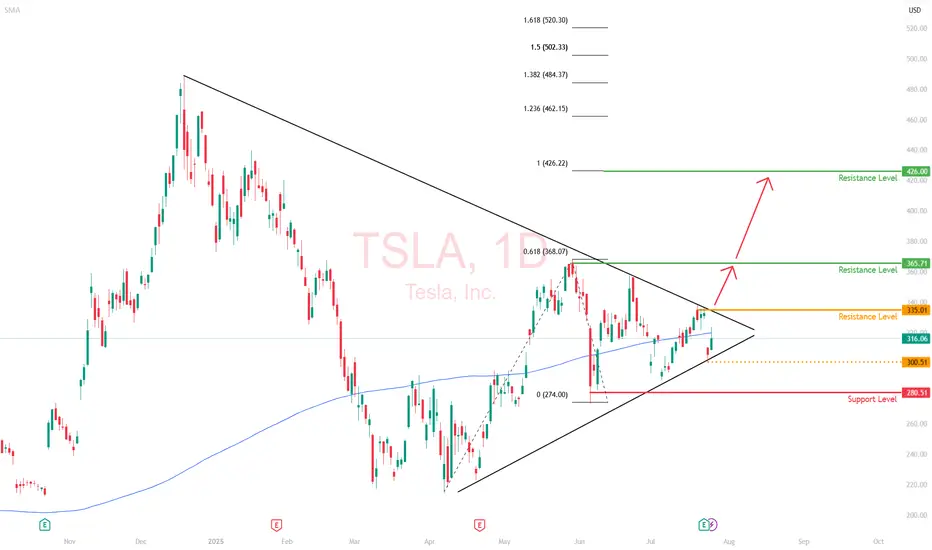
Tesla (TSLA) | Short-Term Compression, Long-Term ExTesla’s daily chart is coiled, with price currently trading at $316, sitting along the 200-day moving average. This looks like a consolidation phase with significant moves building up.
Price Action Snapshot
TSLA sold off last week, rejecting the $335 resistance level before finding footing around $300. The previous range of $280 and $365 is now tightening.
Immediate resistance sits at $335 with a clean breakout above that zone likely triggering momentum back toward the upper range of $365.
The recent drop does not seem like a capitulation move; it's likely institutional redistribution. Smart money is repositioning, not exiting.
Market Is Focused on the Wrong Data
Tesla’s Q2 earnings were objectively weak. Revenue fell 12%, deliveries dropped, and operating margins got clipped.
But this correction isn't all about fundamentals. It is about the market adjusting to a company evolving beyond traditional valuation models.
While most investors are trying to value Tesla like a car company, it’s spending this entire phase retooling itself into an AI and autonomy-first enterprise. That transition doesn't show up in EPS yet (but it will).
The Bigger Picture is Being Missed
The robotaxi rollout in Austin is live. Expansion into California, Phoenix, and Florida is on the roadmap.
Tesla is building a vertically integrated, owner-driven ride-hailing model that could eventually bypass both Uber and legacy OEMs entirely.
Optimus is no longer a lab prototype—it’s moving toward scalable production by 2026.
If Tesla even partially succeeds in general-purpose robotics, it will unlock a Technology Acceptance Model (TAM) that dwarfs the current EV narrative .
Daily Technical Outlook
We’re currently in a bullish compression, with higher lows forming against the resistance area of $365. If $280 holds and the price continues to grind within this wedge, it sets up a volatility breakout scenario.
The breakout level to watch is $335. A daily close above that reopens $365. And beyond that, the resistance level is at $426.
My View
Tesla is compressing, both in price and narrative.
The long game is quietly coming into focus, where the risk/reward skews asymmetrically in favor of the upside.
This daily compression won’t last forever, and when it resolves, the move will likely be outsized.
USD/JPY(20250728)Today's AnalysisMarket news:
Trump announced that the US and Europe reached a trade agreement: 15% tariffs on the EU, $600 billion in investment in the US, zero tariffs on the US by EU countries, the EU will purchase US military equipment, and will purchase US energy products worth $750 billion. However, the US and Europe have different opinions on whether the 15% tariff agreement covers medicines and steel and aluminum. Von der Leyen: 15% tariff rate is the best result that the European Commission can achieve.
US Secretary of Commerce: The deadline for tariff increase on August 1 will not be extended. The United States will determine the tariff policy on chips within two weeks.
Technical analysis:
Today's buying and selling boundaries:
147.47
Support and resistance levels:
148.58
148.17
147.90
147.04
146.77
146.35
Trading strategy:
If the price breaks through 147.90, consider buying, the first target price is 148.17
If the price breaks through 147.47, consider selling, the first target price is 147.04

GBP/CAD - H4 - Bearish Flag (26.07.2025)The GBP/CAD Pair on the H4 timeframe presents a Potential Selling Opportunity due to a recent Formation of a Bearish Flag Pattern. This suggests a shift in momentum towards the downside in the coming Days.
Possible Short Trade:
Entry: Consider Entering A Short Position around Trendline Of The Pattern.
Target Levels:
1st Support – 1.8242
2nd Support – 1.8139
🎁 Please hit the like button and
🎁 Leave a comment to support for My Post !
Your likes and comments are incredibly motivating and will encourage me to share more analysis with you.
Best Regards, KABHI_TA_TRADING
Thank you.
Disclosure: I am part of Trade Nation's Influencer program and receive a monthly fee for using their TradingView charts in my analysis.

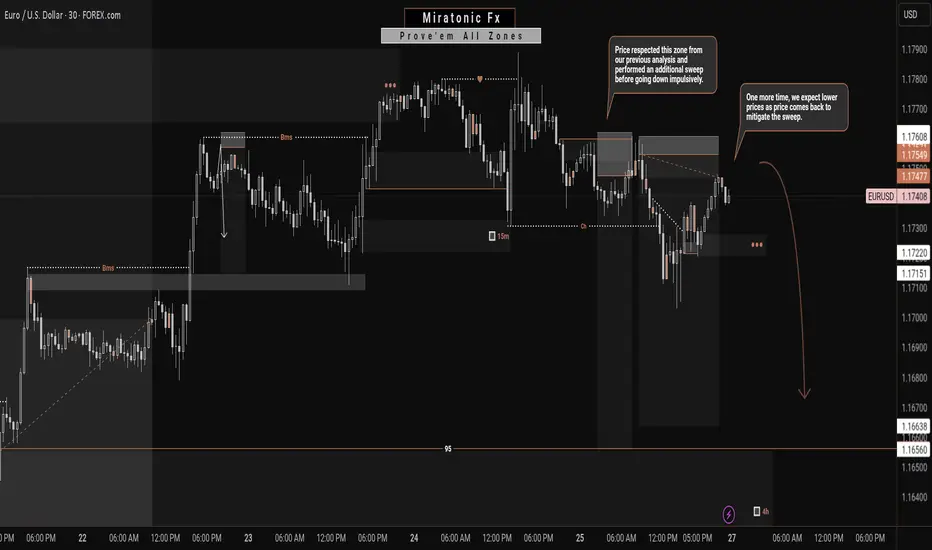
EURUSD: A Bearish Continuation?From my previous analysis, we anticipated a short-term decline on the EURUSD for a Daily bearish pullback. Price respected our zone and made a even stronger sweep before plummeting as forecasted.
Currently, price has returned to mitigate that liquidity sweep. Given the prior impulsive bearish move—which this current bullish correction stems from—we expect another drop, targeting the weak structure below for a potential liquidity grab or continuation.
We'll continue to monitor how price behaves around the current levels, but unless there's a significant shift in momentum, our bearish outlook remains valid. ✅
Follow us for more updates. 🔔
See you on the next one. 🫡
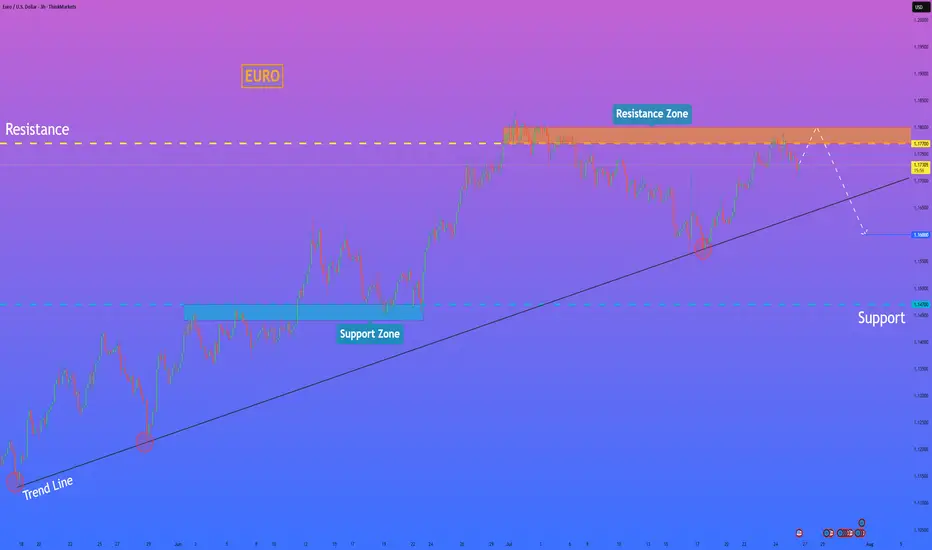
HelenP. I Euro can reach resistance zone and then dropHi folks today I'm prepared for you Euro analytics. If we look at the chart, we can observe a mature uptrend that has been supported by a major ascending trend line for an extended period. However, the momentum of this trend appears to be waning, as evidenced by the price's recent failure to establish new highs. The asset is currently trading below the critical resistance zone of 1.1770 - 1.1800, an area that has proven to be a significant barrier for buyers. My analysis for a short position is based on the condition of a final retest of this resistance zone. I believe the price will make another attempt to rally into this area, and a forceful rejection from this zone would serve as the confirmation that sellers are taking definitive control of the market. Such a rejection would likely initiate a strong downward impulse with sufficient momentum to break the long-standing ascending trend line, a pivotal event that would shift the market structure. Therefore, the primary goal for this bearish scenario is set at the 1.1600 level, a logical target for the price to reach after such a significant structural break. If you like my analytics you may support me with your like/comment ❤️
Disclaimer: As part of ThinkMarkets’ Influencer Program, I am sponsored to share and publish their charts in my analysis.
TON/USDT - Bullish Channel in H4 (27.07.2025)The TON/USDT pair on the H4 timeframe presents a Potential Buying Opportunity due to a recent Formation of a Bullish Channel Pattern. This suggests a shift in momentum towards the upside and a higher likelihood of further advances in the coming Days.
Possible Long Trade:
Entry: Consider Entering A Long Position around Trendline Of The Pattern.
Target Levels:
1st Resistance – 3.770
2nd Resistance – 3.989
🎁 Please hit the like button and
🎁 Leave a comment to support for My Post !
Your likes and comments are incredibly motivating and will encourage me to share more analysis with you.
Best Regards, KABHI_TA_TRADING
Thank you.

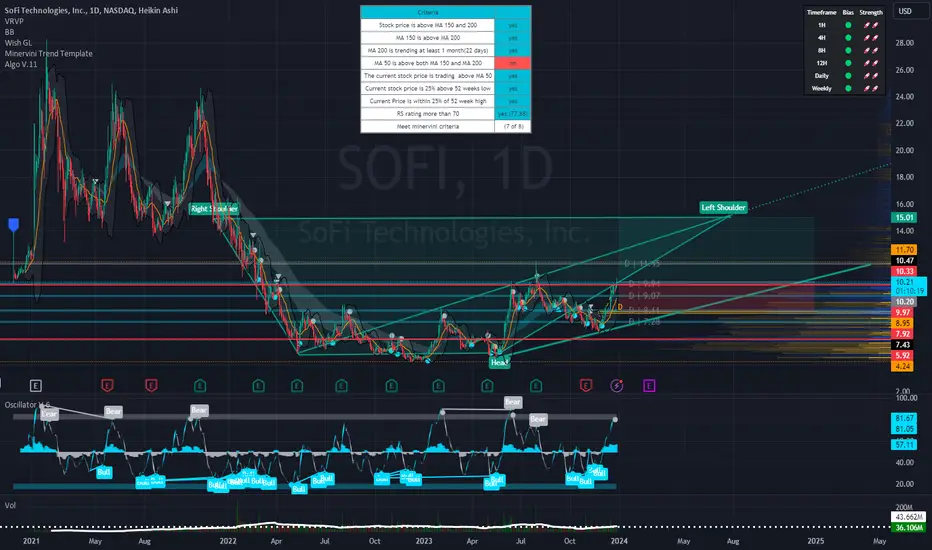
SoFi's Surge: Unveiling 2023 and What Lies Ahead in 2024Technical Analysis Overview
Current Price : $10.34, a 3.77% increase.
Weekly Trend : Showing a positive trend with a 5.35% increase over the last five days.
1-Month Trend : A significant increase of 51.96%, indicating strong bullish sentiment.
6-Month and Yearly Trends : A 17.04% increase over the last six months and a 124.51% increase year to date, highlighting a robust bullish trend.
Advanced Technical Indicators
Relative Strength Index (RSI) : 70.41 - Indicating that SOFI is nearing overbought territory, which could lead to a potential reversal or consolidation in the short term.
Moving Average Convergence Divergence (MACD) : 0.63 - Suggesting bullish momentum, indicating a strong buying trend.
Other Indicators : STOCH (83.28), STOCHRSI (84.02), ADX (37.09), Williams %R (-8.57), CCI (104.63), ATR (0.46), Ultimate Oscillator (54.76), and ROC (24.66) all contribute to a picture of current bullish momentum but with potential for short-term volatility or pullback.
Market Sentiment and External Factors
Market Capitalization : $9.904B USD.
Trading Volume Analysis : A high trading volume of 35,199,288, suggesting active market participation and interest in the stock.
Recent News Coverage Impacting SOFI
Bullish Outlook for 2024 : Analysts predict SOFI stock could continue its rally in the new year, benefiting from expected interest-rate cuts. A notable analyst has set a high price target of $14 for SOFI stock, implying significant upside potential ( InvestorPlace ).
Focus on Non-Lending Businesses : Analysts appreciate SoFi's shift towards non-lending businesses, improving earnings quality despite a higher-for-longer interest-rate policy.
Central Bank Policy Changes : Potential interest rate cuts in 2024 could benefit SoFi's lending business, as lower rates tend to spur borrowing and lending activity.
Conclusion
SOFI's stock shows strong bullish signs in the medium to long term, but the current overbought condition warrants caution for short-term traders.
The recent news and analyst predictions provide a positive outlook for 2024, making SOFI an interesting stock for both traders and long-term investors.
Gold setup for coming week.Hi everyone
This is our setup going into the last week of July trading week.
We could possibly see market retest the 3321-3324 zone & make its way back up to 3347 area, this will also be an area to be monitored for possible break out that will lead back to 3362.
We are looking to get a possible downward pressure from 3345 area to 3303.
Let always look at what market presents & bag potential profits at pivitol areas.
Have a good weekend & good trading week coming up

HIFI / USDT in consolidation zone heading to break through itHIFI/USDT Analysis:
HIFI/USDT is currently in a consolidation zone and seems to be heading towards a potential breakout. If it breaks through this zone, we could see a good move towards $0.14 soon, assuming the market remains stable.
Bullish Scenario:
Breakout above consolidation zone could trigger a strong move towards $0.14.
Confirmation: Watch for strong volume during the breakout to ensure the move is genuine.
Bearish Scenario:
Failure to Breakout: If the price fails to break through and stays within the consolidation, the setup might remain invalid.
Note:
Current market situation is not looking very strong right now. I hope the correction happens smoothly soon, but if the market remains unstable, this setup could become invalid. Always manage your risk and stay cautious.

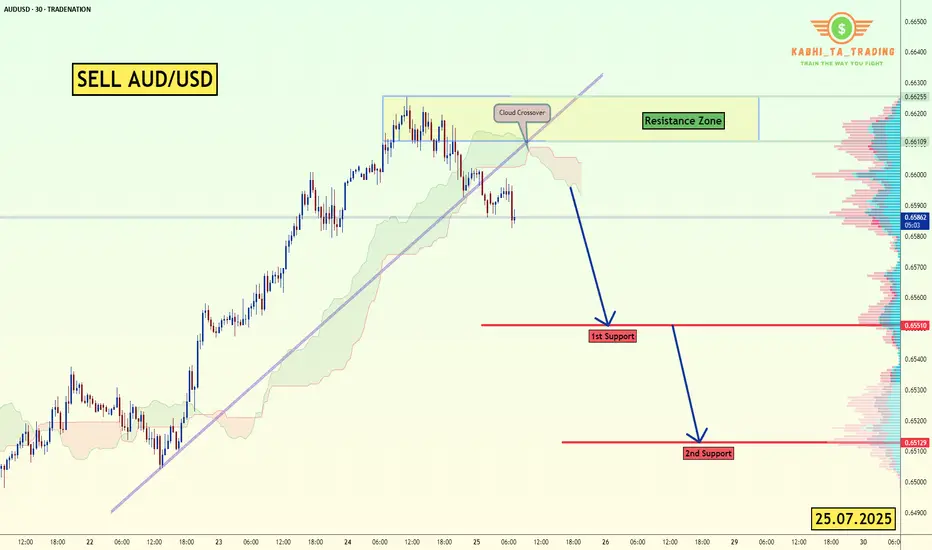
AUD/USD - Breakout (25.07.2025)The AUD/USD Pair on the M30 timeframe presents a Potential Selling Opportunity due to a recent Formation of a Trendline Pattern. This suggests a shift in momentum towards the downside in the coming hours.
Possible Short Trade:
Entry: Consider Entering A Short Position around Trendline Of The Pattern.
Target Levels:
1st Support – 0.6551
2nd Support – 0.6513
🎁 Please hit the like button and
🎁 Leave a comment to support for My Post !
Your likes and comments are incredibly motivating and will encourage me to share more analysis with you.
Best Regards, KABHI_TA_TRADING
Thank you.
Disclosure: I am part of Trade Nation's Influencer program and receive a monthly fee for using their TradingView charts in my analysis.