Understanding Market Structure: GBPJPY Trendline Support 📊 GBPJPY Technical Analysis — 15-Min Chart (As of July 24, 2025)
Trend Structure & Price Action
The chart shows a clear ascending trendline, connecting higher lows across the last sessions.
Multiple Break of Structure (BOS) points confirm bullish market behavior, with price consistently forming higher highs and higher lows.
The most recent BOS and price rejection from the lower boundary of the cloud band indicate bullish intent is still active.
Indicators Used
Custom Cloud Band (EMA Based 20, 1.5 settings):
Price is oscillating within and around the cloud band.
Recent candles are attempting to reclaim the upper band, suggesting building bullish momentum.
Volume Profile (VRVP) shows strong volume support around the 198.200–198.500 range, aligning with the trendline.
Support & Resistance
Support Zone: 198.200 (trendline confluence + volume shelf)
Immediate Resistance: 198.800–199.000
Major Resistance: 199.400 (next psychological level and prior high)
Forecast & Trade Idea (Educational Purpose)
If price continues to respect the ascending trendline and breaks above the recent local high (~198.750), we could see a bullish breakout toward 199.200+.
A bullish flag or small consolidation above the trendline before breakout is likely, as illustrated by the arrow.
Invalidation occurs if price breaks and closes below the trendline and 198.200, which may trigger a short-term correction.
✅ Conclusion
GBPJPY is currently in a bullish market structure with support from both trendline and volume profile. A clean breakout above 198.800 with volume confirmation could fuel continuation toward 199.200 and beyond. Risk management is crucial — watch for false breakouts or a shift in structure below the rising trendline.
Analysis

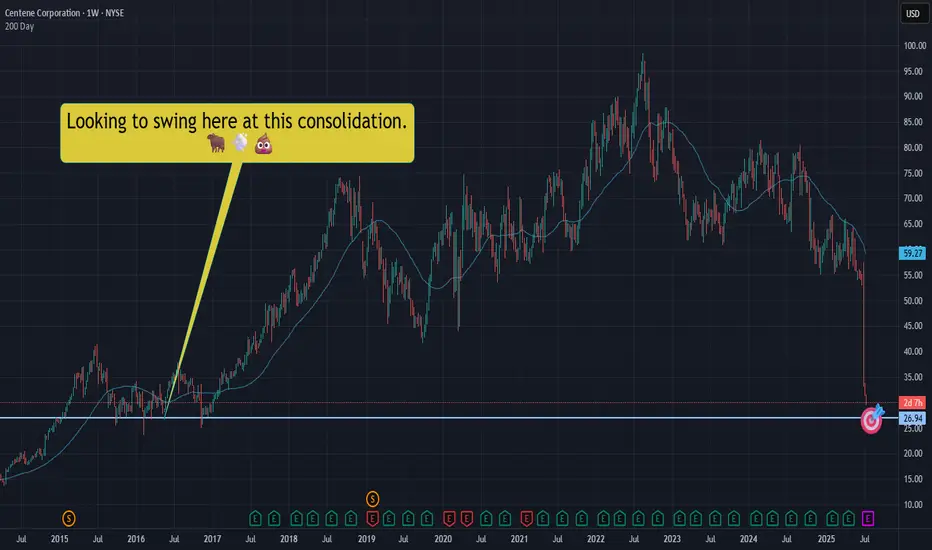
CNC|Let's take a swing at a falling dagger! NYSE:CNC slicing through the void, well.... like a falling dagger through a void.
Not trying to catch this bad boi, but we should expect a bounce at some point. Let's swing for a bounce in that $26.90ish area.
This is NOT a YOLO and I hope it's not an "oh no!" Let's keep our wits about us - starter position only. We can add if we need to, but let's just hope we sell and make some quick Christmas money.
THANK YOU FOR YOUR ATTENTION ON THIS MATTER
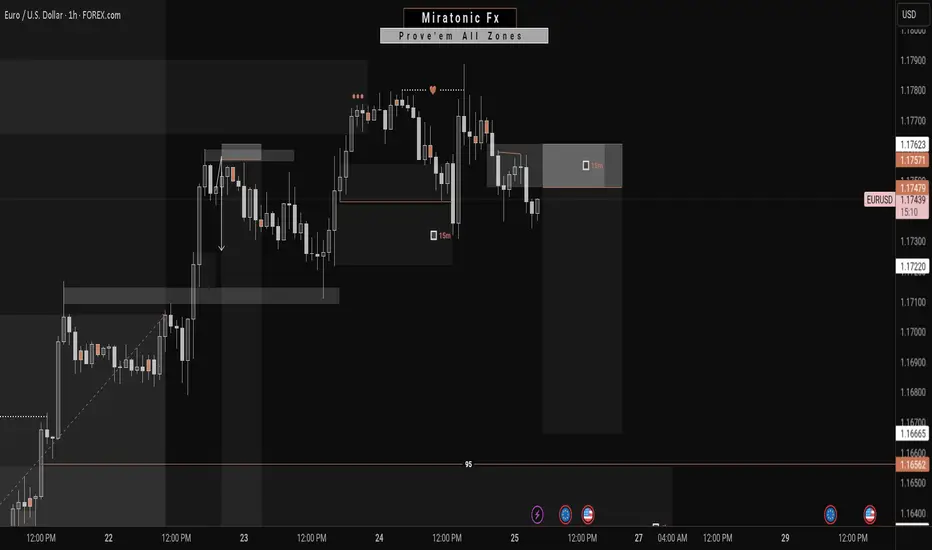
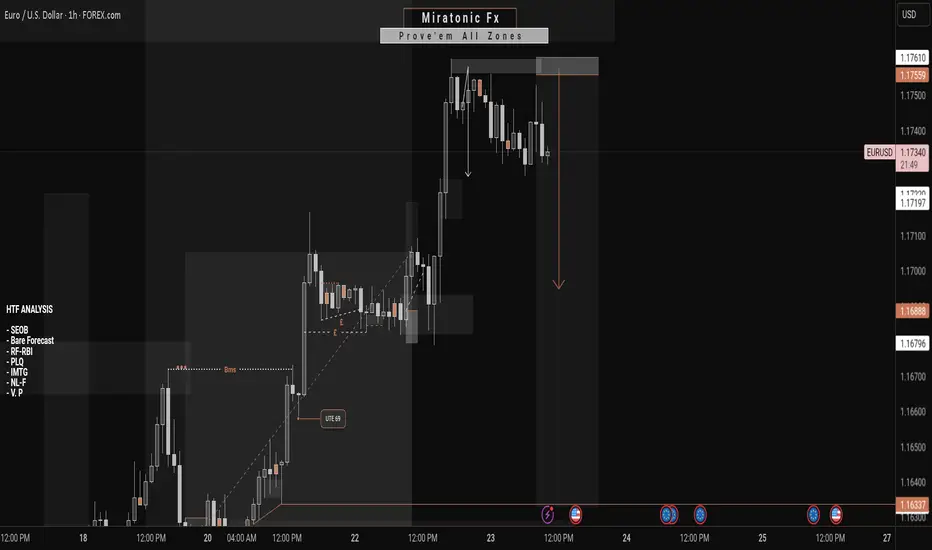
EURUSD | Time For A Pullback?The week kicked off with strong impulsive moves to the upside, leaving no room for deeper correction. Then slowly from Wednesday, we started to see a decline in strength in the bullish run.
Now, with price edging toward the next swing low for a possible bearish change of character, is this a good way to ride the stream to the downside?
Keep your A-game on as we watch price unfold, and trade reactively to price movement.
Do not forget to guard your capitals with risk management.
Good luck traders. 👍
Follow me for more and more of these analyses.
See you on the next one. 🫡
SYRUPUSDT 4H Chart Analysis | Trendline Breakout & Next MovesSYRUPUSDT 4H Chart Analysis | Trendline Breakout & Next Moves
🔍 Let’s break down the latest action on the SYRUP/USDT 4H chart and pinpoint what comes next as trend and momentum cues line up for traders.
⏳ 4-Hour Overview
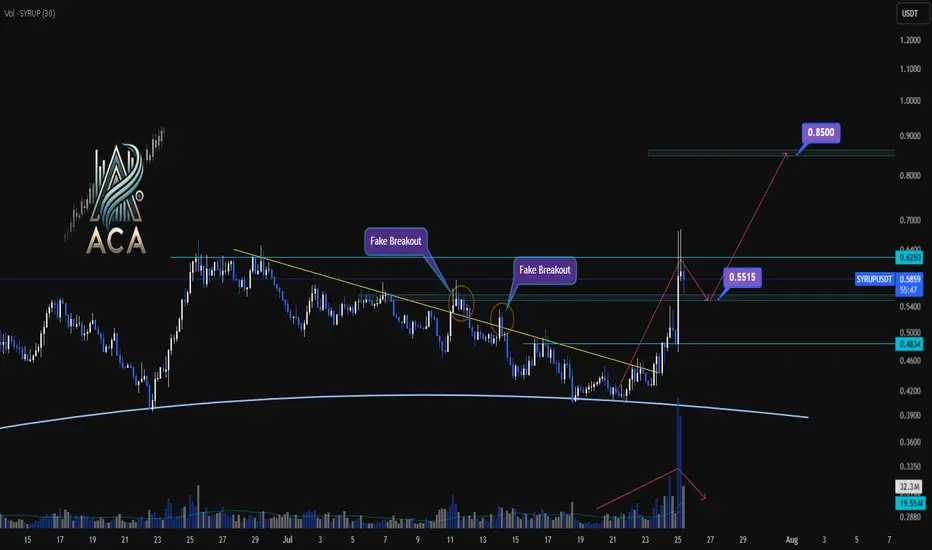
- The recent breakout above the key trendline was backed by a surge in volume, providing clear momentum confirmation and pushing price toward resistance.
- Price has already reached 1.5R of the initial breakout target, a strong sign the trend is in motion.
- Upon touching the $0.6250 resistance, momentum cooled, with volatility decreasing — a classic consolidation phase after a high-energy move.
🔻 Correction & Structure
- With volume subsiding and momentum slowing post-$0.6250, we’re now expecting a corrective move down toward $0.5515.
- This retracement zone will be critical to watch for higher low formation – a bullish structural signal if supported by volume confirmation.
🔺 Long Setup:
- Should SYRUP reclaim and break above $0.6250 after setting a higher low at $0.5515, and with renewed volume, we could see another strong leg higher.
- The next major resistance sits around $0.85 — this aligns as a logical upside target based on the range extension.
📊 Key Highlights:
- Trendline breakout with sharp volume spike = momentum confirmation.
- 1.5R reached before first deep pullback; structure remains bullish above $0.5515.
- Watch for a higher low and subsequent break of $0.6250 with volume to confirm the next move to $0.85.
🚨 Conclusion:
SYRUP’s chart is at a pivotal juncture: a constructive pullback to $0.5515 could set up the next wave higher if supported by volume. A confirmed breakout above $0.6250 targets $0.85 — stay patient and wait for volume signals at key levels.
Fundamental Market Analysis for July 25, 2025 EURUSDThe euro remains under pressure as the bond yield gap is once again widening in favor of the dollar following comments from Fed Chair Powell about the need to “keep policy tight for longer” to counteract the inflationary effects of new US tariffs. Additional support for the dollar came from the increase in June retail sales and a decline in jobless claims, which confirms the resilience of the US economy and pushes expectations for the first rate cut toward the year-end.
From the European side, euro support is undermined by signs of slowing activity: the GfK consumer confidence index in Germany remains below its historical average, and preliminary July eurozone PMIs, despite some improvement, still indicate an uneven recovery of the real sector. Further pressure comes from ongoing uncertainty around EU–US trade talks; Washington is still discussing the possibility of 15% tariffs, which threatens the bloc’s export prospects and fuels demand for the safe-haven dollar.
With monetary policy divergence and tariff escalation risks persisting, the pair is likely to continue correcting toward 1.17. Investors are awaiting tomorrow’s US PCE data, which could reinforce expectations of the Fed maintaining a “hawkish” stance and cement the downward trend.
Trade recommendation: SELL 1.17350, SL 1.17550, TP 1.16350
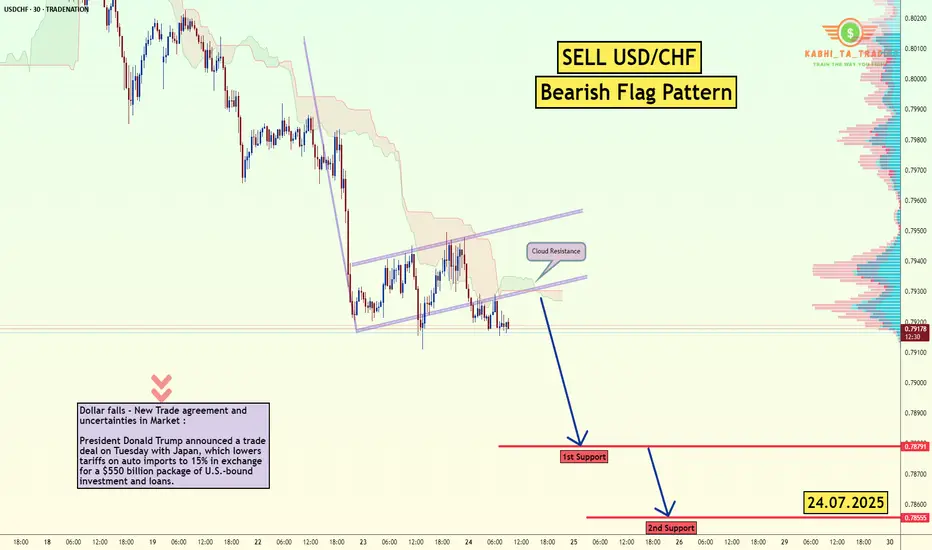
USD/CHF - Bearish Flag (24.07.2025)Fundamental Updates :
Dollar falls - New Trade agreement and uncertainties in Market :
President Donald Trump announced a trade deal on Tuesday with Japan, which lowers tariffs on auto imports to 15% in exchange for a $550 billion package of U.S.-bound investment and loans.
The USD/CHF Pair on the M30 timeframe presents a Potential Selling Opportunity due to a recent Formation of a Bearish Flag Pattern. This suggests a shift in momentum towards the downside in the coming hours.
Possible Short Trade:
Entry: Consider Entering A Short Position around Trendline Of The Pattern.
Target Levels:
1st Support – 0.7878
2nd Support – 0.7855
🎁 Please hit the like button and
🎁 Leave a comment to support for My Post !
Your likes and comments are incredibly motivating and will encourage me to share more analysis with you.
Best Regards, KABHI_TA_TRADING
Thank you.
Disclosure: I am part of Trade Nation's Influencer program and receive a monthly fee for using their TradingView charts in my analysis.
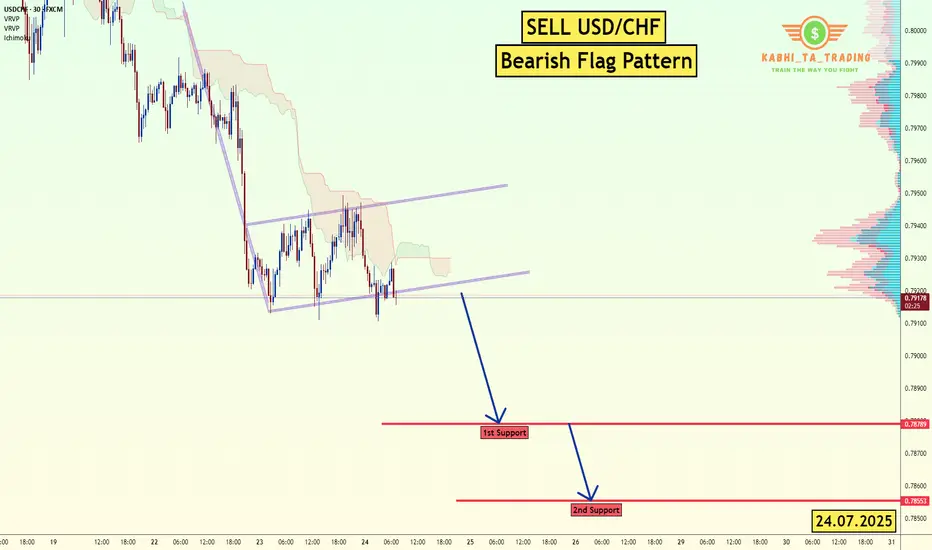
USD/CHF - Bearish Flag (24.07.2025)The USD/CHF Pair on the M30 timeframe presents a Potential Selling Opportunity due to a recent Formation of a Bearish Flag Pattern. This suggests a shift in momentum towards the downside in the coming hours.
Possible Short Trade:
Entry: Consider Entering A Short Position around Trendline Of The Pattern.
Target Levels:
1st Support – 0.7878
2nd Support – 0.7855
🎁 Please hit the like button and
🎁 Leave a comment to support for My Post !
Your likes and comments are incredibly motivating and will encourage me to share more analysis with you.
Best Regards, KABHI_TA_TRADING
Thank you.
Disclosure: I am part of Trade Nation's Influencer program and receive a monthly fee for using their TradingView charts in my analysis.
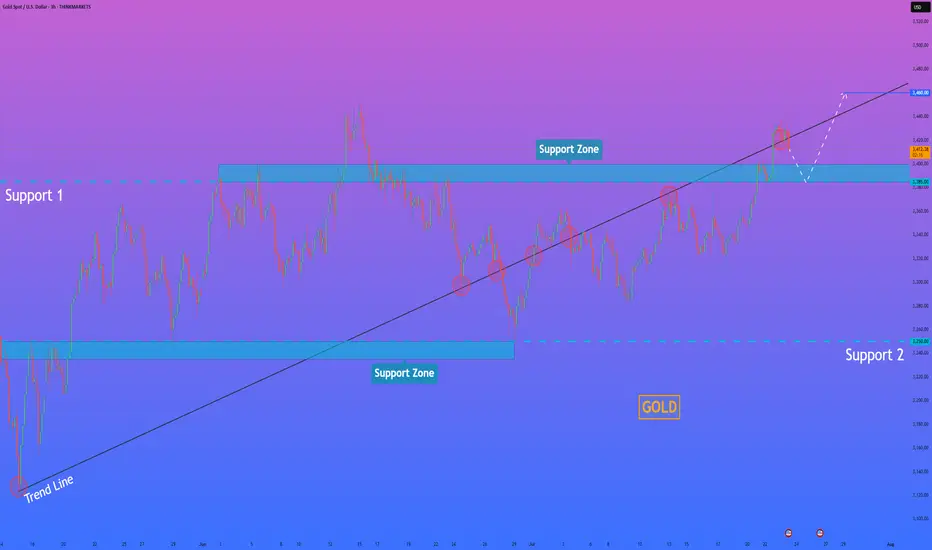
GOLD - Price can make correction and then bounce upHi guys, this is my overview for XAUUSD, feel free to check it and write your feedback in comments👊
The price has been developing within a broadening wedge formation for some time.
This pattern began after the asset found strong support in the key zone around the $3305 level.
Within this structure, buyers recently pushed the price upwards in a notable impulse wave.
This impulse culminated in a test of the wedge's upper boundary and the resistance area near $3430.
After being rejected from that resistance, the price is now in a corrective decline towards the lower trendline.
I expect that this correction will find its footing on the lower boundary, leading to a rebound and a new rally towards the $3430 resistance.
If this post is useful to you, you can support me with like/boost and advice in comments❤️
Disclaimer: As part of ThinkMarkets’ Influencer Program, I am sponsored to share and publish their charts in my analysis.

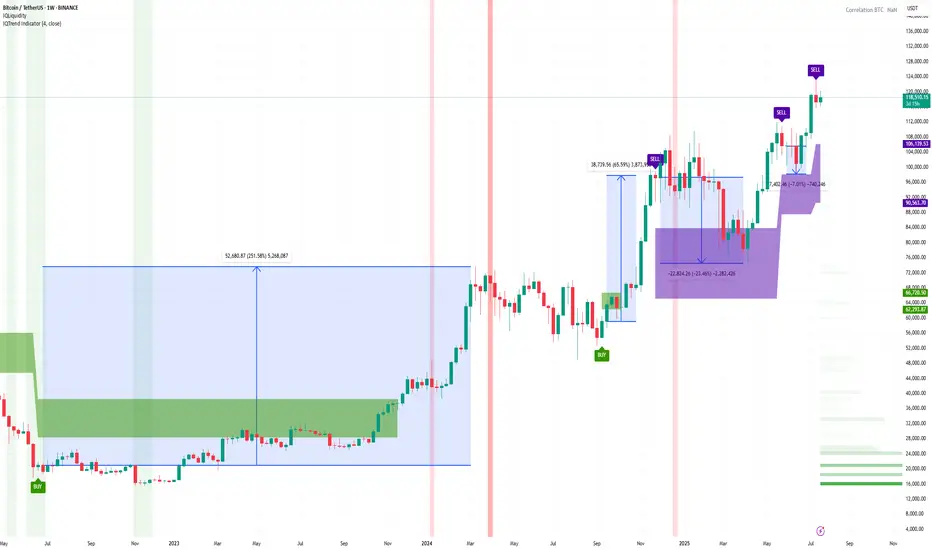
Sell Signal on Bitcoin (1-week timeframe)The IQTrend indicator shows a Sell signal on the weekly timeframe for BINANCE:BTCUSDT .
I also noted the percentage of movement after previous signals so that you understand the seriousness of the situation.
Of course, this time it may be a little different, but I think it's worth keeping this signal in mind anyway.
DYOR
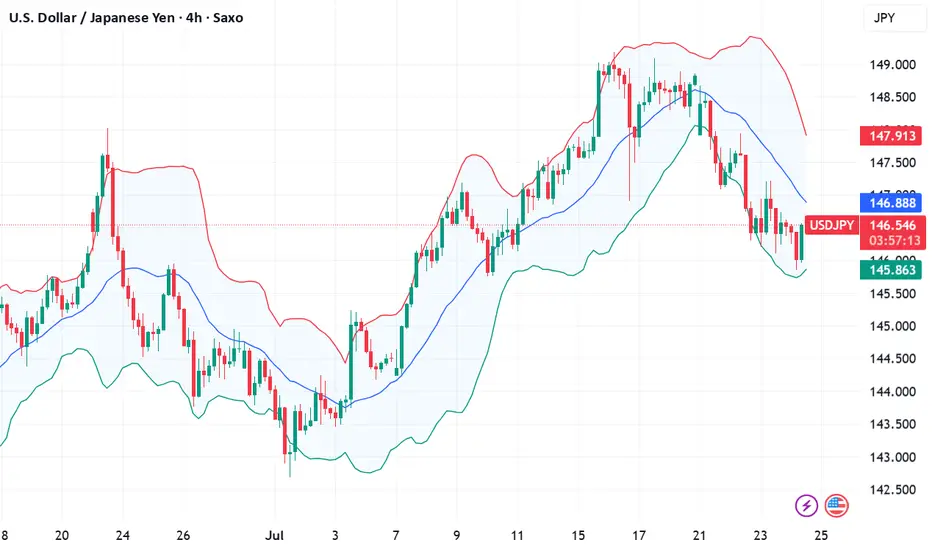
Fundamental Market Analysis for July 24, 2025 USDJPYThe Japanese yen (JPY) strengthened against its US counterpart for the fourth consecutive day and reached a nearly three-week high during Asian trading on Thursday. The recently announced trade deal between Japan and the US reduces economic uncertainty and increases the likelihood that the Bank of Japan (BoJ) will resume its tightening cycle at the end of this year, which in turn is seen as a key factor continuing to support the JPY. The US dollar (USD), on the other hand, is languishing near two-and-a-half-week lows and is putting additional pressure on the USD/JPY pair.
However, domestic political uncertainty and disappointing data on Japan's manufacturing PMI may keep yen bulls from aggressive bets. Moreover, the optimistic market sentiment should help limit the safe-haven yen's gains and further losses for the USD/JPY pair. Traders are now eagerly awaiting the release of US flash PMI indices to take advantage of short-term opportunities later in the North American session. However, the mixed fundamental backdrop calls for caution before making aggressive directional bets.
Trade recommendation: SELL 146.00, SL 147.10, TP 145.00
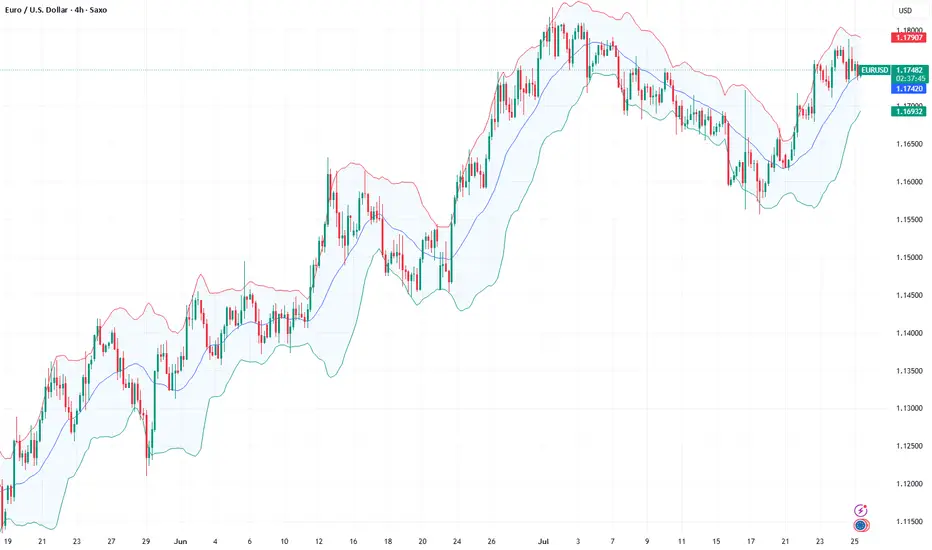
What's Next On EURUSDPrice currently leans toward a bearish pullback after a series of impulsive bullish moves. So far, we haven’t seen any significant retracement since the rally began. As we anticipate a potential correction, could this be the awaited moment for the bears to step in—especially with only weaker structures left behind and bearish pressure building?
Regardless, every market scenario demands discipline and proper risk management.
Thinking of taking this outlook? Be sure to wait for strong confirmation before jumping in.
Good luck, traders, as we watch price unfold.
👉 Follow for more updates. See you in the next one 😉.
USD/JPY(20250724)Today's AnalysisMarket news:
U.S. President Trump continued to lash out at the Federal Reserve on Tuesday, but seemed to back off from the remaining plan to fire Chairman Powell. "I think he's doing a bad job, but he's going to be out of office soon anyway," Trump said in an exchange with reporters at the White House. "In eight months, he'll be out of office."
Technical analysis:
Today's buying and selling boundaries:
146.60
Support and resistance levels:
147.70
147.29
147.02
146.18
145.92
145.51
Trading strategy:
If the price breaks through 146.60, consider buying in, with the first target price at 147.02
If the price breaks through 146.18, consider selling in, with the first target price at 145.92

HelenP I. Gold, after small correction, can continue to move upHi folks today I'm prepared for you Gold analytics. If we look at the chart, the dominant feature is a strong, sustained bullish trend defined by a major ascending trend line that has repeatedly served as a reliable foundation for the price, confirming that buyers currently maintain firm control. At present, the price action is consolidating above a crucial horizontal pivot area, the support zone between 3385 and 3400. The significance of this zone is high, as it's a classic polarity point where previous resistance has flipped to become support, suggesting a concentration of buying interest. My core analysis hinges on the scenario of a brief, healthy corrective move down to retest this support zone. I believe this retest is a key market dynamic to confirm buyers' commitment. If the price dips into the 3385-3400 area and is met with a decisive rejection of lower prices, it would provide a powerful signal that the underlying bullish sentiment remains fully intact. A successful defense of this zone would be the primary trigger, creating the momentum for the next upward leg. Therefore, I have set the primary goal for this move at the 3460 level. If you like my analytics you may support me with your like/comment.❤️
Disclaimer: As part of ThinkMarkets’ Influencer Program, I am sponsored to share and publish their charts in my analysis.
btc . july . w4 . d3 yesterday was beautiful. dOpen was vorhersehbar. wednesday brings liquidity. the chart might not look like much, but i see movement coming. resistance is obvious, price target is violent.
KO: Coca-Cola (CFD) Earnings 23-07-2025Yesterday we have the Coca-Cola earnings report came out and beat on both earning and revenue. But due to the technical position I do not see it a good entry on the stock CFD, still see PepsiCo stock CFD is a better option.
Disclaimer: This content is NOT a financial advise, it is for educational purpose only.

Fundamental Market Analysis for July 23, 2025 GBPUSDSterling is struggling to hold above 1.35 as fundamentals tilt against it. US CPI has accelerated to 2.7 % y/y, reinforcing expectations that the Fed will delay its easing cycle, whereas in the UK subdued GDP growth and a cooling labour market have revived talk of a Bank of England rate cut as early as August.
Political noise adds to the pressure: London must balance the US’s hard‑line trade stance with the need to mend ties with the EU, heightening uncertainty for businesses. Meanwhile, capital is flowing toward higher‑yielding US Treasuries, sapping demand for UK assets.
The situation is compounded by Britain’s persistent current‑account deficit, which—amid a stronger dollar—requires ever‑higher risk premia to finance. All told, short positions in cable with a tight stop above 1.35750 look attractive in the short run.
Trade recommendation: SELL 1.35250, SL 1.35750, TP 1.34750

VZ: Verizon stock update after earningsVerizon jumped on positive results, which aligned with my bullish view on it.
Tomorrow will have its competitors T-Mobile & AT&T earnings result, this will update us on the industry as well. Most probably that I will go long on it in the next 24Hr.
Disclaimer: This content is NOT a financial advise, it is for educational purpose only.

Fundamental Market Analysis for July 22, 2025 EURUSDThe euro is trading near 1.1700, having retreated from an intraday high of 1.1720 after the release of the final June U.S. CPI figures, which confirmed a slowdown in inflation to 2.7% y/y and 0.1% m/m while keeping the core reading steady at 3.1%. The brief rise in risk appetite quickly gave way to stronger demand for the dollar as the probability of the Fed’s first rate cut in September fell from 65% to 55%.
Additional pressure on the euro comes from the yield differential: 10-year U.S. Treasuries hover around 4.45%, while German Bunds yield only 2.30%. The gap of more than 215 bp encourages capital to flow from the eurozone into dollar assets, supporting USD demand.
Fundamentally, risks for the euro remain tilted to the downside: after June’s rate cut the ECB said further moves depend on price dynamics, and the eurozone composite PMI dropped to 50.1 – the brink of stagnation. Against the backdrop of weak continental activity and moderate yet persistent U.S. inflation, the pair may test support at 1.1615 in the coming sessions, especially if U.S. durable-goods orders exceed forecasts.
Trading recommendation: SELL 1.1700, SL 1.1720, TP 1.1615

ETH: Huge Reversal or Correction Still in the Horizon?The recent price action in Ethereum (ETH) has left market participants questioning its next major move. With volatility high and sentiment shifting, is ETH headed for a massive reversal, or is a correction still looming on the horizon?
Key Points to Consider
Macro Environment: Global markets are facing uncertainty from shifting interest rates and regulatory developments in crypto. These factors may spark continued volatility for ETH in the near term.
Technical Analysis: ETH has many analysts watching key support and resistance areas. A clean break above resistance could signal a reversal, while a failure to hold recent gains may suggest a correction is not over yet.
On-Chain Data: Activity on the Ethereum network, including DeFi usage and staking patterns, can offer clues as to whether accumulation or distribution is taking place.
Market Sentiment: Traders remain divided, with some calling the recent bounce a bull trap, and others anticipating renewed upside momentum.
My Take
While the case for a reversal is gaining strength, the possibility of a broader correction can’t be dismissed. It’s crucial for investors to stay alert, watch the charts, and position size accordingly. I'm not longing any crypto in the short run...As for the long run, extremely BULLISH!
*not investment advice*
#Ethereum #Crypto #Investing #MarketAnalysis #Web3 #crypto #bitcoin #trading

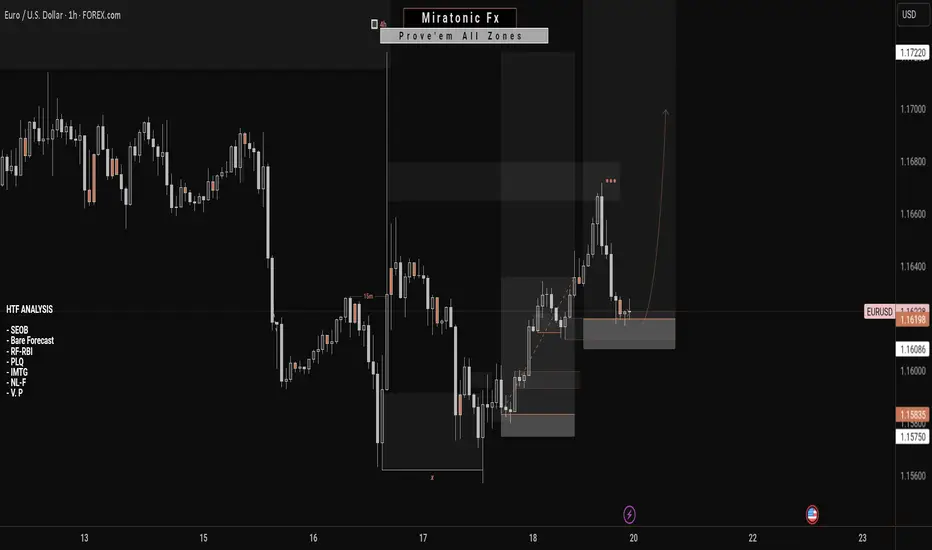
EURUSD Bullish ProjectionIt’s been a while since my last update here.
Here’s my projection and actual entry/entries on EURUSD, based on a sweep of the previous 1H swing low and mitigation of a Daily imbalance (Fair Value Gap).
We're anticipating a full Change of Character to mark the end of the ongoing Daily pullback.
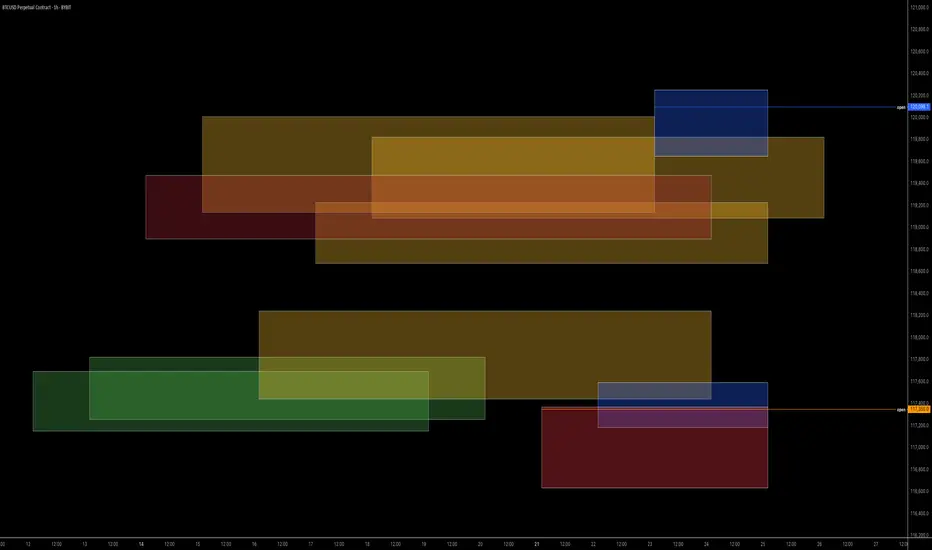
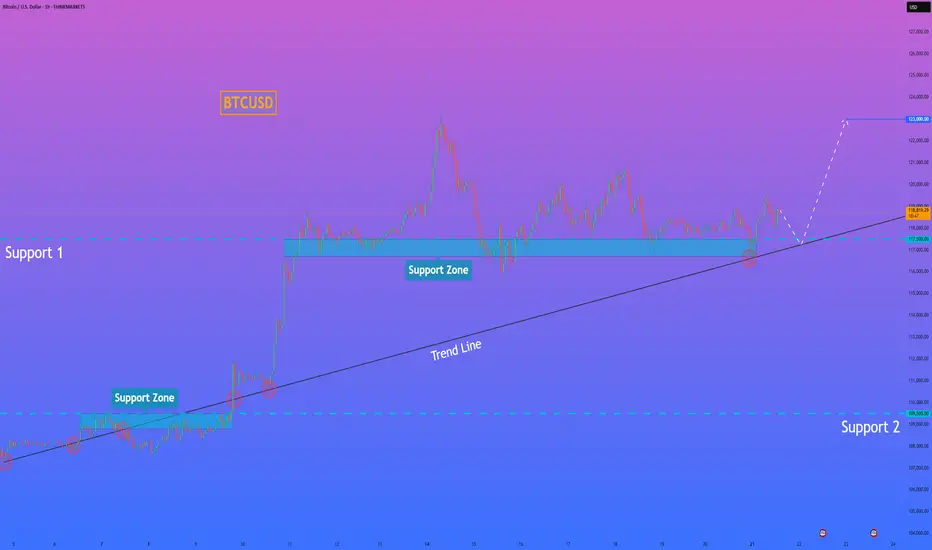
HelenP. I Bitcoin will rebound from trend line and rise to $123KHi folks today I'm prepared for you Bitcoin analytics. If we look at the chart, we can see a very clear and long-term bullish structure. The entire uptrend is supported by a major ascending trend line that has acted as a reliable foundation for the price for a significant amount of time. Currently, the price is consolidating above this crucial trend line and is interacting with the key support zone between 117500 and 116700 points. I believe that the most probable scenario here is a brief corrective move downwards for the price to properly retest the main ascending trend line. This type of retest is often a healthy sign in a strong trend, as it allows for the confirmation of support and gathers momentum for the next leg up. A strong rebound from this trend line would serve as a powerful signal that the buyers are still in control. Therefore, once the price confirms its bounce from this dynamic support, the path should be clear for a continuation of the uptrend. For this reason, my primary goal for this trade idea is set at the 123000 points. If you like my analytics you may support me with your like/comment ❤️
Disclaimer: As part of ThinkMarkets’ Influencer Program, I am sponsored to share and publish their charts in my analysis.
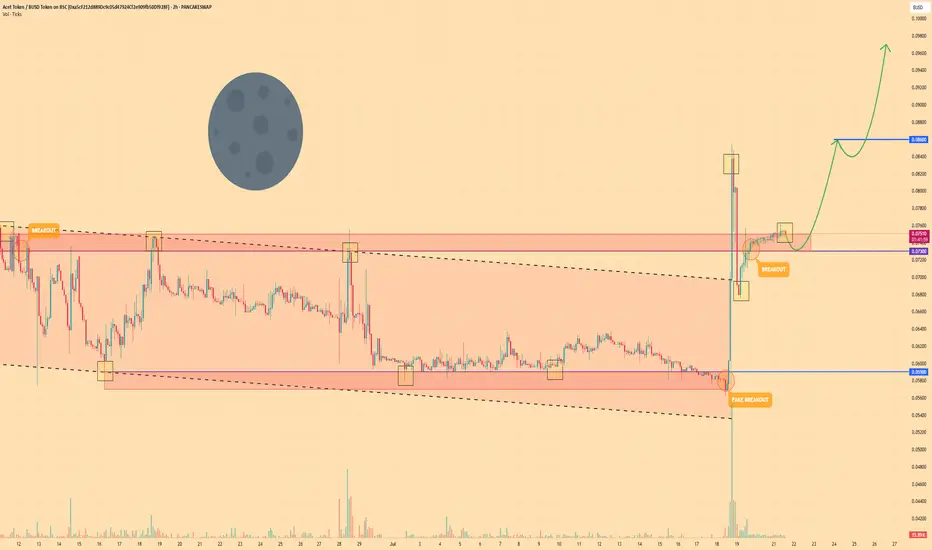
ACT TOKEN - Price can fall to support area and then bounce upHi guys, this is my overview for ACTBUSD, feel free to check it and write your feedback in comments👊
The price was trading within a descending channel for a considerable period.
The asset consistently found support at the lower boundary of this formation, within the 0.0590 - 0.0570 price zone.
Recently, a strong upward impulse allowed the price to break out from the upper boundary of the channel.
Following the breakout, the price executed a corrective move back to the broken resistance line, successfully retesting the 0.0730 - 0.0750 area.
This zone is now acting as a new support level, and the price has begun to move upwards from it, showing renewed buyer strength.
I expect that the asset will continue its growth from this support. My first target is set at the 0.0860 level, with the second target at 0.0970 points.
If this post is useful to you, you can support me with like/boost and advice in comments❤️
Euro may correct a little and then continue to rise in channelHello traders, I want share with you my opinion about Euro. Observing the recent price action, we can map out a clear transition in market structure. Previously, the pair was contained within a well-defined downward channel, where the seller zone around the 1.1760 resistance level consistently capped rallies, leading to multiple breakdowns and correctional movements. However, after a final push lower, the dynamic shifted, with the price action showing a clear downtrend-to-uptrend reversal. Currently, the euro has established a new upward channel, finding solid ground in the buyer zone around the 1.1660 support level. The price is now engaged in a constructive upward movement within the boundaries of this new channel. The prevailing hypothesis is that after a potential minor correction towards the channel's support line, the pair will resume its ascent. Therefore, the take-profit target for this scenario, tp 1, is strategically placed at 1.1710, as this level directly corresponds with the resistance line of the current upward channel, representing a logical point for price to react. Please share this idea with your friends and click Boost 🚀
Disclaimer: As part of ThinkMarkets’ Influencer Program, I am sponsored to share and publish their charts in my analysis.
