EURO - Price can rise a little more and then start to fallHi guys, this is my overview for EURUSD, feel free to check it and write your feedback in comments👊
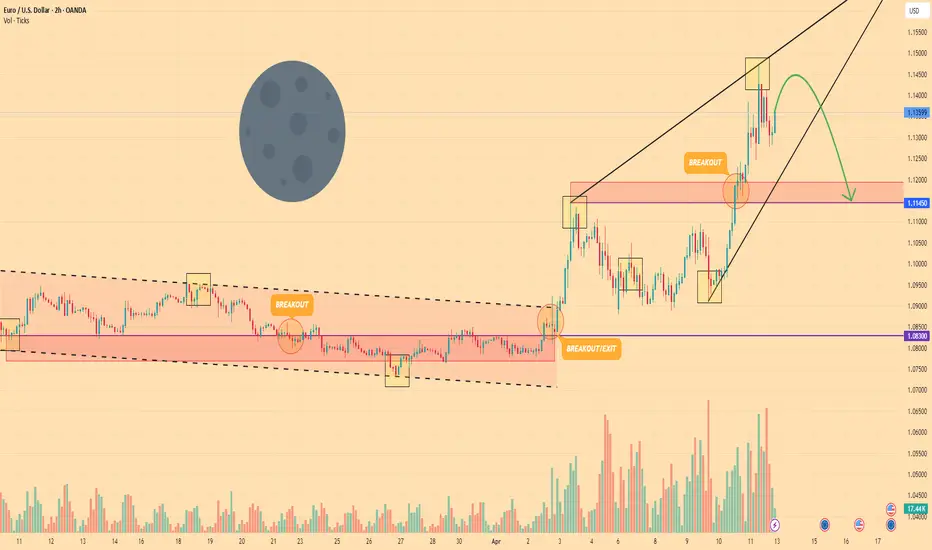
Some time ago price moved inside a falling channel, slowly declining and bouncing from support to resistance.
Then EUR made a breakout, exited the channel, and started forming a rising wedge with clear bullish acceleration.
After a breakout, the price continued to grow and reached the upper boundary of the wedge pattern on the chart.
Recently Euro touched the resistance zone and showed a bounce from the local top near the wedge's upper edge.
Now it trades inside wedge formation and stays above support area near $1.1145 without strong momentum.
In my opinion, Euro can drop from current levels and reach $1.1150 zone as next support target soon.
If this post is useful to you, you can support me with like/boost and advice in comments❤️
Analysis
GOLD - Price can rise a little and then correct to support areaHi guys, this is my overview for XAUUSD, feel free to check it and write your feedback in comments👊
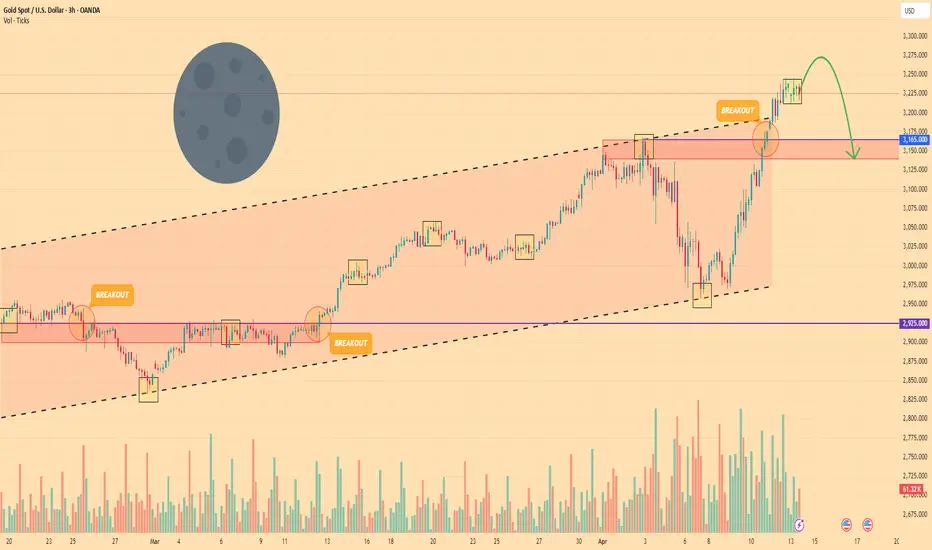
A few days ago price traded inside a rising channel, showing steady growth and holding above support levels.
Later, Gold made several breakouts from local resistances and continued to rise within the channel borders.
Eventually price reached the upper edge of the channel and formed a local top around the $3238 level.
Recently, it made a short-term pullback and now trades just above $3165 support zone without momentum.
Currently, Gold stays in the upper part of the range but shows early weakness after a strong bullish rally.
In my opinion, Gold can decline and reach the $3140 support level during the next corrective wave down.
If this post is useful to you, you can support me with like/boost and advice in comments❤️
HelenP. I Gold may make correction and then continue to growHi folks today I'm prepared for you Gold analytics. Following a deep correction that pushed the price down to the support zone between 2975 and 2950 points, Gold made a strong bullish reversal. This zone had already acted as a key accumulation area in the past, and once again, buyers stepped in aggressively. The reaction from support 2 at 2975 points was sharp, with the price bouncing and forming a clear impulse move. As XAU continued to rise, it broke back above the trend line and retested it, turning former resistance into support. Shortly after, the price pushed above the local support zone between 3165 and 3185 points, confirming the strength of the bullish trend. This zone is now acting as a base for further growth. Currently, Gold is trading above the trend line and support zone, holding near the 3230 area. The recent bullish momentum, strong impulse structure, and consistent reaction to technical levels indicate that buyers remain in control. Given the breakout, successful retest, and strength from key support zones, I expect XAUUSD to continue rising toward my goal at 3300 points. If you like my analytics you may support me with your like/comment ❤️

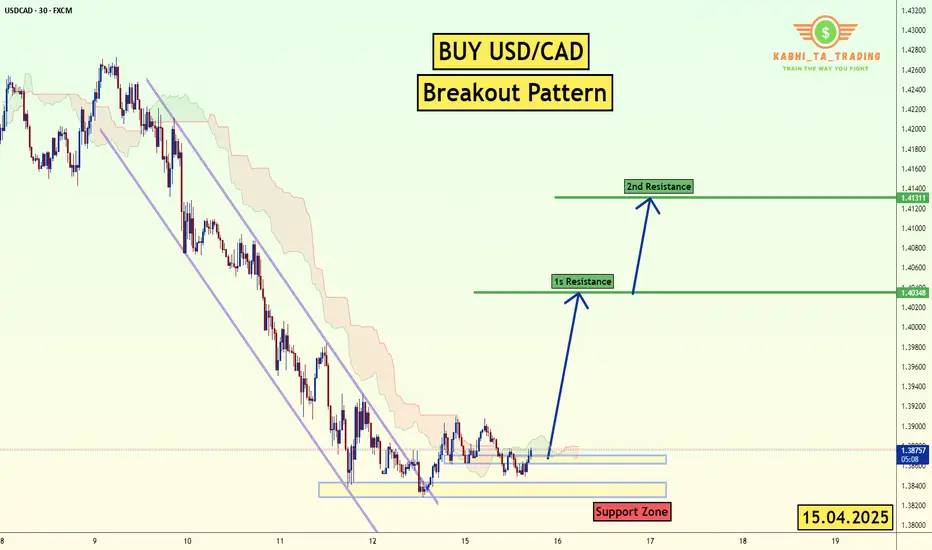
USD/CAD Breakout Pattern (15.04.2025)The USD/CAD pair on the M30 timeframe presents a Potential Buying Opportunity due to a recent Formation of a Breakout Pattern. This suggests a shift in momentum towards the upside and a higher likelihood of further advances in the coming hours.
Possible Long Trade:
Entry: Consider Entering A Long Position around Trendline Of The Pattern.
Target Levels:
1st Resistance – 1.4034
2nd Resistance – 1.4131
🎁 Please hit the like button and
🎁 Leave a comment to support for My Post !
Your likes and comments are incredibly motivating and will encourage me to share more analysis with you.
Best Regards, KABHI_TA_TRADING
Thank you.
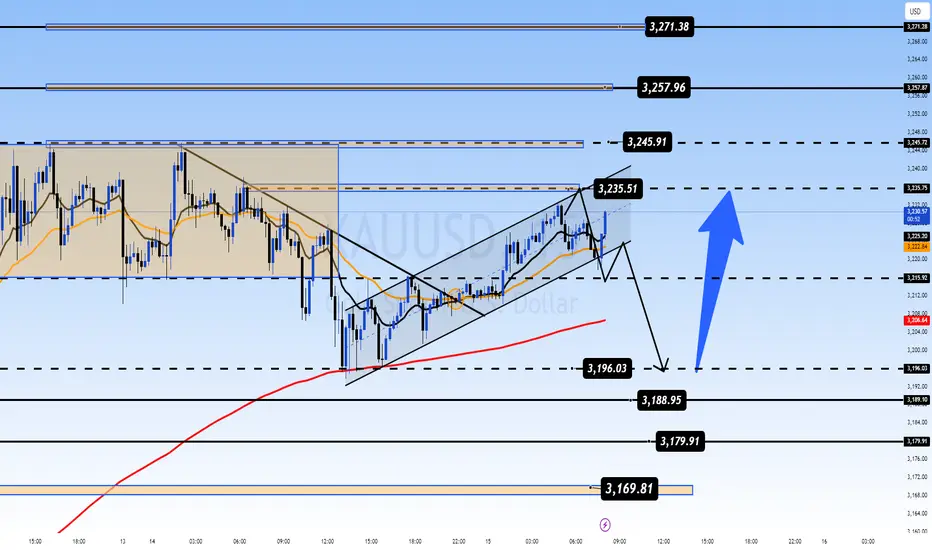
Gold Market Outlook: Key Risks and Opportunities Ahead 📌 Gold Market Outlook: Key Risks and Opportunities Ahead 💰📉
🔍 Current Trend and Short-Term Risk
Gold continues to exhibit strong bullish momentum, although minor corrections remain possible in the short term. A key driver for sustaining the uptrend will be the strength of buyers at support zones like 3196 and 3204.
However, if the market fails to hold above 3135, we could see a deeper retracement. In such a case, a drop toward the 311x region could offer an attractive buying opportunity — particularly if bullish price reactions are confirmed near that level.
🧭 Key Levels to Watch
3135 Support: A break below this zone with strong momentum could signal potential bearish continuation. Any move toward 311x should be closely monitored for a bullish reversal setup.
311x Zone: If price pulls back to this range and we observe reaction or rejection, it could present a high-probability buy opportunity to rejoin the broader uptrend.
🌍 Impact of a Quiet News Week
With no major economic releases on the calendar, market direction will likely be determined by volume flows and price action near key technical zones. Areas such as 3195, 3204, and 3245 will be pivotal in shaping short-term sentiment.
Traders should remain attentive to how price behaves around these levels, especially during London and New York sessions where most volume is concentrated.
🛠️ Tactical Plan for the Week
Asian & European Sessions Focus: Look for momentum plays or reaction signals at key intraday support levels (e.g. 3196). Sharp pullbacks may offer buy setups with solid risk/reward ratios.
Sell Scenarios at Resistance: If price breaks above 3245 with weak follow-through and fails to hold, that could provide an opportunity for tactical short entries — but only with confirmation via volume or rejection patterns.
Stick to Your Plan: Despite the current volatility, it’s critical to adhere to your strategy. Avoid emotional trades, always manage risk, and respect your TP/SL levels.
💡 Conclusion
Gold remains in a strong upward trend with active buyers around key support zones. While short-term pullbacks are expected, they could offer new opportunities to scale in.
Stay patient, trade with discipline, and let the market offer confirmation before committing to a position. Even in a quiet news environment, well-prepared traders can take advantage of high-quality setups by focusing on structure and risk management.
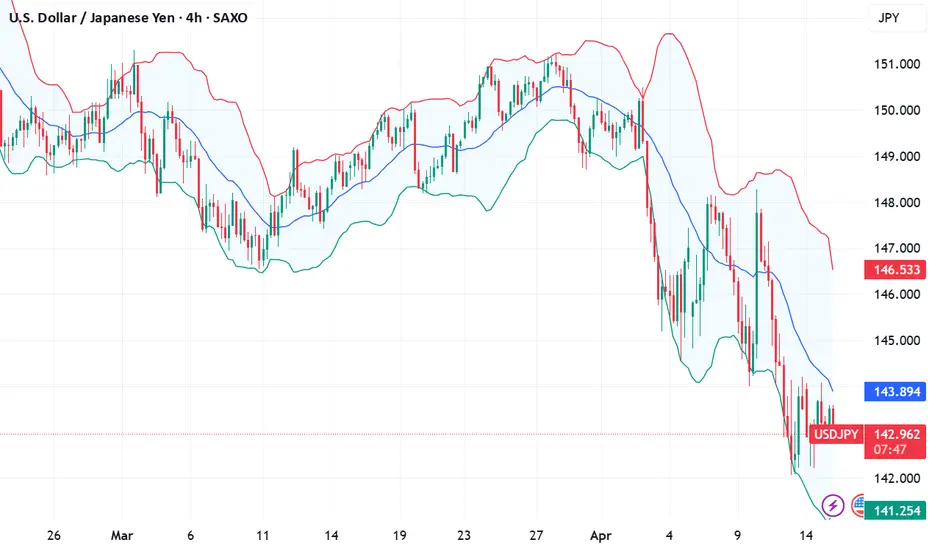
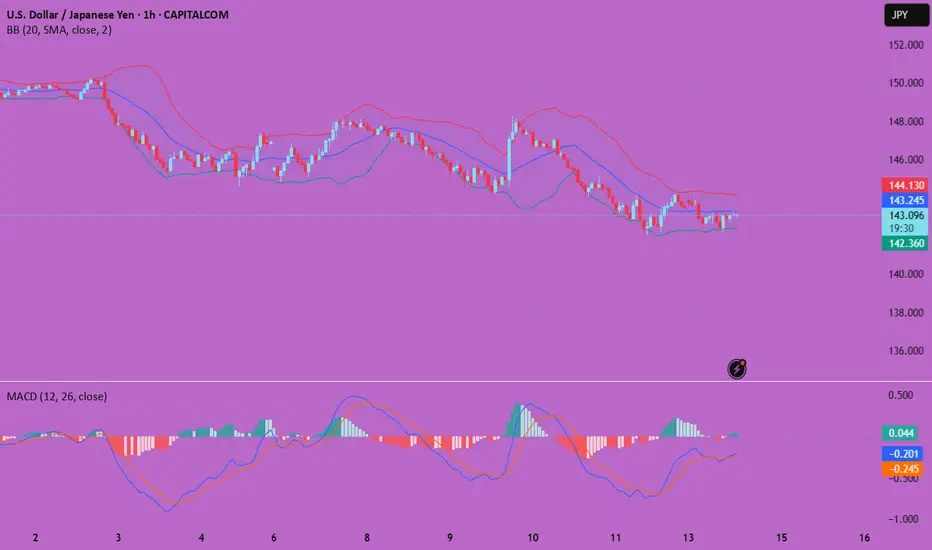
Fundamental Market Analysis for April 15, 2025 USDJPYThe Japanese yen (JPY) is declining during the Asian session on Tuesday, which, along with a modest rise in the US dollar (USD), is lifting the USD/JPY pair closer to the mid-143.00s. US President Donald Trump's cancellation of tariffs on major consumer electronics and the signal that he may temporarily exempt the auto industry from the 25 per cent duties continue to support market optimism. This in turn undermines demand for traditional safe-haven assets, including the yen.
However, the rapidly escalating trade war between the US and China and lingering concerns over the potential economic impact of Trump's crippling tariffs should temper market optimism. Meanwhile, expectations that the Bank of Japan (BoJ) will continue to raise interest rates are strongly at odds with bets on more aggressive policy easing by the Federal Reserve (Fed). This, along with hopes of a trade deal between the US and Japan, should limit losses for the low-yielding Yen.
Trade recommendation: SELL 142.80, SL 144.50, TP 140.50
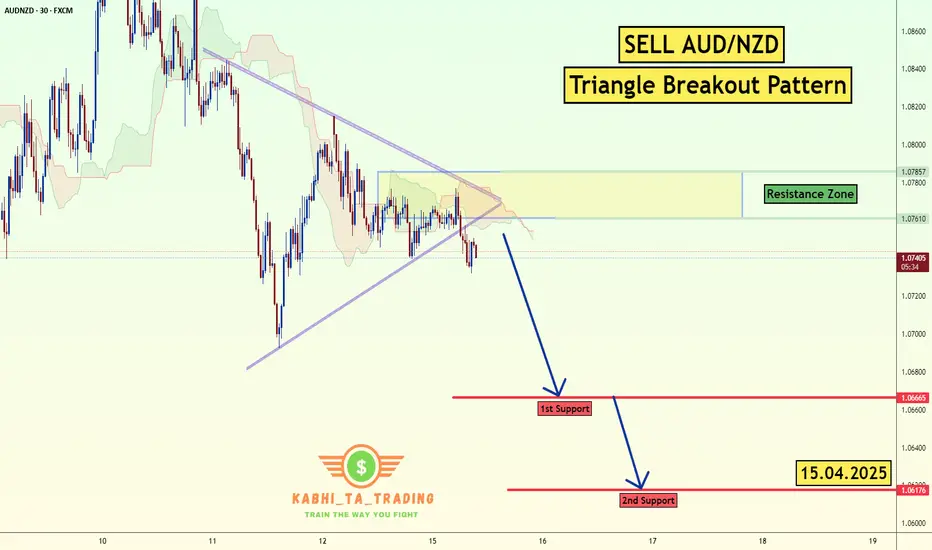
AUD/NZD Triangle Breakout (15.04.2025)The AUD/NZD Pair on the M30 timeframe presents a Potential Selling Opportunity due to a recent Formation of a Triangle Breakout Pattern. This suggests a shift in momentum towards the downside in the coming hours.
Possible Short Trade:
Entry: Consider Entering A Short Position around Trendline Of The Pattern.
Target Levels:
1st Support – 1.0666
2nd Support – 1.0617
🎁 Please hit the like button and
🎁 Leave a comment to support for My Post !
Your likes and comments are incredibly motivating and will encourage me to share more analysis with you.
Best Regards, KABHI_TA_TRADING
Thank you.
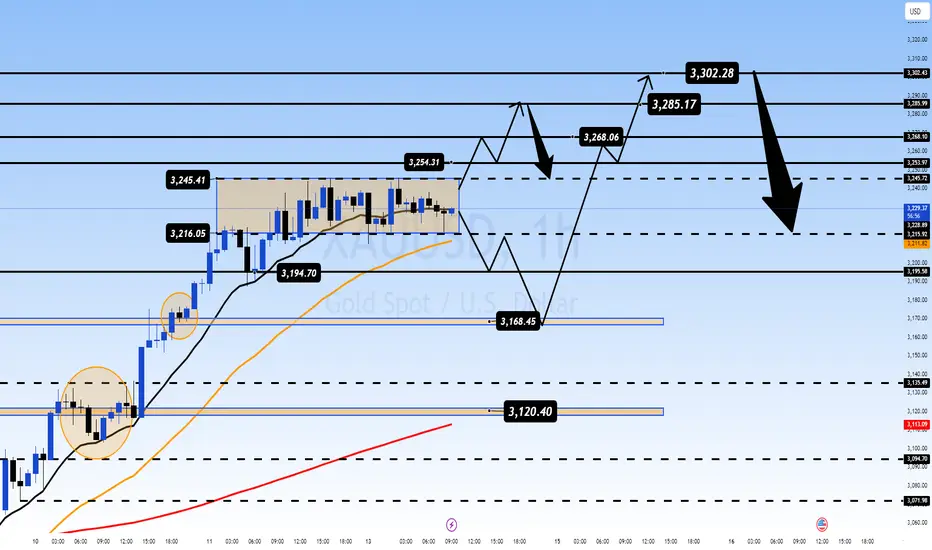
XAU/USD Weekly Outlook Liquidity Grab Before Next Move📌 XAU/USD Weekly Outlook: Range-Bound Behavior Hints at Potential Liquidity Grab Before Next Move 💰📊
Gold (XAU/USD) is currently consolidating within a broad 30-point price channel between 3,216 and 3,246. Price action shows clear indecision, as bulls and bears wrestle for control without confirmation of a breakout or breakdown.
While the overall trend remains bullish, momentum has softened compared to last week. Technical indicators are signaling overbought conditions, and a deeper liquidity sweep is becoming increasingly probable. Traders should remain patient and watch for clearer signals during the upcoming European session.
🔍 Market Structure Highlights
Upside Barriers: 3,246 (ATH), 3,255, 3,268, 3,285, 3,302
Downside Supports: 3,216, 3,195, 3,172, 3,152, 3,120
📈 Trade Opportunity Zones
Potential Long Setup:
Buy Zone: 3,172 – 3,170
Stop Loss: 3,166
ls: 3,176 | 3,180 | 3,184 | 3,188 | 3,192 | 3,196 | 3,200
Potential Short Setup:
Sell Zone: 3,268 – 3,270
Stop Loss: 3,274
Target Levels: 3,264 | 3,260 | 3,256 | 3,252 | 3,248 | 3,244 | 3,240
🧭 Weekly Strategy Insight
With no significant economic data on the calendar this week, price movements will likely be driven by intraday liquidity and order flow. Focus should be placed on the London and New York sessions, where volume tends to peak and directional bias becomes more evident.
Current market behavior suggests that a fake-out or liquidity trap could develop before the next significant move. Traders are advised to avoid chasing price and instead wait for optimal entries at key zones.
⚠️ Risk Reminder
Even in the absence of major news, volatility remains elevated. Always execute trades with a solid risk plan and predefined TP/SL levels. Protect your capital first — the opportunities will come with patience and discipline. 🛡️
USD/JPY(20250414)Today's AnalysisMarket news:
Fed Collins: It is currently expected that the Fed will need to keep interest rates unchanged for a longer period of time. If necessary, the Fed is "absolutely" ready to help stabilize the market; Kashkari: No serious chaos has been seen yet, and the Fed should intervene cautiously only in truly urgent situations; Musallem: The Fed should be wary of continued inflation driven by tariffs.
Technical analysis:
Today's buying and selling boundaries:
143.41
Support and resistance levels:
146.00
145.03
144.40
142.41
141.79
140.82
Trading strategy:
If the price breaks through 144.40, consider buying, the first target price is 145.03
If the price breaks through 143.41, consider selling, the first target price is 142.41
Trade Analysis for Week 16 (14Apr25 onwards)Hello fellow traders , my regular and new friends!
Over here I will be sharing my analysis for this week.
Mainly On:
EURUSD
EURAUD
EURNZD
BTC
USDSGD
Moving forward I will separate both the Trade review and Coming week trade analysis for easy viewing!
-- Get the right tools and an experienced Guide, you WILL navigate your way out of this "Dangerous Jungle"! --
*********************************************************************
Disclaimers:
The analysis shared through this channel are purely for educational and entertainment purposes only. They are by no means professional advice for individual/s to enter trades for investment or trading purposes.
*********************************************************************

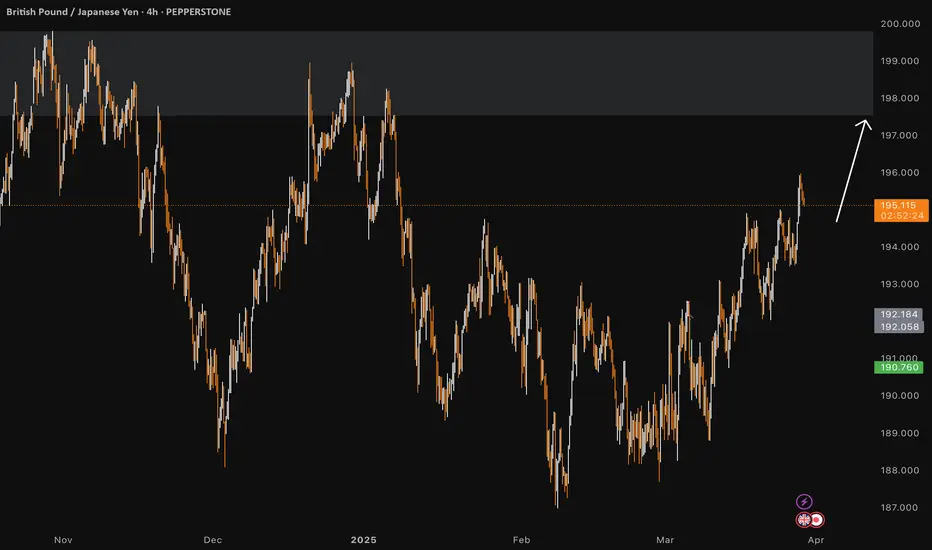
GBPJPY Discretionary Analysis: Aiming for the Sky I’m not entirely sure, but my gut says it’ll go up. If not, I lose some money and my gut clearly needs more back testing. Profit if I’m right, lesson if I’m wrong! 👌
Just my opinion, not financial advice.
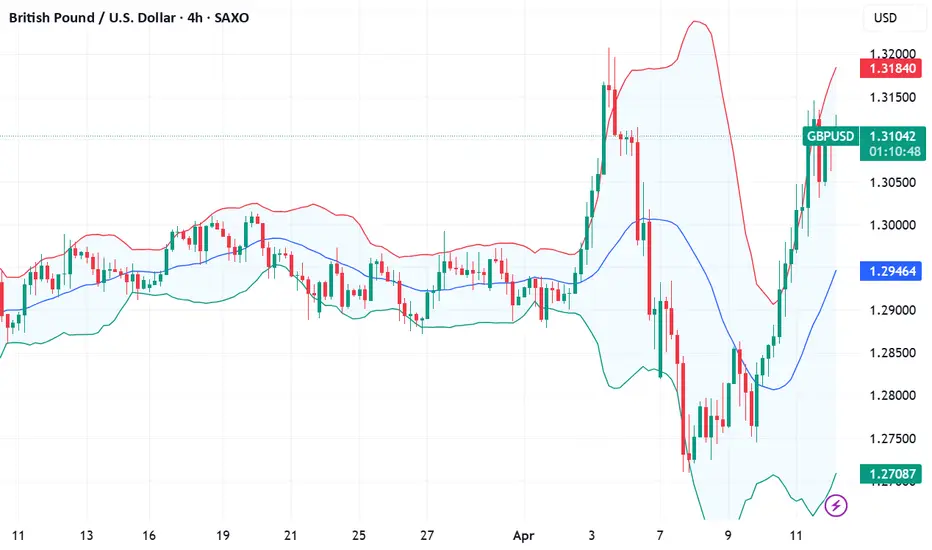
Fundamental Market Analysis for April 14, 2025 GBPUSDThe initial market reaction to US President Donald Trump's decision last week to suspend sweeping reciprocal tariffs for 90 days was short-lived amid heightened fears of a US recession amid an escalating trade war between the US and China. China's 84 per cent tariffs on US goods went into effect on Thursday, and Trump raised duties on Chinese imports to an unprecedented 145 per cent. Given that the US still imports a number of hard-to-replace materials from China, these developments have weakened confidence in the US economy.
Meanwhile, data released last week showed that the US consumer price index (CPI) declined 0.1% in March, while core CPI rose +2.8% year-on-year, below consensus forecasts. In fact, markets are now pricing in the likelihood of a 90 basis point rate cut before the end of this year. Conversely, investors believe the likelihood of a Bank of England (BoE) interest rate cut next month is slightly less likely.
The aforementioned favourable fundamental backdrop supports a positive outlook for spot prices in the near term, although bulls seem reluctant to make aggressive bets and prefer to wait for important UK macro releases. Tuesday will see the release of the all-important monthly employment report, followed by the latest consumer inflation data on Wednesday. In addition, this week investors will be keeping an eye on the release of monthly US retail sales data and Fed Chairman Jerome Powell's speech, which will play a key role in influencing dollar price action. This, in turn, should give a significant impetus to the GBP/USD pair in the second half of the week.
Trading recommendation: BUY 1.3130, SL 1.3010, TP 1.3310
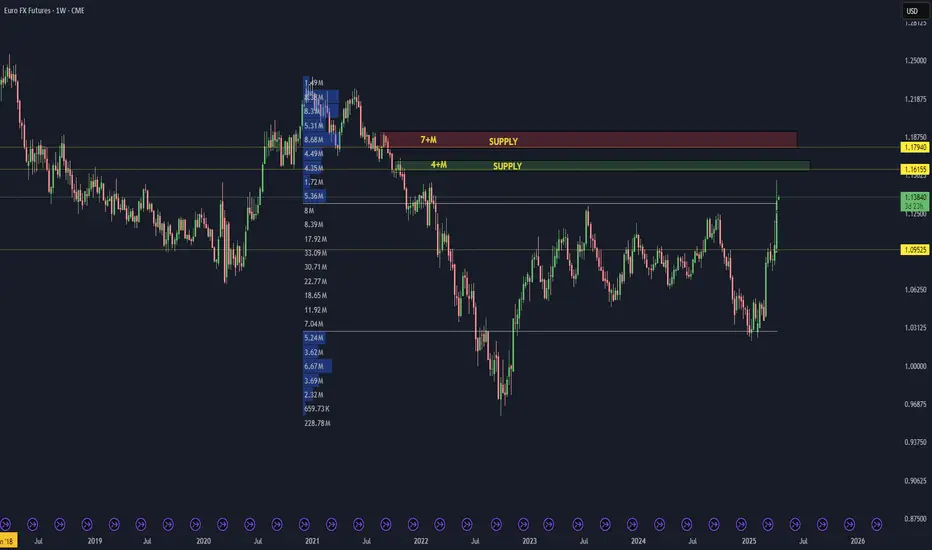
Institutional Supply Zones in Play: Will the Euro FX Rally Hold?Euro FX Futures is currently showing strong bullish momentum on the weekly timeframe, surging toward major supply zones that have historically triggered significant sell-offs. The chart reveals two key supply areas where institutional selling pressure has previously emerged. The first, more immediate zone represents a medium-term supply area that could attract profit-taking or initiate a pause in the current rally. The second, higher zone is a long-term supply area with even greater significance, marking the origin of strong bearish moves in the past. These zones are crucial in the current context, as they highlight potential turning points or consolidation phases as price approaches them.
The overall structure remains bullish, but as the market climbs into these well-defined supply regions, traders should be cautious and watch for any shift in momentum or early signs of distribution. These zones often act as magnets for liquidity and can become battlegrounds between buyers and sellers. Whether this bullish move powers through or reacts with a pullback will depend on how price behaves within these high-supply environments. For now, the market is in a strong phase of upside continuation, but strategic traders will be closely monitoring these zones for potential setups.
Is it going to happen again? My view to the markets right now...CBOT_MINI:YM1!
Is the Dow Jones breaking the downtrend again?
I believe there's a strong chance the markets are setting up for another move higher. From a fundamental standpoint, the recent pause in tariffs is a big deal. It removes an immediate layer of uncertainty that’s been hanging over the global economy, especially for exporters and multinational companies. On top of that, the fact that key tech products have been left out of the latest tariff actions is boosting confidence in the sector that has been leading market strength for years.
Economically, we’re still seeing resilience in key indicators. Unemployment remains low, consumer spending is steady, and central banks are staying cautious with tightening. The environment still leans more towards slow growth than recession, which supports equities over the medium term.
More importantly, my own criteria for a favorable market setup are lining up. Whether it’s sentiment, intermarket signals, or trend conditions—this looks like a solid spot for a bullish stance.
You can see my chart to check out my current viewpoint on the Dow Jones and how I’m positioning based on all this.
Not Financial Advice

#DOGE #DOGEUSD #DOGEUSDT #DOGECOIN #Analysis #Eddy#DOGE #DOGEUSD #DOGEUSDT #DOGECOIN #Analysis #Eddy
DOGEUSDT.P Higher Time Frame Analysis
(( First, I predict a 35% drop, and finally, from the lower green line, a 178% growth to the first target, and then a 364% pump to the second target. ))
Important areas of the higher time frame are identified and labled.
Everything is clear and I have clearly drawn the important areas in the chart and the labels and names of the areas are included. Depending on your analytical style, you can get the necessary confirmations and see the reduction from the marked areas to the specified targets.
This Analysis is based on a combination of different styles, including the volume style with the ict style.
Based on your strategy and style, get the necessary confirmations for this analysis to buy entery the trade.
Don't forget risk and capital management.
The responsibility for the transaction is yours and I have no responsibility for not observing your risk and capital management.
💬 Note : The price can go much higher than the first target, and there is a possibility of a 364% pump on this currency. By observing risk and capital management, obtaining the necessary approvals, and saving profits in the target, you can keep it for the pump.
Be successful and profitable.
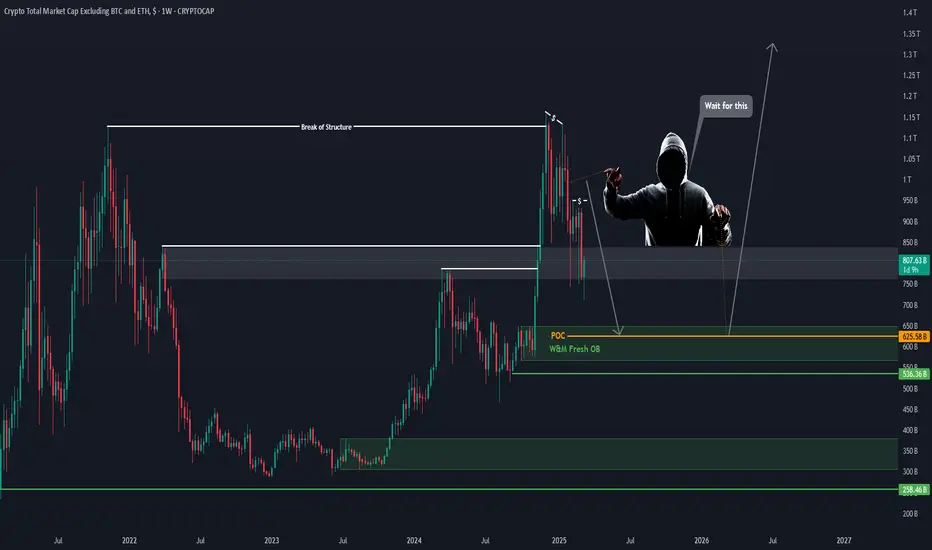
Proceed according to my analysis on the Total 3 chart.
My analysis of the Total 3 chart :
👆 Based on the analysis provided on the Total 3 chart, proceed and wait for another bearish lag for the Total 3 chart to reach the specified area. The divergence on the upper timeframe is most likely a market maker trap and the current bullish move is a fake. In my opinion, the main bullish move will begin after another 30-45% correction on altcoins and the Total 3 chart reaching the specified area and the orange POC line.

#TOTAL3 #Analysis #Eddy#TOTAL3 #Analysis #Eddy
Crypto Total Market Cap Excluding BTC and ETH
Everything is clearly drawn and labeled.
For buy Long & Spot investment on altcoins, wait for the Total 3 index to reach its demand zone.
This is just my opinion and you should make your decision based on your style and strategy and get the necessary confirmations.
Be sure to take a look at this indicator on the monthly time frame.
BITCOIN - Price can correct and then bounce up from pennantHi guys, this is my overview for BTCUSDT, feel free to check it and write your feedback in comments👊
Some time ago price moved inside a rising channel, holding a bullish structure and making higher local lows.
Then, BTC exited from the channel and dropped to the $76600 support area, forming a new local bottom range.
After this, the price bounced strongly and started to form a pennant pattern with gradual pressure to the top.
Recently, it reached the resistance level at $82200 and tested the $83100 zone, but it has not made a breakout yet.
Now, BTC trades inside a pennant pattern and holds close to upper resistance without losing upward momentum.
In my mind, Bitcoin can break the resistance and reach the $86700 target as the next leg in its bullish direction.
If this post is useful to you, you can support me with like/boost and advice in comments❤️

Trading Week 15 Review 2025Hello fellow traders , my regular and new friends!
How was your trading this week?
Did you get a killing on the SNP, EURUSD etc?
This part will be on the review for this week.
Moving forward I will separate both the Trade review and Coming week trade analysis for easy viewing!
-- Get the right tools and an experienced Guide, you WILL navigate your way out of this "Dangerous Jungle"! --
*********************************************************************
Disclaimers:
The analysis shared through this channel are purely for educational and entertainment purposes only. They are by no means professional advice for individual/s to enter trades for investment or trading purposes.
*********************************************************************

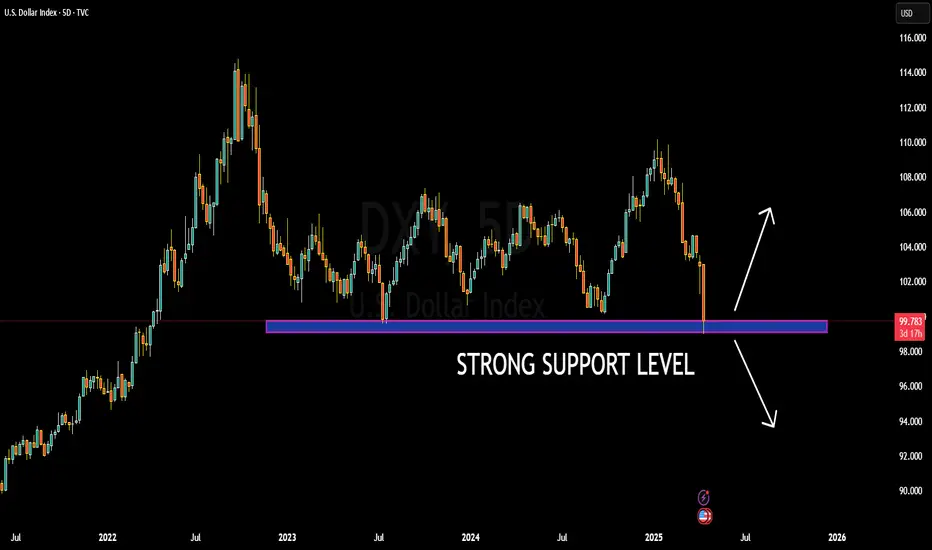
DXY NEXT MOVE AND MARKET EFFECTThe US Dollar Index (DXY) is currently testing a major multi-year support zone around the 99.70–100.00 level. This level has held firm multiple times in the past, acting as a strong demand area during key macroeconomic cycles. Right now, price action is showing indecision with a clear do-or-die moment forming. If bulls defend this zone, we could witness a significant bullish reversal, potentially targeting the 103.00–105.00 range. However, a decisive break below this support could trigger a bearish wave toward the 96.00 handle or even lower.
Technically, this zone is not just psychological, but also a structural demand region, aligning with previous swing lows and price pivots. We’re seeing a potential for either a double bottom reversal or a breakdown structure forming, depending on how the market reacts in the coming sessions. Price is extremely oversold on higher timeframes, which could fuel a relief rally if momentum shifts. The reaction here will be key for broader market direction, especially as the dollar plays a pivotal role across forex majors.
Fundamentally, the DXY is under pressure as recent U.S. macro data reveals weakening momentum. March CPI printed hotter than expected, but other indicators like core PCE, NFP softness, and signs of slowing consumer demand are fueling expectations that the Fed may be nearing a policy pivot. At the same time, global risk sentiment is improving and yields have pulled back slightly, putting pressure on the greenback. However, rising geopolitical tensions and elevated oil prices continue to support USD as a safe-haven asset.
As a professional trader, this is a critical level to watch. I’m keeping an eye on price action confirmation for either a bullish engulfing setup or a clean break and retest of the 99.50 level. Both scenarios offer high-probability trades. Patience here is crucial — let the market reveal its hand, then align with the momentum. Dollar volatility is likely to remain elevated heading into next week, so managing risk with clarity is key.
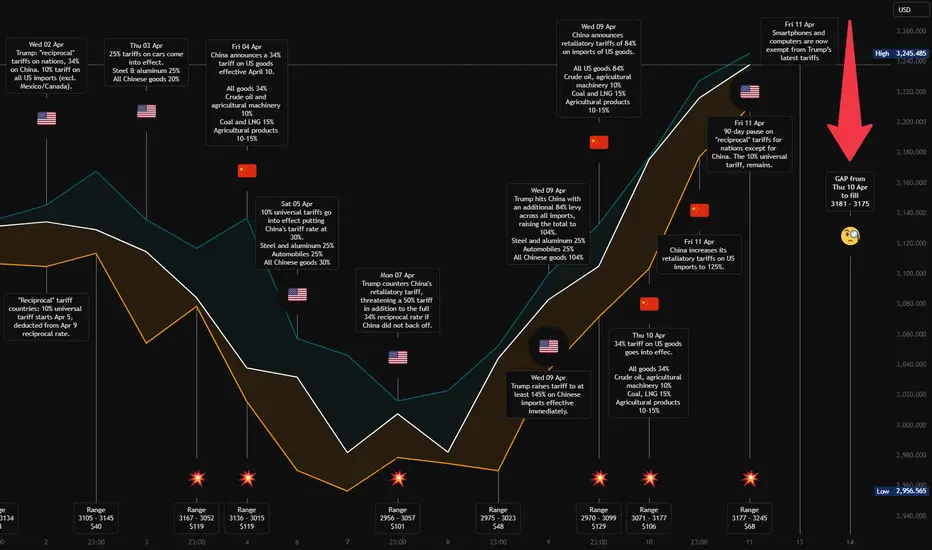
Idea for Mon 14 Apr - Gold Short – Bear in a Bull OutfitOANDA:XAUUSD
Gold has been heavily influenced by recent developments in the trade war.
A 90-day pause on tariffs (excluding China) and the exemption of smartphones and computers from tariffs were announced on friday.
These headlines may temporarily calm markets and give stocks room to rise — which typically puts pressure on gold. If Dollar is rising again, could be a side effect too.
This could lead to a short-term pullback in gold prices.
A price gap was formed around $3175.51 during the opening session on Thursday, April 10th.
After a small bounce, i expect gold to move downward to fill that gap.
A potential support level is sitting near $3156, which could act as a bounce zone.
"Next week it’s a bear inside a bull outfit."
Despite a broader bullish structure, we could see the week start with a correction. A classic gap-fill setup for the short-term traders.
RSI and MacD are on top levels, but for how long?
-------------------------------------------------------------------------
This is just my personal market idea and not financial advice! 📢 Trading gold and other financial instruments carries risks – only invest what you can afford to lose. Always do your own analysis, use solid risk management, and trade responsibly.
Good luck and safe trading! 🚀📊
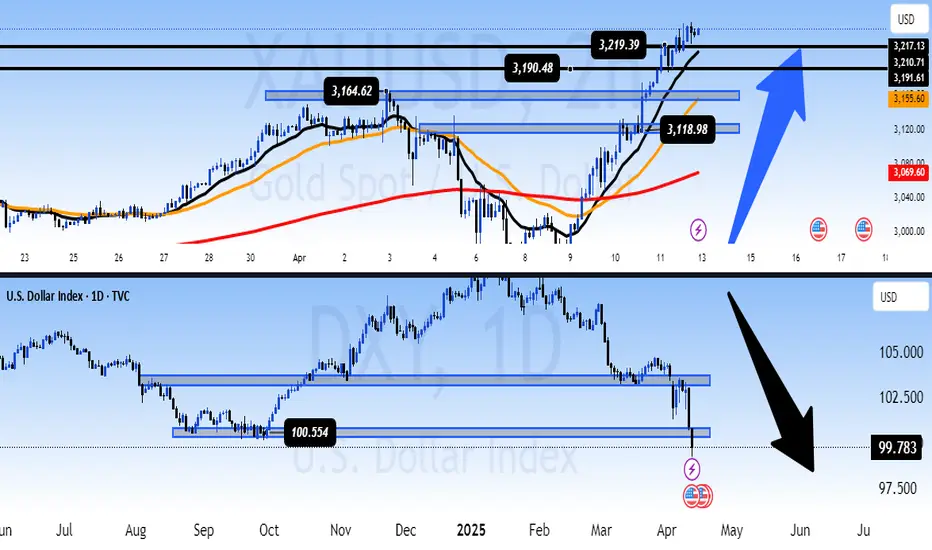
[XAU/USD & DXY] – Long-Term Outlook📌 – Long-Term Outlook: Is Gold Entering a New Bull Cycle as USD Weakens?
📊 Technical Analysis – Gold & DXY
The divergence between Gold and the U.S. Dollar Index (DXY) has become increasingly clear:
🔹 Gold (XAU/USD):
Price has broken the previous high at 3,190 and is now testing 3,219 – a fresh all-time high on the daily chart.
The MA13, MA34, and MA200 are showing a perfect “bullish fan” formation, indicating a sustainable uptrend rather than a short-term pump.
The key support zone around 3,164 – 3,118 remains critical for any healthy pullback.
🔻 U.S. Dollar Index (DXY):
Price has decisively broken below the psychological 100.55 support and is now hovering near 99.78.
If DXY fails to hold above 99.7, the next downside target could be 97.5 in the coming quarter.
The technical structure is clearly bearish, confirming USD weakness across the board.
→ This negative correlation aligns with macro expectations: a weaker dollar is fueling gold’s bullish momentum.
🌍 Fundamental Analysis – Macro Drivers
US PPI & CPI both come in lower than expected:
Inflation is showing clear signs of cooling.
Markets are now pricing in a possible rate cut as early as June.
Shift in Fed tone – from hawkish to neutral:
While not officially declared, recent Fed statements have been more dovish, supporting risk assets and weakening the dollar.
Strong safe-haven demand remains:
Geopolitical risks and economic uncertainty continue to push capital into gold, especially as USD enters a weakening phase.
🧭 Long-Term Perspective
Gold is potentially entering a new bull cycle. With consecutive ATH breakouts and favorable macro conditions (falling inflation, expected rate cuts, USD weakness), gold could push to even higher levels into Q2 and Q3.
The USD faces downside pressure in the coming months, especially if the Fed signals a firm pivot toward easing.
⚠️ Strategy Caution
Short-term corrections may occur, especially after such a sharp rise.
However, any pullbacks into key support zones could present strategic long opportunities for longer-term investors.
💬 What’s Your Take?
Is this the beginning of a major bull cycle in gold, or do you expect deeper pullbacks before continuation?
Drop your analysis and charts below! 👇👇👇
HelenP. I After strong impulse up, BTC can start to declineHi folks today I'm prepared for you Bitcoin analytics. BTC has recently shown a strong recovery after reaching the support zone between 77000 and 76200 points. This area had already acted as a base twice in the past, and the price once again reacted from it with a sharp bullish impulse. The rise brought Bitcoin back into the resistance zone between 83500 and 84300 points - a level that has proven significant in the past. At the same time, BTC approached the descending trend line that forms the upper boundary of the wedge pattern visible on the chart. The reaction from this confluence zone was immediate. The price got rejected right at the intersection of the trend line and resistance zone, forming a clear rejection candle and showing weakness from buyers. This area is now holding Bitcoin down once again and proving itself as a strong supply zone. At the moment, BTC is trading below the trend line and under pressure from resistance. Given the recent price action, multiple rejections from the same zone, and position relative to the wedge, I expect Bitcoin to decline again toward 78000 points - my current goal. If you like my analytics you may support me with your like/comment ❤️

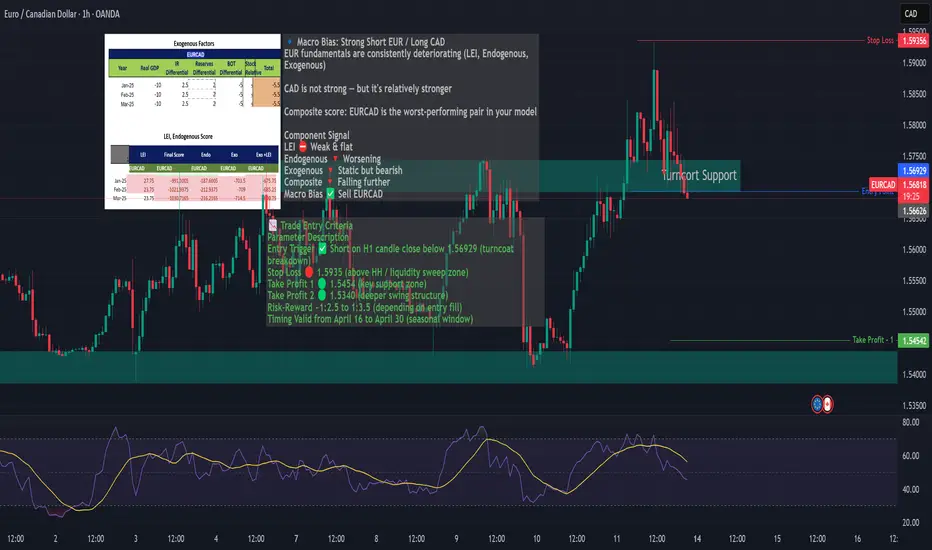
EURCAD Breakdown Watch–Bearish Divergence + Fundamental WeaknessEURCAD rallied into a key turncoat zone (former resistance → support)
Currently consolidating within this zone and showing clear RSI bearish divergence on both 1H and 4H timeframes.
Price is losing momentum while macro and seasonal factors align for a short bias.
🔍 Macro & Seasonality Confluence:
EUR Fundamentals: Worsening LEI, Endogenous & Exogenous scores
CAD Stability: Mildly bearish, but stronger than EUR
Seasonal Bias: EURCAD turns bearish after April 15