Long EURNZD – Seasonal, Fundamentals & Technical ConfluenceWe are entering a long position on EURNZD, capitalizing on a powerful confluence of:
Seasonal EUR strength + NZD weakness (April 10 – May 15)
A clear bullish market structure (CHoCH, HH/HL)
A clean Fibonacci retracement entry at 0.5
Strong macro divergence, with NZD exogenous conditions deteriorating
Macro & Seasonal Context
EUR enters a strong seasonal uptrend from April 10 to end of month
NZD shows seasonal weakness from April 15 onward
NZD’s exogenous model score worsened to -12 in April
While NZD LEI and endo improved, it remains structurally weak
Timing
Best execution: on pullback to 1.9373 zone, ideally between April 10–15, aligned with seasonal entry window.
Analysis

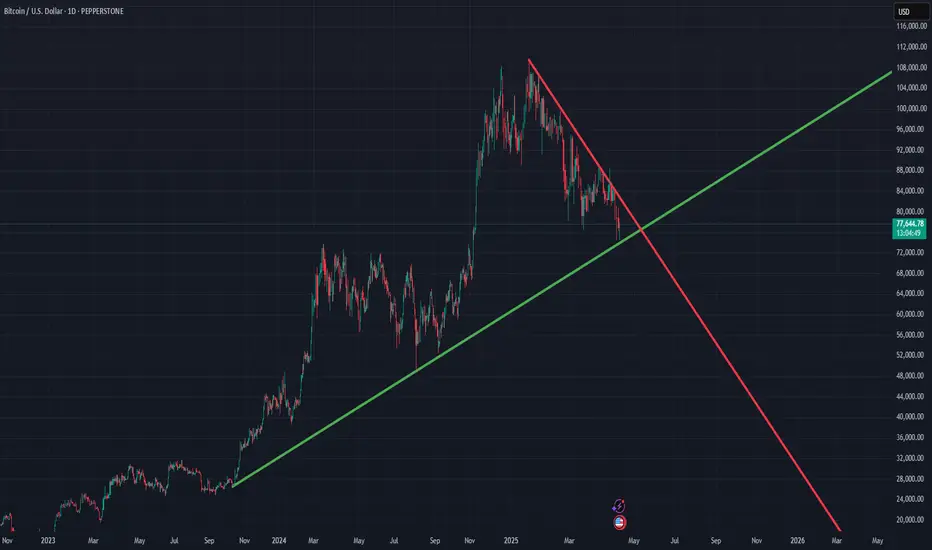
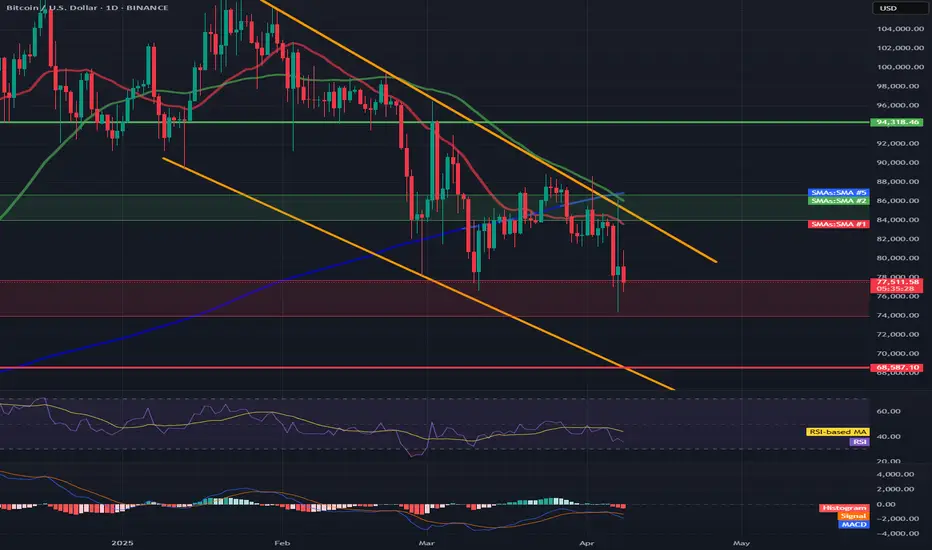
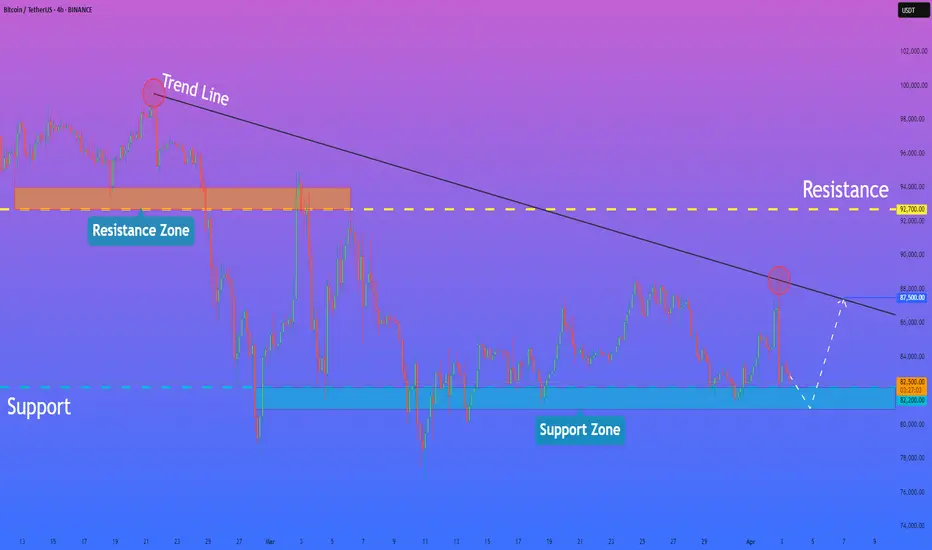
BTC at a Critical Inflection Point – Bulls vs. BearsBitcoin is currently trading around $77,644, sitting right between two major trendlines:
🟢 Long-Term Bullish Support – This green ascending trendline has held since late 2023, providing key support throughout BTC’s macro uptrend.
🔴 Medium-Term Bearish Resistance – The red descending trendline has capped price since the 2025 highs, forming a clear structure of lower highs.
We're now at a pivotal confluence zone where these two trendlines intersect. Price recently bounced off the green support, but it's struggling to decisively break above the red resistance.
🔍 Key Scenarios:
✅ Bullish Breakout:
A strong daily close above the red trendline could confirm bullish continuation.
Targets: $84K, GETTEX:92K , and potentially ATH breakout above $100K.
❌ Bearish Rejection:
Rejection at resistance may lead to a retest of the green trendline (~$74K).
A breakdown from there opens the door to GETTEX:64K –$60K, or even deeper pullbacks.
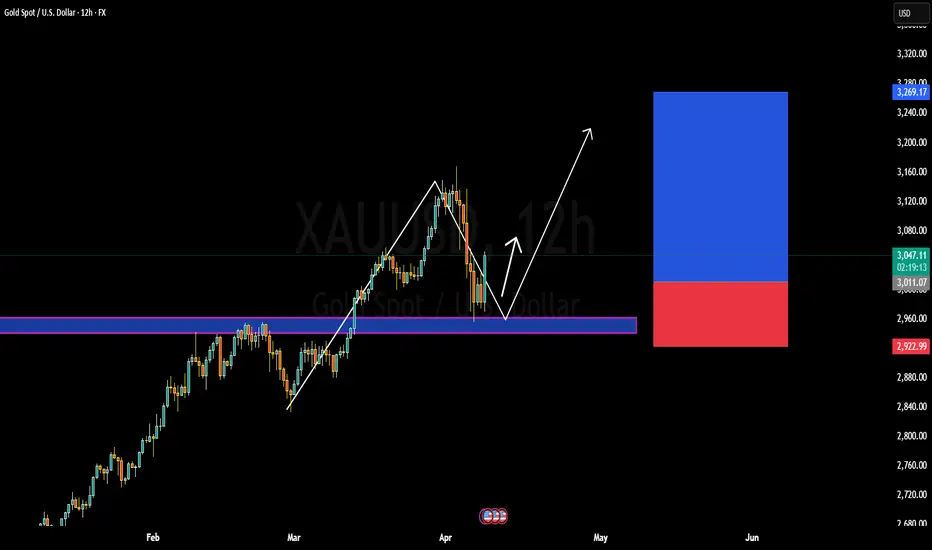
WHY XAUUSD IS BULLISH ?? DETAILED TECHNICAL AND FUNDAMENTALSXAUUSD is currently showing strong signs of bullish continuation after completing a successful retest of the previous breakout zone near the $2,920–$2,950 region. Price action has respected this support beautifully and is now pushing back above $3,040, confirming the bullish structure. This retest and bounce pattern suggests that the market is preparing for a fresh leg higher, with my immediate target set at $3,100. The current structure is aligned with higher highs and higher lows, and momentum is shifting back in favor of buyers.
Technically, the move is clean. The bullish impulse from February to late March created a strong upside leg, followed by a healthy correction into a well-defined demand zone. This demand zone held firm, and the current reaction is supported by increasing volume and bullish candlestick formation on the 12H chart. The inverse head-and-shoulders structure around $2,930 gives this setup even more weight, with a clear breakout above the neckline indicating potential continuation toward higher time frame targets.
From a fundamental perspective, gold remains supported by ongoing geopolitical tensions, increased demand from central banks, and continued inflationary pressure globally. As the market anticipates this week's U.S. CPI data, investors are hedging against uncertainty, which is driving flows into safe-haven assets like gold. The recent pullback in the US dollar index and bond yields is also contributing to upside pressure on XAUUSD, further confirming the bullish outlook.
With both the technical setup and macro drivers favoring upside, I'm looking for continuation toward $3,100 and potentially beyond in the short to mid-term. This area also aligns with the next psychological resistance and projected extension level. As long as price holds above $3,000, any dips should be viewed as fresh buying opportunities. This setup offers an excellent risk-reward ratio for traders looking to capitalize on gold’s ongoing bullish momentum.
EURNZD - at major Resistance: Will it drop to 1.9000?OANDA:EURNZD reached a major resistance level that has previously acted as a strong barrier, triggering some strong bearish momentum. This zone can be a potential point of interest for those looking for short opportunities. Given its historical significance, how price reacts here could set the tone for the next move.
If bearish signals emerge, such as rejection wicks, bearish candlestick patterns, or signs of weakening bullish pressure, I anticipate a move toward the 1.9000 level . However, a clear breakout above this resistance could challenge the bearish outlook and mean further upside. It's a pivotal area where price action will likely provide clearer clues on the next direction.
Just my take on support and resistance zones, not financial advice. Always confirm your setups and trade with a proper risk management.

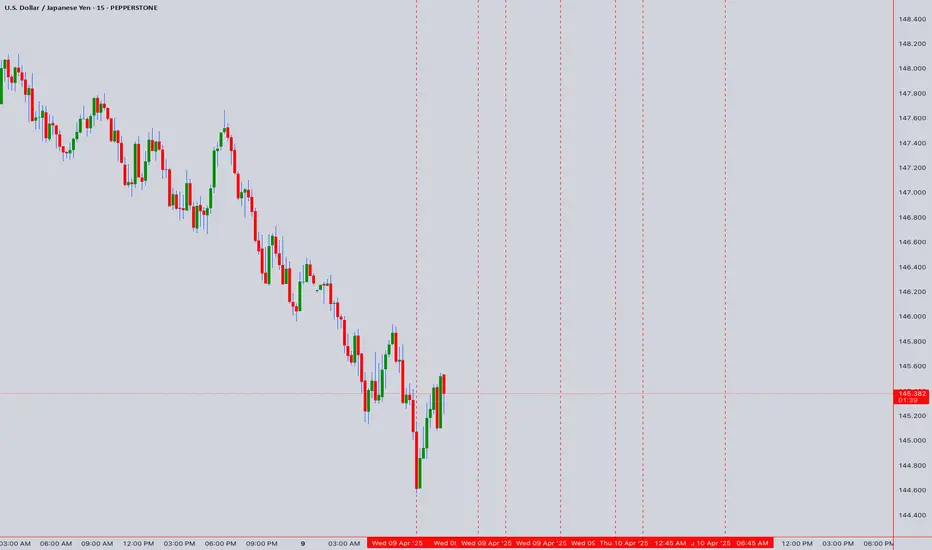
USDJPY Analysis: Reversal Estimations Based on Trading MathDear Trader,
Please find attached my analysis of $Subject, which uses mathematical calculations to identify potential reversal times and price levels. The analysis details projected south and north price targets (horizontal lines on the chart), along with estimated time frames for possible reversals (vertical lines on the chart, accurate to within +/- 1-2 candles). Please note that all times indicated on the chart, including the vertical lines representing potential reversal times, are based on the UTC+4 time zone.
To increase the probability of these analyses, I recommend monitoring the 5-minute and 15-minute charts for the following key reversal candlestick patterns:
Doji’s
Double Bottom/Top
Engulfing Bullish /Bearish
Hanging Man
Hammer/Inverted Hammer
Morning Star
Shooting Star
Triple Top/Bottom
For those interested in further developing their trading skills based on these types of analyses, consider exploring the mentoring program offered by Shunya Trade.
I welcome your feedback on this analysis, as it will inform and enhance my future work.
Regards,
Shunya Trade
Price levels
Price DH Price DL
144.52194 144.63007
144.48096 144.67107
144.38595 144.76618
144.19602 144.95648
144.00622 145.14691
143.81654 145.33746
143.62698 145.52814
143.43756 145.71894
143.24825 145.90987
143.05907 146.10093
142.30361 146.86639
141.55015 147.63385
140.79868 148.40332
140.04922 149.17478
139.30176 149.94824
138.55630 150.72370
137.81283 151.50117
137.07137 152.28063
⚠️ Disclaimer: This post is educational content and does not constitute investment advice, financial advice, or trading recommendations. The views expressed here are based on technical analysis and are shared solely for informational purposes. The stock market is subject to risks, including capital loss, and readers should exercise due diligence before investing. We do not take responsibility for decisions made based on this content. Consult a certified financial advisor for personalized guidance.
Will the support zone keep BTC falling?BTC has once again bounced off the upper border of the downtrend channel. Here, it is worth remembering the long-formed gap around $74,500, which was closed during the last decline.
Here, you can see how the price fell into a strong support zone from $77,742 to $73,980, but if this zone is broken, we can again see a strong decline around also very strong resistance and the lower border of the channel at $68,590.
Looking the other way, you can see that the increases were stopped by the resistance zone from $84,000 to $86,700, only breaking out of this zone at the top will give the possibility of growth towards strong resistance at $94,300.
The RSI is still in the lower part of the range and is again heading towards the lower borders, but here the price has formed a lower low, which can still give another reaction.
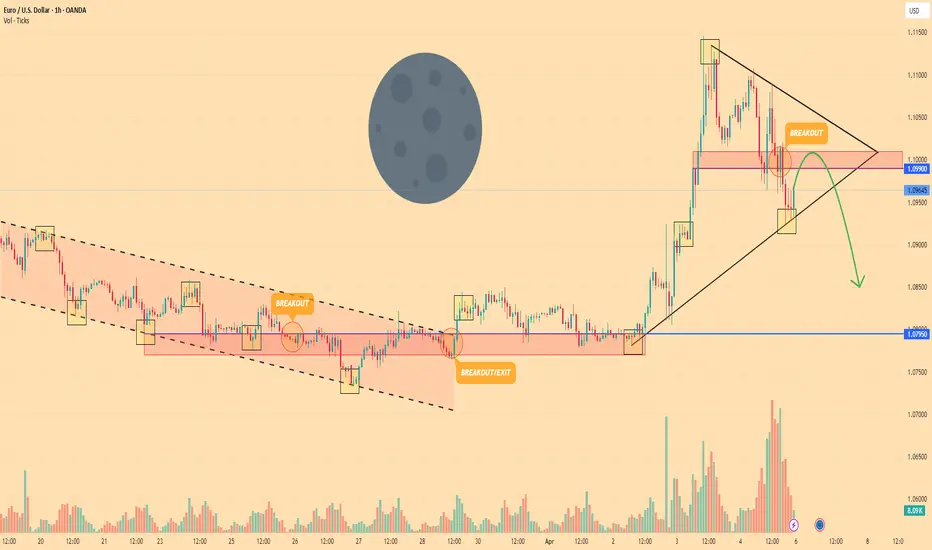
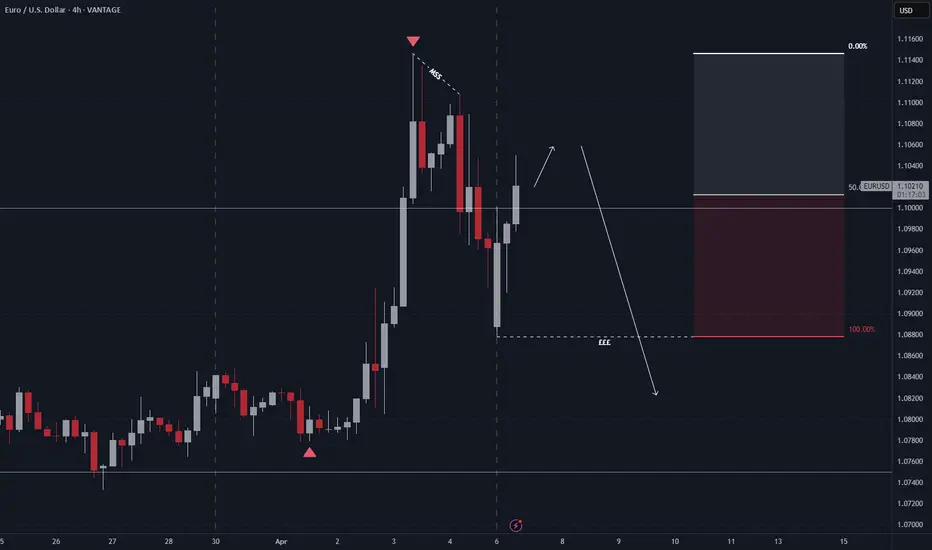
EURO - Price can bounce from resistance area to $1.0850 pointsHi guys, this is my overview for EURUSD, feel free to check it and write your feedback in comments👊
A not long time ago price moved inside a falling channel and showed weak activity with limited growth attempts.
Later Euro made a breakout, exited the channel, and started to form a new bullish structure near resistance.
After that, price made a sharp upward impulse, touching $1.1010 resistance and forming a pennant pattern.
Recently, it broke the lower border of pennant and tested $1.0990 level from below, then bounced down.
Now price trades under local resistance area and holds below broken trendline with weak upward attempts.
In my opinion, Euro can continue to decline and reach $1.0850 support level in the upcoming sessions.
If this post is useful to you, you can support me with like/boost and advice in comments❤️
GOLD MARKET OUTLOOK – Investor Panic After Fake News🟡 GOLD MARKET OUTLOOK – Investor Panic After Fake News, Bearish Bias Remains
📉 Current Strategy: Focus on SELL setups at key resistance zones – short-term bearish outlook remains valid
📌 US Session Recap:
Gold saw a sharp sell-off after a fake news report circulated about the US delaying its planned tariff policy.
→ While the White House later confirmed it was misinformation, the damage was done — panic selling hit across global markets.
💥 As a result, gold dropped aggressively and reached the 295x zone, aligning perfectly with AD’s previous short bias.
Meanwhile, US equities also continued to bleed red.
🧠 Market Sentiment: “Cash is King” is Back
With global instability and fear on the rise:
🔹 Investors are hoarding cash
🔹 USD demand increases, along with inflows into US government bonds
🔹 Risk assets like gold, stocks, and crypto are being dumped
💡 This could be part of Trump’s larger play — forcing global capital to flow back into US Treasuries while applying pressure on speculative markets.
🔮 AD’s View:
Unless we see a clear shift in investor sentiment, the base case remains: → Sell rallies through midweek, then reassess.
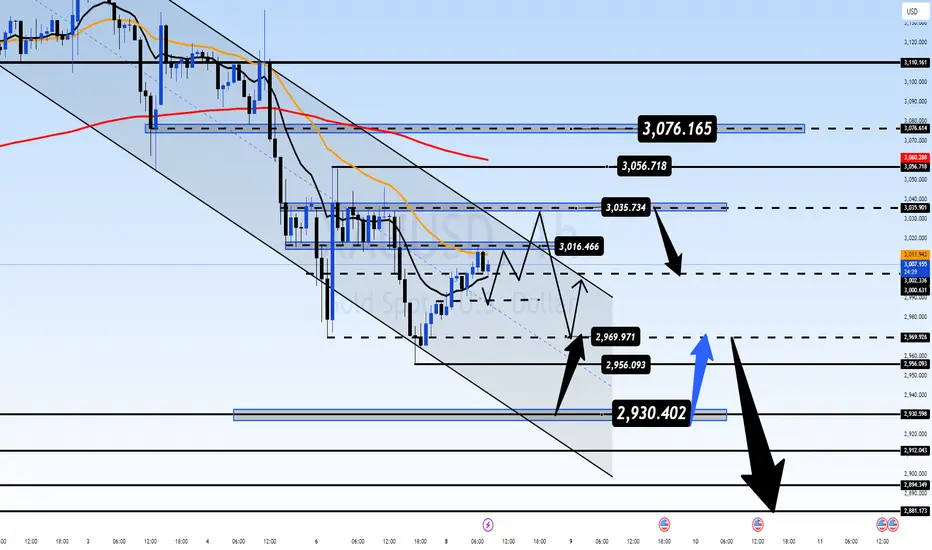
🧭 Key Technical Zones to Watch:
🔺 Resistance: 3005 – 3016 – 3035 – 3056 – 3076
🔻 Support: 2980 – 2969 – 2956 – 2930 – 2912
🎯 TRADE PLAN:
🟢 BUY ZONE: 2930 – 2928
SL: 2924
TP: 2934 – 2938 – 2942 – 2946 – 2950
🔴 SELL ZONE: 3034 – 3036
SL: 3040
TP: 3030 – 3026 – 3022 – 3018 – 3014 – 3010 – ???
📌 Keep an Eye on DXY:
The US Dollar Index is currently testing a major 3-year support level.
→ If equities fail to recover and fear persists, DXY could bounce — and gold would likely continue its correction lower.
⚠️ Final Note:
We’re in a highly volatile and uncertain environment.
→ Stick to the plan. Respect your SL/TP levels. Avoid emotional decisions.
—
📣 Found this perspective useful? Follow for daily macro-backed trade ideas and real-time market structure breakdowns.
Clarity. Consistency. Risk Management.
— AD | Money Market Flow
XAUUSD Analysis: Reversal Forecasts Based on Trading MathDear Trader,
Please find attached my analysis of $Subject, which uses mathematical calculations to identify potential reversal times and price levels.
The analysis details projected south and north price targets (horizontal lines on the chart), along with estimated time frames for possible reversals (vertical lines on the chart, accurate to within +/- 1-2 candles). Please note that all times indicated on the chart, including the vertical lines representing potential reversal times, are based on the UTC+4 time zone.
To increase the probability of these analyses, I recommend monitoring the 5-minute and 15-minute charts for the following key reversal candlestick patterns:
Doji’s
Hammer/Inverted Hammer
Double/Triple Bottom/Top
Shooting Star
Morning Star
Hanging Man
For those interested in further developing their trading skills based on these types of analyses, consider exploring the mentoring program offered by Shunya Trade.
I welcome your feedback on this analysis, as it will inform and enhance my future work.
Regards,
Shunya Trade
Our Math Analysis as below are Gold Levels:-
3018.720095 - 2991.311155
3032.47144 - 2977.65356
3060.06788 - 2950.43212
3087.78932 - 2923.33568
3115.635761 - 2896.364239
3143.607201 - 2869.517799
3171.703641 - 2842.796359
3199.925081 - 2816.199919
3228.271521 - 2789.728479
3342.907282 - 2685.092718
3459.543042 - 2582.456958
3578.178803 - 2481.821197
3698.814564 - 2383.185436
3821.450324 - 2286.549676
3946.086085 - 2191.913915
4072.721845 - 2099.278155
4201.357606 - 2008.642394
⚠️ Disclaimer: This post is educational content and does not constitute investment advice, financial advice, or trading recommendations. The views expressed here are based on technical analysis and are shared solely for informational purposes. The stock market is subject to risks, including capital loss, and readers should exercise due diligence before investing. We do not take responsibility for decisions made based on this content. Consult a certified financial advisor for personalized guidance.

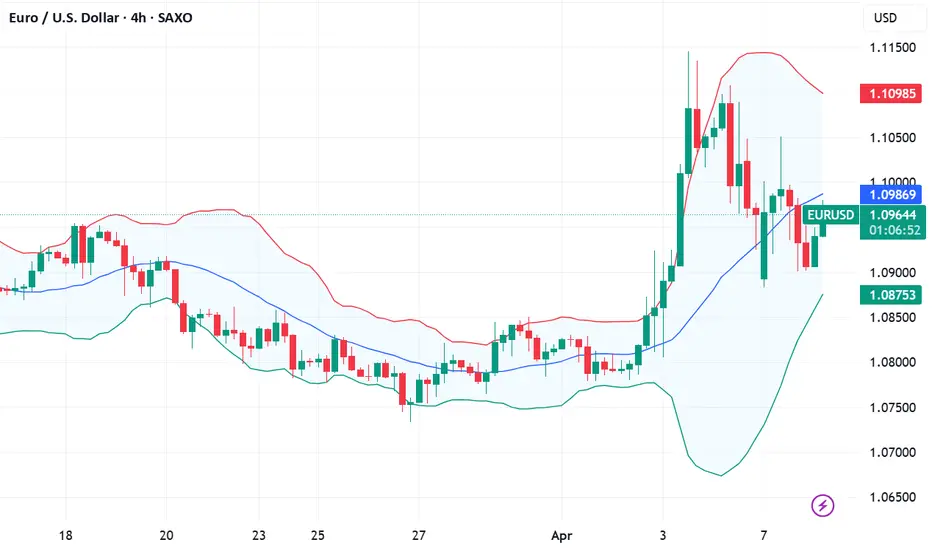
Fundamental Market Analysis for April 8, 2025 EURUSDAfter a tense week in which the US fully adopted a protectionist trade policy - despite lacking the necessary industrial infrastructure - tariffs on imports were imposed. The US now applies a general 10 per cent import tax on all goods from each country, as well as various ‘reciprocal’ tariffs calculated by dividing US imports by exports. After imposing a 34 per cent tariff on Chinese products, China responded with its own 34 per cent tariff on all goods imported from the US. Unable to find alternative solutions, the Trump administration threatened to impose an additional 50 per cent tariff on all Chinese goods, which is set to take effect on April 8.
US data takes centre stage again this week, with the release of Consumer Price Index (CPI) data on Thursday. On Friday, producer price index (PPI) data and the University of Michigan (UoM) consumer sentiment survey are expected.
Investors are raising bets that the Federal Reserve (Fed) will begin cutting interest rates to reduce recession risks. Markets are factoring in nearly 200 basis points of rate cuts through the end of 2025, despite the Fed issuing cautious policy statements indicating that trade uncertainty complicates any potential rate cut.
Trade recommendation: SELL 1.0950, SL 1.1030, TP 1.0830
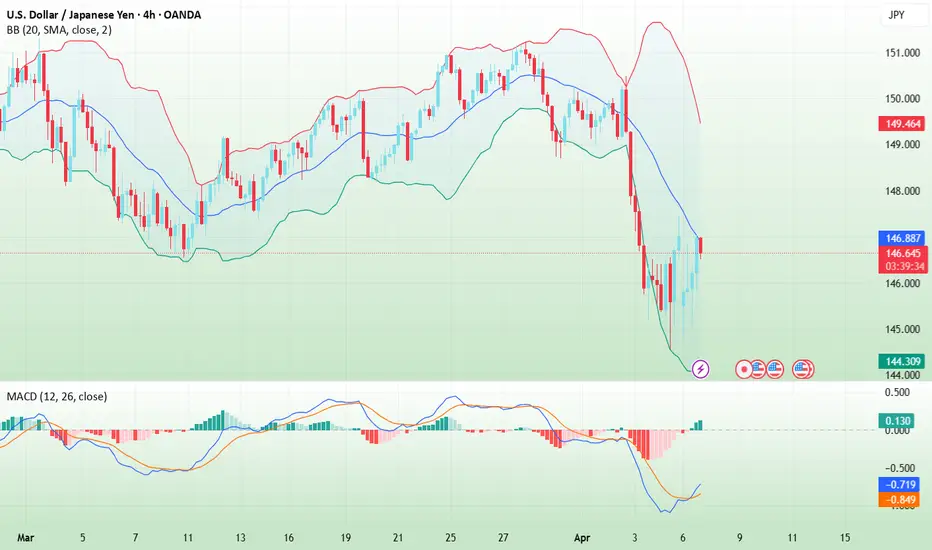
USD/JPY(20250408)Today's AnalysisToday's buying and selling boundaries:
146.92
Support and resistance levels
150.22
148.99
148.18
145.65
144.85
143.61
Trading strategy:
If the price breaks through 148.18, consider buying, the first target price is 148.99
If the price breaks through 146.92, consider selling, the first target price is 145.65

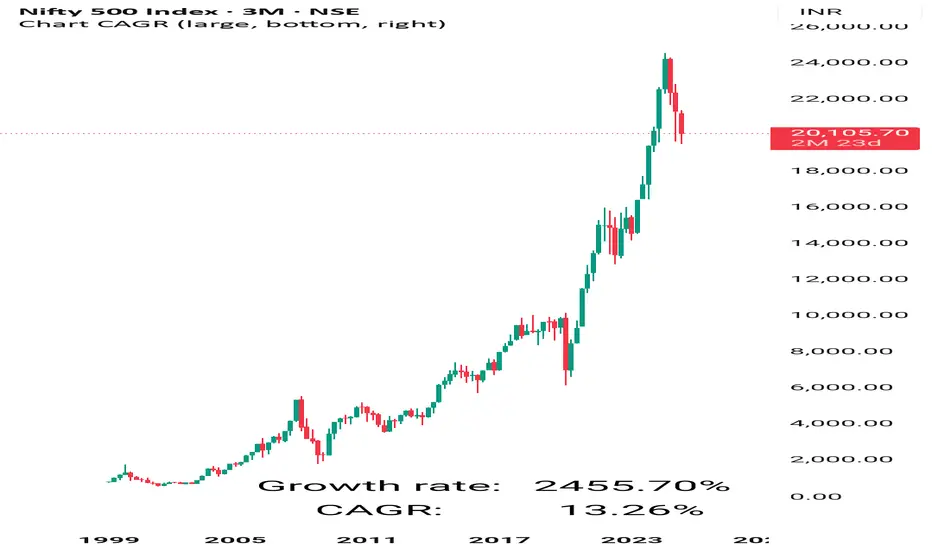
THE REALITY!You cant beat the Index fund in Long term growth....Compare your portfolio with Major Indices
Warren buffet Quote - You can't Beat S&P500 Index
Gold H1 projectionKey Points (Revised):
* Asset: Gold Spot / U.S. Dollar (XAUUSD)
* Timeframe: 1-hour chart
* Recent Price Action: A sharp upward move has occurred, reaching the red highlighted zone (potential resistance).
* Potential Reversal Zone: The red rectangular area between approximately 3009.643 and 3015.015 now appears to be acting as a resistance zone.
* Target Zone: The green rectangular area between approximately 2953.785 and 2944.180 is now the potential target for a downward move.
* Proposed Pattern: The price action suggests a potential rejection at the resistance zone, leading to a downward move.
Trading Idea (Revised):
The updated chart suggests a potential short (sell) trade opportunity. The idea is to enter a short position within or near the red highlighted zone (potential resistance), anticipating a downward move towards the green highlighted zone (potential support/target). This is based on the price reaching a potential resistance level and showing signs of rejection.

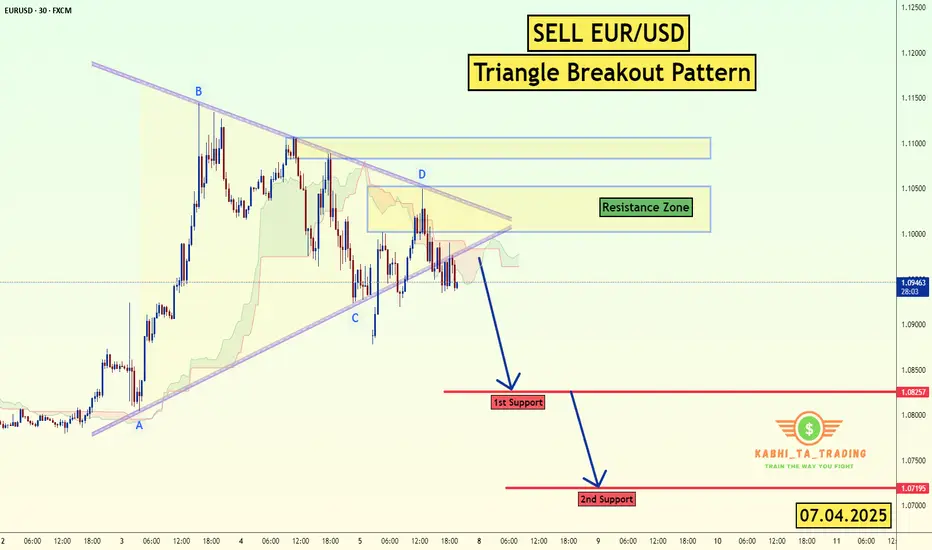
EUR/USD Triangle Breakout (07.04.2025)The EUR/USD Pair on the M30 timeframe presents a Potential Selling Opportunity due to a recent Formation of a Triangle Breakout Pattern. This suggests a shift in momentum towards the downside in the coming hours.
Possible Short Trade:
Entry: Consider Entering A Short Position around Trendline Of The Pattern.
Target Levels:
1st Support – 1.0825
2nd Support – 1.0719
🎁 Please hit the like button and
🎁 Leave a comment to support for My Post !
Your likes and comments are incredibly motivating and will encourage me to share more analysis with you.
Best Regards, KABHI_TA_TRADING
Thank you.
USD/JPY(20250407)Today's AnalysisMarket news:
Fed Chairman Powell: Wait for clearer news before considering adjusting policy stance. One year later, as the impact of Trump's policies becomes clearer, uncertainty should be greatly reduced. Intends to complete the entire term. Potential tariffs may have a lasting impact on inflation. The impact of tariffs on the economy may be greater than expected. Downside risks have increased, but the economy is still in good shape.
Technical analysis:
Today's buying and selling boundaries:
146.32
Support and resistance levels
149.17
148.11
147.41
145.22
144.53
143.46
Trading strategy:
If the price breaks through 146.32, consider buying, the first target price is 147.41
If the price breaks through 145.22, consider selling, the first target price is 144.53
High Risk, High Reward: Shorting ATH in a Bullish Copper Market.Copper just broke above its all-time high, triggering my short entry at 5.3010. While the macro trend is undeniably bullish, past price action has shown that each major high was followed by aggressive selloffs. This might not be the case this time – but that’s exactly why we have a stop-loss in place.
This is a tactical counter-trade: not about fighting the trend but playing a potential rejection from a psychological and technical key zone. Let’s see if history rhymes or the red metal keeps melting resistance!
Technicals:
• Daily timeframe breakout above ATH triggered the short at 5.3010.
• Strong vertical rally into major supply – parabolic move often cools down.
• Previous ATH levels have consistently attracted heavy selling.
• If price invalidates with a continuation above 5.61, the setup is out.
• Volatility around this zone is expected – precision and SL management are key.
Fundamentals:
1. Trump’s Proposed Copper Tariffs:
• Tariffs of up to 25% could disrupt global trade flow and introduce price instability.
• Market already priced in a bullish narrative, so any delay or uncertainty could spark a correction.
2. Panama’s Cobre Mine Shutdown:
• The mine accounts for 1% of global supply, and uncertainty around reopening may already be priced in.
• The government is holding off public visits, which adds operational risk but no clear bullish resolution yet.
3. China Smelter Closures:
• While bullish in nature, these are known factors – any shift or reversal from China could cool the demand-side speculation.
4. Overbought Sentiment:
• Prices surged rapidly, creating a gap between LME and NY copper prices, reaching record spreads.
• Speculative exhaustion could trigger a short-term pullback or deeper correction.
Risk-Managed Play. Let’s see if this time is different – or just the same old Copper story in a new macro wrapper.
Note: Please remember to adjust this trade idea according to your individual trading conditions, including position size, broker-specific price variations, and any relevant external factors. Every trader’s situation is unique, so it’s crucial to tailor your approach to your own risk tolerance and market environment.

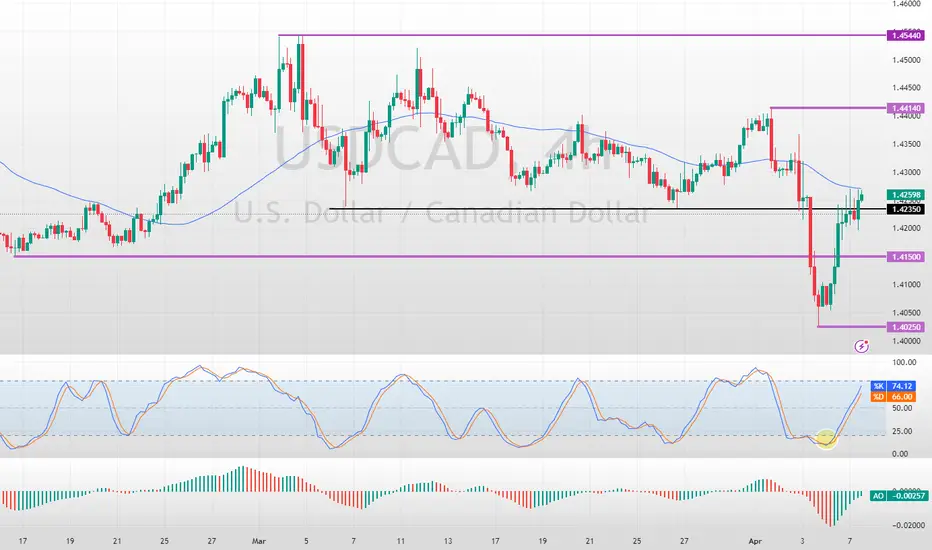
USDCAD Technical AnalysisFenzoFx—USD/CAD rose from 1.4025. The market outlook remains bullish if the price holds above 1.4150. In this scenario, the next bullish target will likely be the 1.4414 resistance.
A dip below 1.415 invalidates the bullish outlook with a bearish target at 1.4025.
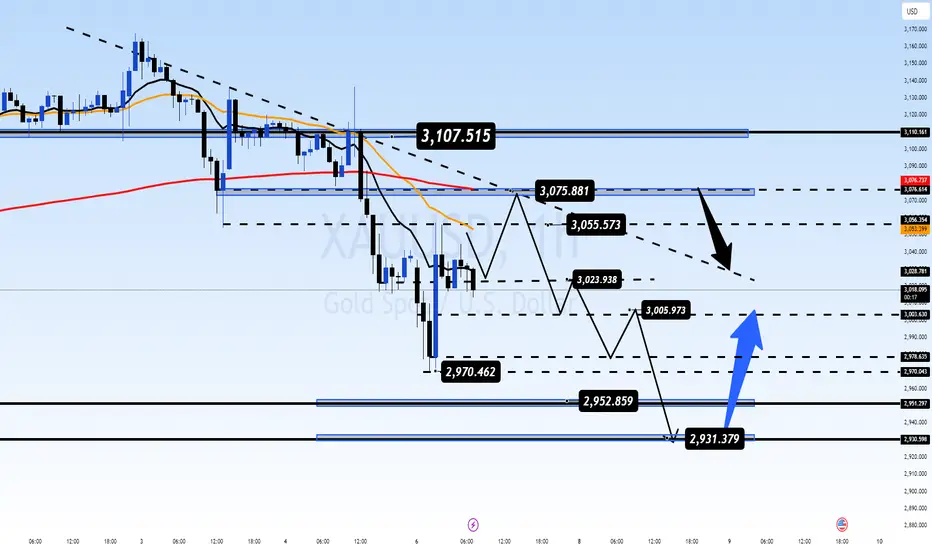
GOLD WEEKLY OPEN – Sentiment-Driven Marke🟡 GOLD WEEKLY OPEN – Sentiment-Driven Market as Asian Sellers Hit Early
Gold kicked off the new week with a sharp drop during the early Asian session, falling over 40 points from last week’s highs into the 297x zone — a move that reflects lingering sell-side pressure from last Friday’s close.
However, price quickly rebounded nearly 40 points, showing clear buy-side interest at the 297x zone — which acts as a key structural support on the H4 and D1 timeframes.
📌 If price breaks below this level convincingly, it could trigger a deeper move toward 295x.
🔍 Technical Breakdown:
The overall structure on H4 and D1 remains bullish
But right now, investor sentiment is leading, not just technicals
On H1 and H2, price is reacting to the 0.5 Fibonacci retracement zone
If gold closes below 3030, we could see another leg down into the 295x area
🧠 Sentiment Is In Control (For Now)
So far, only Asia and Australia have shown their hand
We’re waiting on London and New York to step in before confirming trend direction
With price whipping around inside a broad range — only trade from key zones with clear price reaction
🧭 Key Technical Zones:
🔺 Resistance:
3055 – 3076 – 3107
🔻 Support:
3024 – 3005 – 2970 – 2952
🎯 Trading Plan:
🟢 BUY ZONE: 2980 – 2978
SL: 2974
TP: 2984 – 2988 – 2992 – 2996 – 3000
🔴 SELL ZONE: 3076 – 3078
SL: 3082
TP: 3072 – 3068 – 3064 – 3060 – 3056 – 3050
📅 What To Watch This Week:
This week brings major market movers:
CPI → PPI → Fed speakers — all lined up midweek.
→ Be selective with your trades and keep tight risk control.
AD will continue updating intraday zones across sessions.
✅ Trade smart. Respect your risk. Let the market come to you.
— AD | Money Market Flow
EURUSD: Beginning of the week TrapBeginning of the week trap on EURUSD, seems like price is pulling back towards the previous high. However, I believe EU is still bearish and could get some bearish pushes.
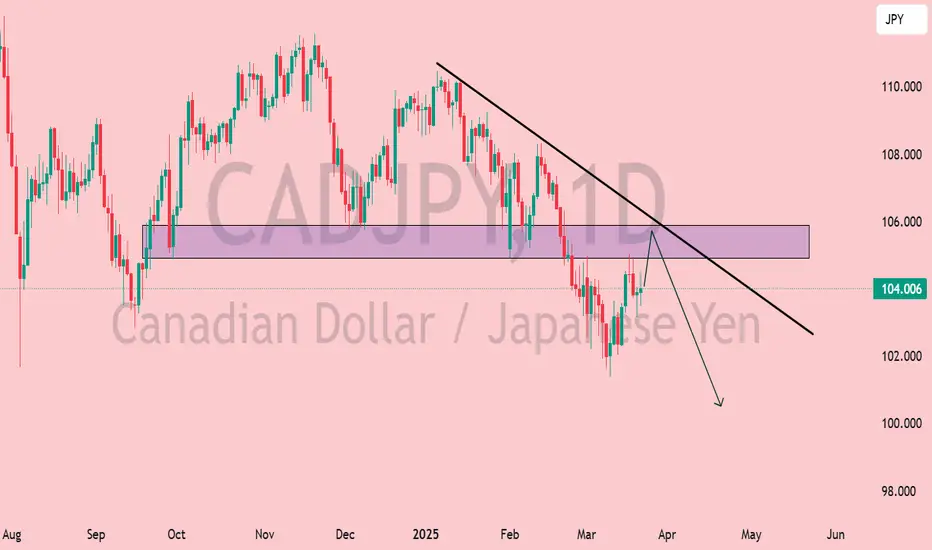
CAD/JPY Bearish Setup Near Resistance – Rejection Incoming?📉 Trend Analysis:
The pair is in a downtrend, confirmed by the descending trendline.
Lower highs and lower lows indicate bearish momentum.
📌 Key Levels:
Resistance Zone (104.5 - 106.0): Marked in purple, this area has previously acted as support and is now a key resistance zone.
Support Area: Around 100.0 - 101.0, a psychological level where price may find demand.
📊 Trade Scenario:
Bearish Rejection Expected: Price is approaching the resistance zone and trendline confluence. If rejection occurs, a downward move towards 100.0 is likely.
Break Above? If price breaks above the resistance zone and trendline, bullish momentum could invalidate the bearish setup.
🔍 Conclusion:
Watching for rejection near 105.0-106.0 to confirm a short opportunity.
If rejection happens, next targets are 102.0 → 100.0.
A bullish breakout above 106.0 could shift momentum upwards.
HelenP. I Euro will rise a little and then drop to support levelHi folks today I'm prepared for you Euro analytics. After breaking the structure of the previous downtrend, Euro showed a powerful bullish impulse, which allowed the price to exit the downward channel and move confidently higher. This breakout was supported by the trend line, which began to act as dynamic support throughout the rise. The bullish movement reached a local high near the 1.11 area before losing momentum. Soon after reaching that high, the price began to decline, pulling back to the area of the trend line and testing the support zone between 1.0950 and 1.0970. This zone aligns with Support 1 at the 1.0950 level and was already tested multiple times in recent price action. Although the trend line provided some temporary support, the strength of buyers has clearly faded. Currently, EUR/USD is trading just above the trend line, but price action suggests pressure is shifting back to the downside. Given the rejection from higher levels and the repeated tests of support, I expect the pair to decline further toward the 1.0950 target — my current goal. If you like my analytics you may support me with your like/comment ❤️

HelenP. I Bitcoin can rebound up from support zone to trend lineHi folks today I'm prepared for you Bitcoin analytics. Some time ago, BTC showed a strong downward move that brought the price into the support zone between 82200 and 80900 points. This area acted as a major demand zone, and after several retests, the price formed a solid base. From this support, BTC made a sharp bullish impulse, breaking through local resistance and heading toward the descending trend line. Eventually, the price reached the key resistance zone and tested the trend line, but failed to break through it. After that, BTC started to decline again and returned to the support zone around the 82200 level, where it is currently consolidating. At the moment, the price is trading near the lower boundary of the support zone. The strong reaction from this zone in the past and the overall price structure suggest that bulls are still active. Given the previous impulse move, the bounce from the support, and the clear target structure, I expect BTCUSDT to rise from the current level toward my goal at 87500 points. If you like my analytics you may support me with your like/comment ❤️
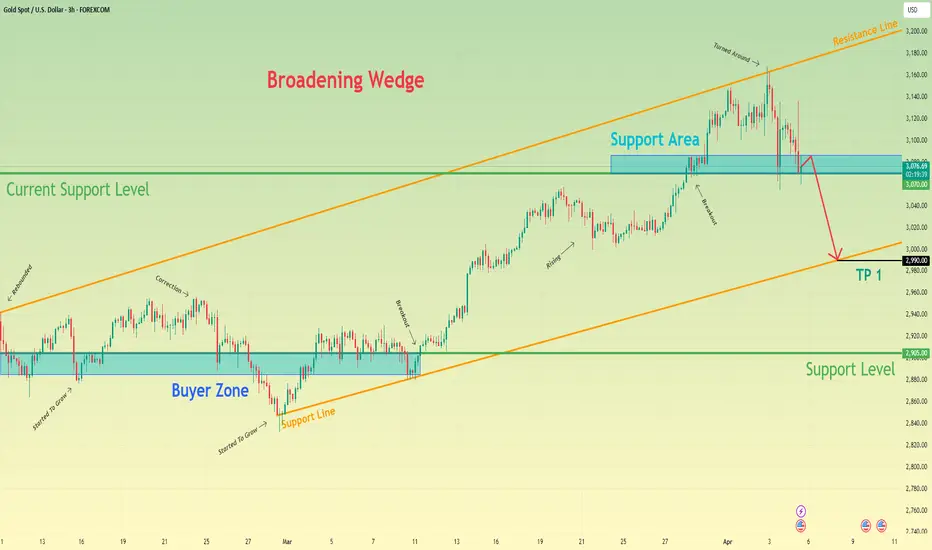
Gold may break support level and continue to decline nextHello traders, I want share with you my opinion about Gold. The price started to grow from the buyer zone between 2885–2905 points, forming a clean bullish impulse and entering a broadening wedge structure. During the uptrend, Gold made several rebounds from the support line and broke above the current support level at 3070, which later became a key point in the price structure. After reaching the resistance line of the wedge, the price turned around and began a downward correction. The decline brought it back into the support area between 3087–3070 points, but this zone has already failed to hold the momentum. Currently, XAU is trading below the upper boundary of the support area and showing clear signs of weakness. The breakout to the downside from the wedge structure has already taken place, and the price is starting to form a local pullback. I expect this pullback to be short-lived, followed by a continuation of the downward movement. My target for this move is the 2990 level, which aligns with the support line of the broadening wedge and serves as the next strong reaction zone. Given the failed rebound from resistance, the breakdown of the support area, and the structure of the broadening wedge, I remain bearish and expect Gold to continue declining toward TP 1 — 2990 level. Please share this idea with your friends and click Boost 🚀