XAUUSD-GOLD can still break upward ? read captionGold (XAU/USD) has just soared to a new all-time high, reflecting heightened investor demand for safe-haven assets amid economic uncertainties. The surge comes as global markets react to inflation concerns, geopolitical tensions, and shifting monetary policies, further strengthening gold’s position as a premier store of value. With central banks increasing their reserves and investors seeking stability, the precious metal continues to shine, marking a historic moment in the financial markets.
Analysis

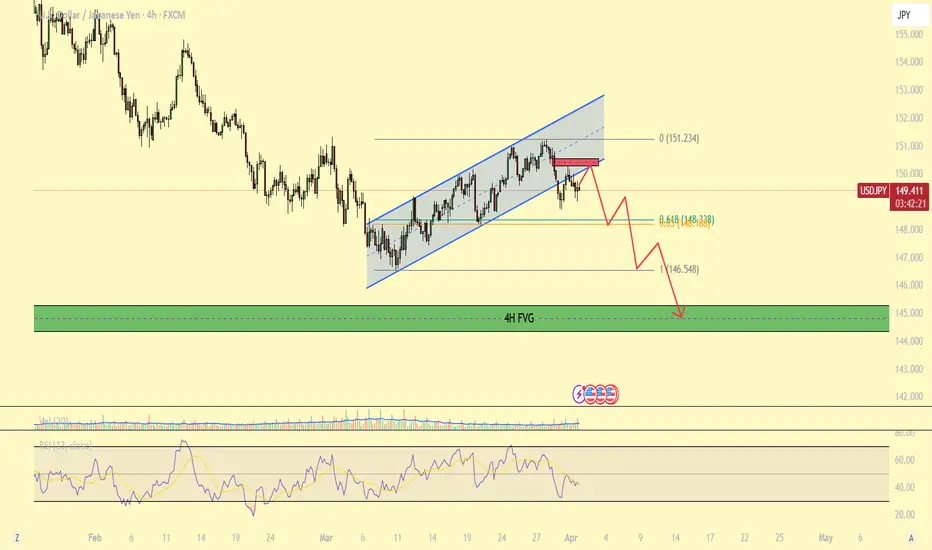
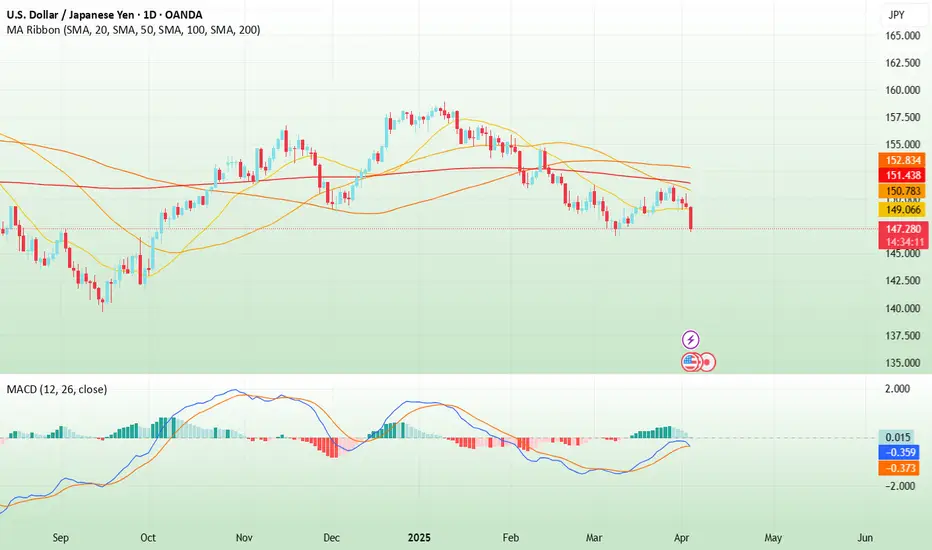
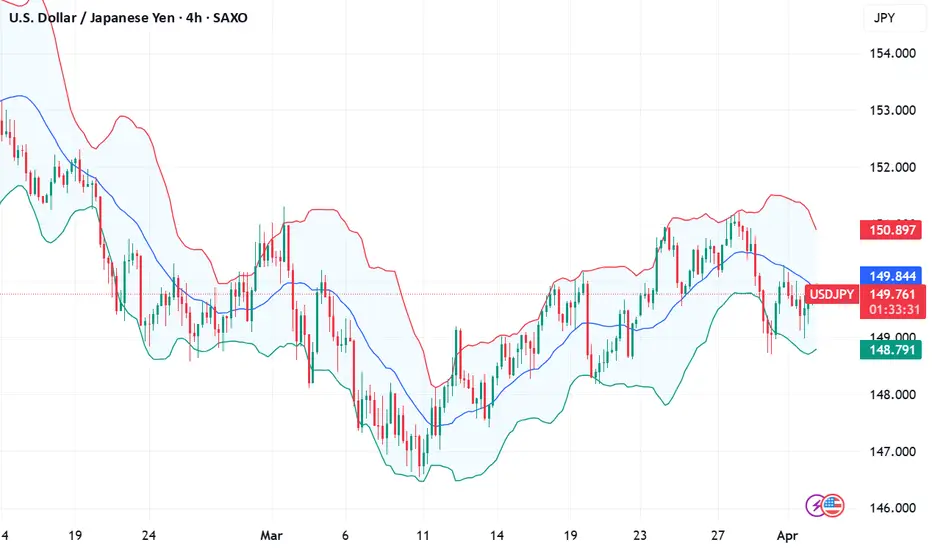
USD/JPY - Bearish breakdown signals further downside potential!The USD/JPY pair has been experiencing a clear daily downtrend, characterized by a bearish market structure and strong downward momentum. Sellers have remained in control, pushing prices lower as the pair continues to respect the prevailing bearish trend. With each failed attempt at recovery, the market structure reinforces the dominance of sellers, signaling that the path of least resistance remains to the downside.
Despite this overall downtrend, the 4-hour timeframe recently exhibited a rising channel, where price action formed higher highs and higher lows, suggesting a temporary bullish retracement within the larger bearish structure. However, this channel has now been broken, signaling a potential shift back toward the primary trend. A break of this nature often suggests that the bullish correction has exhausted its strength, and sellers are regaining control to push the price lower once again.
Following the breakdown of this rising channel, the price has failed to reclaim previous highs, instead forming a lower high—a strong indication that bearish pressure is resuming. Given this development, there is a significant possibility that USD/JPY could retrace toward key technical levels, such as the Golden Pocket (between the 0.618 and 0.65 Fibonacci retracement levels) or even the 4-hour Fair Value Gap (FVG) around 145.00.
Thanks for your support.
- Make sure to follow me so you don't miss out on the next analysis!
- Drop a like and leave a comment!
USD/JPY(20250404)Today's AnalysisToday's long and short boundaries:
146.84
Support and resistance levels
150.91
149.39
148.40
145.27
144.28
142.76
Trading strategy:
If the price breaks through 146.84, consider buying, the first target price is 148.40
If the price breaks through 145.27, consider selling, the first target price is 144.28
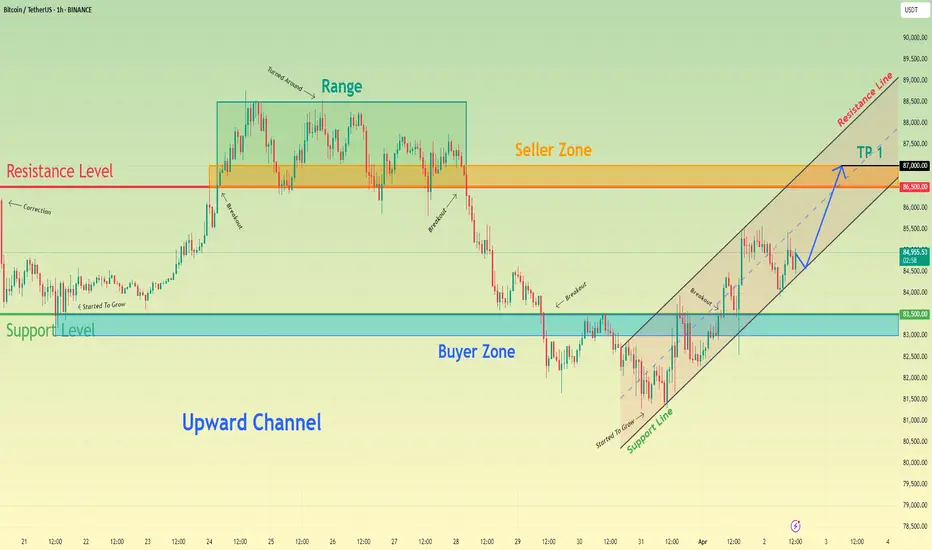
BITCOINS BIG MOVE IS COMING! I hope you guys did enjoy this trade idea; feel free to comment down below if you have any questions or comments.

Bitcoin may continue grow inside upward channel to seller zoneHello traders, I want share with you my opinion about Bitcoin. Looking at the chart, we can observe how Bitcoin corrected down to the support level, which also aligned with the buyer zone. From there, the price started to rise. It didn’t take long for BTC to reach the resistance level, which matched up with the seller zone. After breaking through that level, the price began consolidating within a range. Throughout this range, Bitcoin tested the upper boundary several times, but on the last attempt, it reversed and began to decline. The drop continued until it broke through the 86500 level, effectively exiting the range and pushing lower toward the next support. Once the price reached that area, it broke below the level and even dipped under the buyer zone, but quickly reversed and started climbing within an ascending channel. Inside this channel, BTC pushed up to the 83500 level, broke through it again, and maintained bullish momentum. At the moment, Bitcoin is trading within the channel, and I anticipate a potential correction back to the lower boundary of the channel, followed by continued growth toward the seller zone and a break of the resistance. For this scenario, my target is set at 87000 points. Please share this idea with your friends and click Boost 🚀
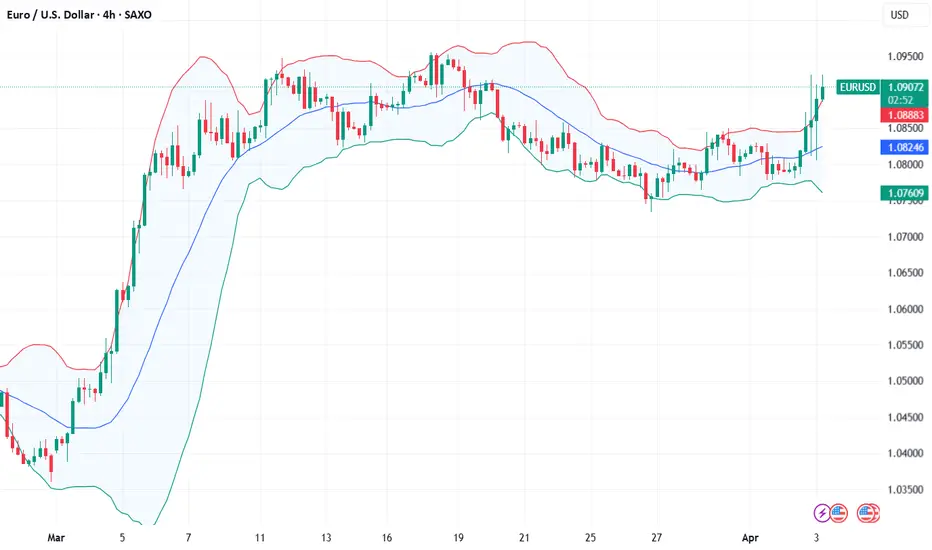
Euro will rise a little more and then make correction to 1.0950Hello traders, I want share with you my opinion about Euro. Earlier, the price started to grow from the lower region near 1.0730, where it bounced off the buyer zone between 1.0690–1.0730 points and entered a strong upward movement. This impulse helped Euro break through previous resistances and approach the upper boundary of the support area, which lies between 1.0950–1.0990 points. After reaching a local high, the price formed a pennant pattern, consolidating within narrowing trend lines while respecting both the support and resistance structure. During this phase, the pair remained stable, building pressure before making the next move. Recently, EUR made a strong breakout to the upside, exiting the pennant and continuing its bullish rally. The price surged rapidly and now trades above the current support level at 1.0950, reaching fresh highs in this local trend. I expect the price to reverse soon from the current overbought region and begin a decline toward the support area, which now acts as a potential pullback zone. My target for this corrective movement is the 1.0950 level, which aligns perfectly with the current support level and the upper boundary of the support zone. Please share this idea with your friends and click Boost 🚀

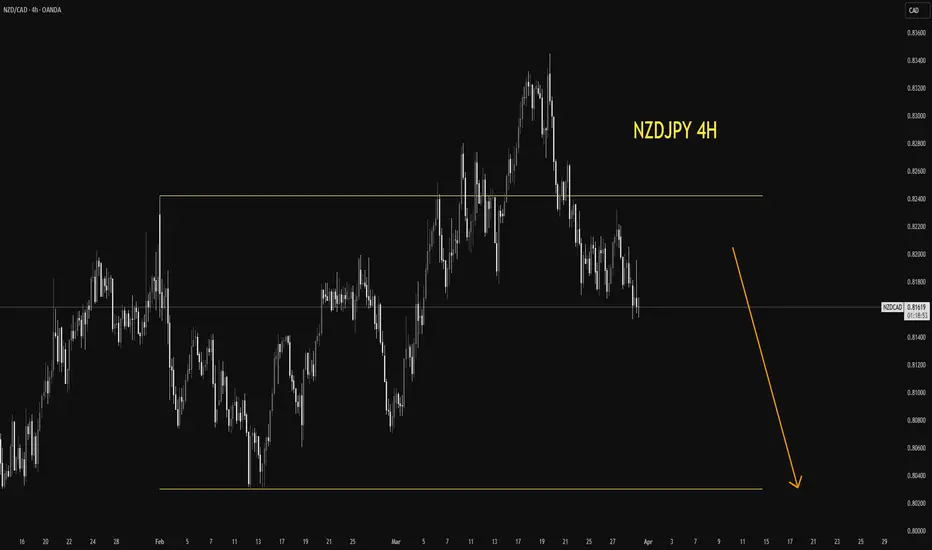
NZDJPY 4HNZDJPY 4h
Based on MMSM, IRL to ERL , weekly CRT and Order flow is bearish.
it's only my view though. Always check your analysis before taking trade. Thank you and happy trading .
IS THE GLOBAL “BIG SHORT” ON ITS WAY?TRADE WAR WARNING – IS THE GLOBAL “BIG SHORT” ON ITS WAY?
In the last 24 hours, global financial markets were rattled after Donald Trump unveiled a sweeping set of new global tariffs. This wasn’t just a political move — it may well mark the beginning of a new wave of global economic instability.
Markets across the board took a hit:
📉 US, European, and Asian equities
📉 Gold (XAU/USD), the US Dollar Index (DXY), and even crypto — all plunged into the red.
🔍 So, What Actually Happened?
Gold dropped by over 100 points in a single session — and strangely, the US dollar also fell.
Normally, a weaker USD would support gold. So why did gold sell off this time?
➡️ One likely explanation is that institutional investors sold gold positions to cover losses in equity markets, or to free up margin amidst the chaos.
📉 This wasn’t just a correction — it might be the early signal of a global BIG SHORT forming across multiple asset classes.
🧨 The Start of Something Bigger?
Markets aren’t just reacting to tariffs. They’re pricing in the risk of a full-scale trade war, which could disrupt global supply chains and hammer corporate earnings.
Industries like construction, healthcare, logistics, and manufacturing are already showing signs of strain.
If this escalates, we could be looking at something far more serious than a short-term sell-off.
📉 The Data Doesn’t Look Great Either
While inflation in the US continues to cool, other key data points are deteriorating:
ISM Services PMI (March): 50.8 (vs 53.0 expected)
Employment sub-index: 46.2 (down sharply from 53.9)
New orders, export orders and backlogs also fell
👉 These are real signs of economic slowdown, especially considering that services make up over 70% of the US economy.
🧠 Market Sentiment: FOMO, Fear, and Panic
At the moment, it’s hard to ignore how unsettled sentiment has become.
Retail and institutional traders alike are acting on fear. And that’s dangerous.
🔔 Tonight’s Non-Farm Payrolls (NFP) report could either calm things down — or add more fuel to the fire.
🏦 Will the Fed Cut Rates Sooner?
Markets are rapidly shifting their expectations:
A rate cut could come as early as May or June 2025
Traders are now pricing in 2 to 4 cuts this year (previously just 2)
There’s now a strong chance the Fed pivots earlier than expected
If jobs data continues to soften, the Fed may have no choice but to act faster — despite core inflation not yet fully under control.
⚠️ Trading Strategy: Observation Over Action
Right now, your best position might be… no position.
"Sometimes, the most profitable trade is the one you don’t take."
This isn’t the time to chase wild price action.
It’s the time to prepare and plan with logic — not emotion.
📊 Key Technical Levels on XAU/USD
🔺 Resistance:
3110 – 3119 – 3136 – 3148 – 3167
🔻 Support:
3086 – 3075 – 3055 – 3040 – 3024
🟢 BUY ZONE: 3056 – 3054
SL: 3050
TP: 3060 – 3064 – 3068 – 3072 – 3076 – 3080
🔴 SELL ZONE: 3148 – 3150
SL: 3154
TP: 3144 – 3140 – 3136 – 3132 – 3128 – 3124 – 3120
💬 Final Thoughts
The combination of tariffs, recession fears, and rate cut speculation is building into what could become a perfect storm.
Gold is in the eye of that storm.
Now is not the time to panic — but to trade with clarity and control.
📌 Don’t let emotion drive your trades.
Stick to the chart. Stick to your plan. Protect your capital.
🧠 Patience is what separates the lucky from the consistently profitable.

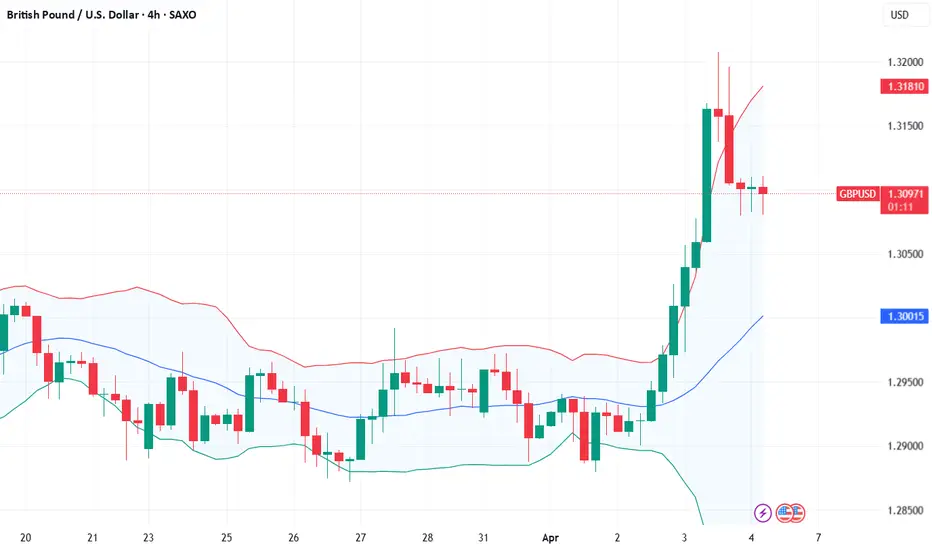
Fundamental Market Analysis for April 4, 2025 GBPUSDGBP/USD briefly broke above 1.32000 for the first time in six months on Thursday and climbed to fresh highs amid widespread weakness in the US Dollar. The Trump administration's reciprocal tariffs and flat tariffs knocked the legs out from under market sentiment, despite a delayed reaction to the tariff announcements that followed after US markets closed on Wednesday.
A fairly quiet calendar of economic publications is expected in the UK this week. However, investor attention will be focused on Friday's release of the US Non-Farm Payrolls (NFP) report. This data could have a major impact on market sentiment as the US economy enters a post-tariff phase. The March employment report is predicted to be a marker of sorts for the impact of the Trump administration's trade policies.
In addition, the ISM's US services business activity index (PMI) for March, released on Thursday, added to the negativity by falling to 50.8, its lowest level in nine months. The drop in the index was one of the fastest since the pandemic began. Weakening business activity and declining consumer optimism began before the tariffs went into effect, and are unlikely to normalize quickly anytime soon.
President Donald Trump approved the imposition of a 10 percent duty on all imports starting April 5, and the counter tariffs took effect on April 9. Analysts at Fitch Ratings believe U.S. GDP growth will be lower than the March forecast, which had previously been adjusted downward. The agency also warned that the effect of the tariff policy may affect the decisions of the Federal Reserve: the Fed may suspend the easing of monetary policy while it assesses the impact of duties on inflation and labor indicators.
Trading recommendation: BUY 1.30900, SL 1.30200, TP 1.32000
Non-Farm Payrolls – April 4: The key market driver!On Friday, April 4, 2025 at 3:30 PM EET, the U.S. Department of Labor will release one of the most anticipated macroeconomic reports — the Non-Farm Payrolls (NFP). This figure reflects the change in the number of jobs in the non-farm sector and is a crucial indicator of economic health. Strong numbers suggest economic expansion and may prompt the Fed to tighten monetary policy, while weak data could strengthen expectations of rate cuts — impacting stocks, the U.S. dollar, bonds, and commodities.
Historically, NFP reports have triggered significant market reactions, with sharp movements depending on the actual data versus expectations. Analysts forecast a moderate job gain, indicating a slowdown compared to recent months. The release comes amid uncertainty linked to new tariffs introduced by President Trump, which may affect business confidence and consumer spending. Investors are closely watching for signals on the economy’s direction and potential Federal Reserve actions.
How could NFP impact the markets?
• Stock market: Weak data could stoke recession fears, pressuring equities, especially in cyclical sectors. However, if seen as a reason for Fed easing, markets may rebound.
• U.S. Dollar: A disappointing report might weigh on the dollar as investors adjust their rate expectations. Strong figures, on the other hand, would support USD.
• Bonds: Slower job growth could drive demand for U.S. Treasuries, pushing yields lower.
• Gold: In case of weak data, gold may rally as a safe haven amid rising expectations of looser monetary policy.
Economists expect a job gain of around 140,000, lower than previous figures — a scenario that could increase market volatility. Get ready for big moves!
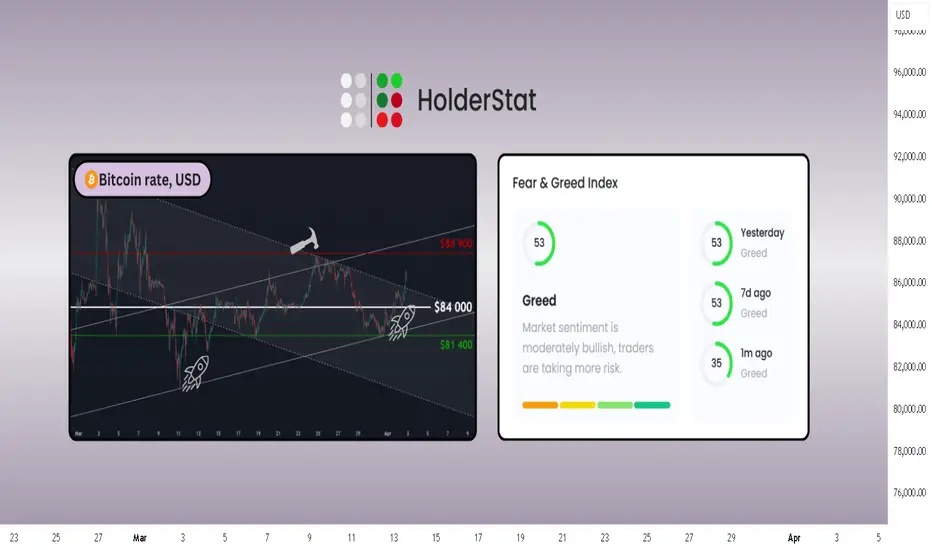
HolderStat | BTC daily digestBitcoin price today ~ FWB:83K (-5% 24h). BTC futures open interest down ~7%, funding +0.006% 📉
Wider market 🌐: Altcoins fell too (ETH -6%, SOL -12%). Sentiment is split – some shout #BuyTheDip, others urge caution.
📰 CoinDesk: Tariff news spooked crypto markets, fueling BTC’s drop. Meanwhile, whales (big holders) bought this dip 🐳 – a bullish sign.
🔍 Analysis: Traders remain cautious, but whale dip-buying shows big players bullish. Expect crypto bulls 🐂 and bears 🐻 to battle it out for now.
_____________________
📊 Want more useful analytics? Like and subscribe to stay up to date with the most relevant trading ideas!
Always DYOR! 🔬
XAU/USD Trendline Breakout (02.04.2025)The XAU/USD Pair on the M30 timeframe presents a Potential Selling Opportunity due to a recent Formation of a Trendline Breakout Pattern. This suggests a shift in momentum towards the downside in the coming hours.
Possible Short Trade:
Entry: Consider Entering A Short Position around Trendline Of The Pattern.
Target Levels:
1st Support – 3077
2nd Support – 3048
🎁 Please hit the like button and
🎁 Leave a comment to support for My Post !
Your likes and comments are incredibly motivating and will encourage me to share more analysis with you.
Best Regards, KABHI_TA_TRADING
Thank you.

GOLD - Price can decline to support area and then start to growHi guys, this is my overview for XAUUSD, feel free to check it and write your feedback in comments👊
Some time ago price traded inside a flat pattern, where it moved between support and resistance levels.
Then gold made fake breakout to the downside, but soon returned back and started to grow strongly.
It broke the upper line of the flat and entered a rising channel, forming a steady bullish movement.
Later price touched $3160 resistance and bounced down, making correction to $3070 support area.
Now gold trades inside rising channel and near $3070 level, showing signs of slowing the decline.
In my opinion, gold can bounce from support and reach $3160 resistance as the next upward target.
If this post is useful to you, you can support me with like/boost and advice in comments❤️

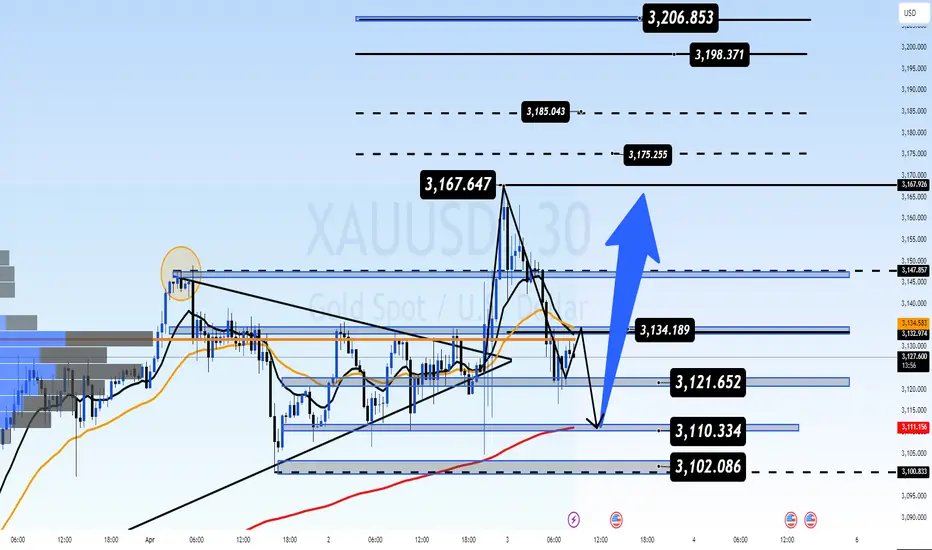
GOLD TRADING PLAN – After Breaking ATH & Sharp CorrectionGOLD TRADING PLAN – After Breaking ATH & Sharp Correction
🔥 Former U.S. President Donald Trump has officially announced a comprehensive global tariff policy, targeting multiple countries and regions. This sparked:
📉 A major sell-off in risk assets
💵 A sharp weakening in the U.S. Dollar
🪙 A strong rally in gold, reaching a new All-Time High (ATH) at 3167 as a preferred safe-haven asset
📉 Latest Market Reaction – Gold Corrects from ATH
After a strong bullish breakout, gold is now pulling back from its peak, driven by profit-taking and investor caution ahead of key economic data — including the upcoming Nonfarm Payrolls (NFP) report.
Despite the short-term pullback, the overall trend remains bullish on higher timeframes.
📐 Technical Overview
Yesterday, we identified and traded a symmetrical triangle pattern, which broke out sharply as expected. Now, price is retesting previous breakout zones — where new long opportunities may form.
📌 Focus on BUY setups during the Asian & EU sessions, and be cautious during the U.S. session due to expected volatility.
🔍 Key Technical Levels
🔺 Resistance Levels:
3167 (ATH) – 3175 – 3185 – 3198 – 3206
📝 (These are psychological levels & Fibonacci extensions. Wait for clear candle confirmation before entering.)
🔻 Support Levels:
3140 – 3132 – 3120 – 3112 – 3106 – 3100
🛒 TRADE PLAN
🟢 BUY ZONE: 3112 – 3110
🛑 Stop Loss: 3106
🎯 Take Profits: 3116 – 3120 – 3124 – 3128 – 3132 – 3136 – 3140
🔴 SELL ZONE: 3167 – 3169
🛑 Stop Loss: 3173
🎯 Take Profits: 3162 – 3158 – 3154 – 3150
⚠️ Final Notes
📈 The uptrend is still in play — no need to FOMO sell near the highs.
⏳ Be patient, wait for price to react at key support/resistance zones.
🚫 Avoid overtrading or rushing into trades — tariff news has major global impact.
📅 Stay sharp ahead of Friday’s NFP release — we'll reassess trend direction after the data.
✅ Stick to your risk management: follow your TP/SL strictly.
Wishing you safe & profitable trades! 💼📊
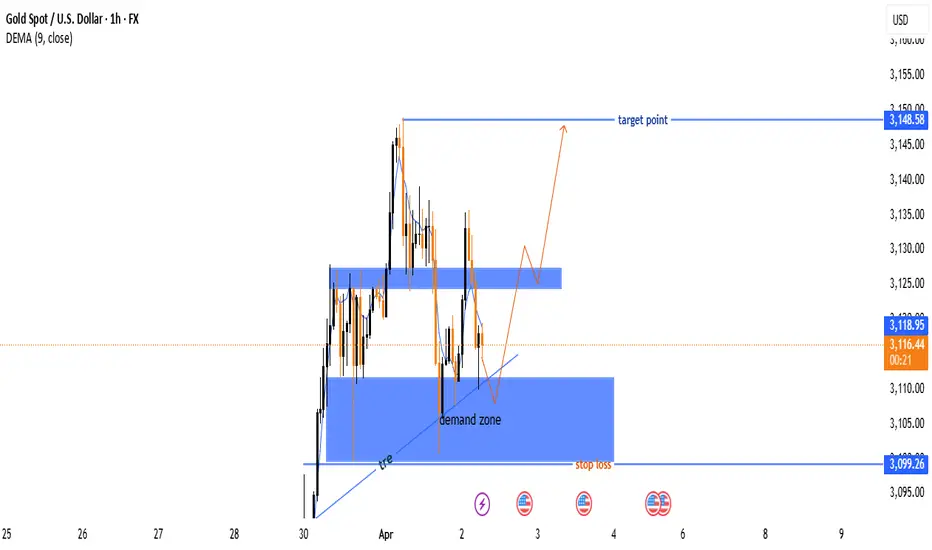
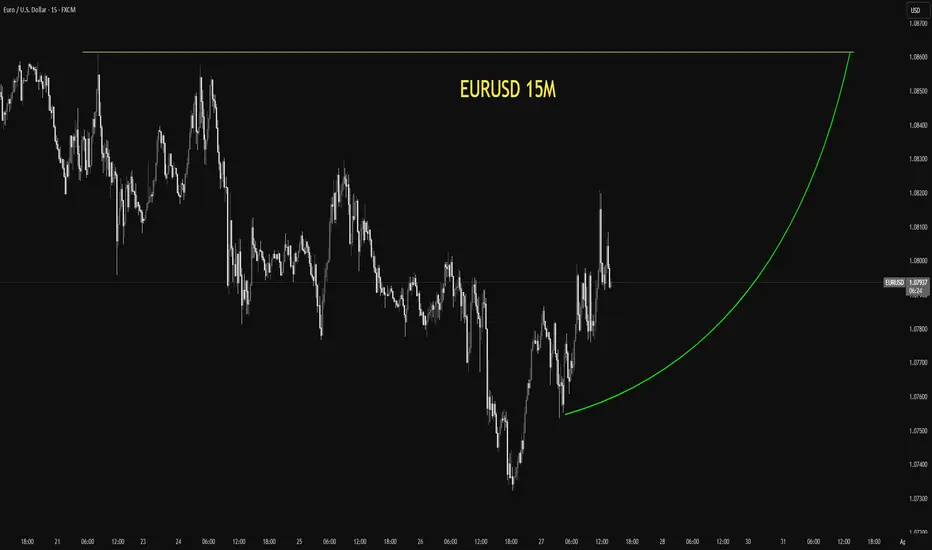
Gold (XAU/USD) : Bullish Setup with Key Demand Zone🔹 Trend Line & Demand Zone 📈
* The trend line shows an upward trend. 🚀
* The demand zone 🟦 acts as strong support, where buyers are likely to step in.
🔹 Price Action 🔍
* Price is bouncing off the demand zone ➡️ Bullish Signal 📊🔥
* Higher lows forming, indicating potential upward momentum.
🔹 Trade Setup 🎯
✅ Entry Point: Near the demand zone 🟦
❌ Stop Loss: 🔽 3,099.26 (Below demand zone)
🎯 Target Point: ⬆️ 3,148.58 (Key resistance area)
🔹 Expected Movement 🏆
* A slight pullback 📉 before a strong push up 📈💪
* If price holds the demand zone, 🚀 potential rally ahead!
🔹 Risk-to-Reward Ratio ⚖️
* Favorable trade setup ✅ High reward, controlled risk 🎯
🔹 Final Verdict 🔥
📊 Bullish Bias ✅ As long as demand zone holds!
🚨 Warning: If price breaks below 3,099.26, expect further downside!
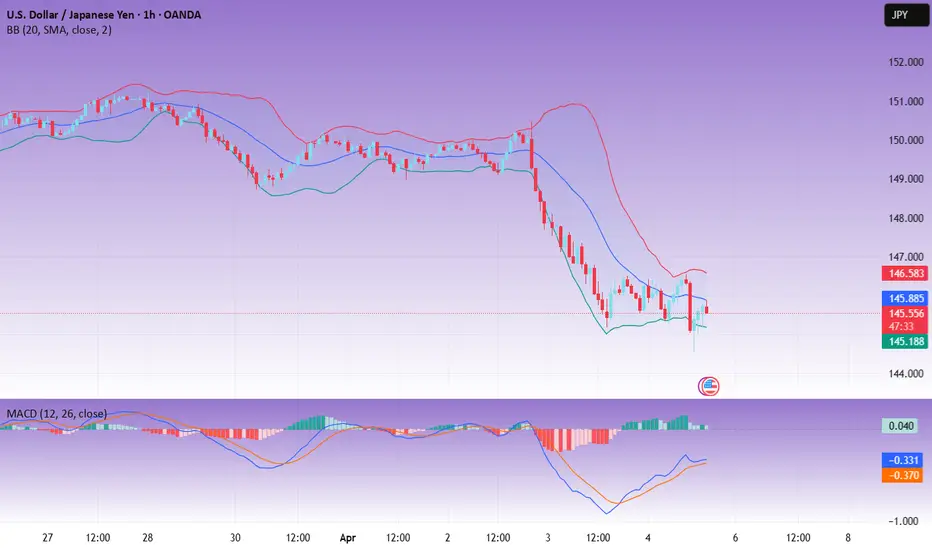
USD/JPY(20250403)Today's AnalysisMarket news:
US trade policy-① Trump signed an executive order to establish a 10% "minimum base tariff" for all countries, and will impose reciprocal tariffs, including 20% for the EU, 24% for Japan, 46% for Vietnam, and 25% for South Korea. The tariff exemption for goods that meet the USMCA will continue, and the tariff for those that do not meet the requirements will remain at 25%; ② The US Treasury Secretary called on countries not to retaliate; ③ The base tariff will take effect on April 5, and the reciprocal tariff will take effect on the 9th. In addition, the 25% automobile tariff will take effect on the 3rd, and the automobile parts tariff will take effect on May 3rd; ④ Gold bars, copper, pharmaceuticals, semiconductors and wood products are also not subject to "reciprocal tariffs".
Today's buying and selling boundaries:
149.61
Support and resistance levels
150.97
150.46
150.13
149.08
148.75
148.24
Trading strategy:
If the price breaks through 148.75, consider buying, the first target price is 149.08
If the price breaks through 148.24, consider selling, the first target price is 148.00
Fundamental Market Analysis for April 3, 2025 EURUSDEUR/USD saw a bullish spike on Wednesday after the Trump administration announced tariffs that were less severe than many investors expected given President Donald Trump's flurry of tariff threats over the past 72 days. While the specific tariff proposals are unclear, U.S. consumers should prepare for flat 10 percent tariffs on all imports, significant 25 percent tariffs on all automobiles and auto parts, and “reciprocal” tariffs imposed at different rates depending on the country.
In addition, Trump has reiterated his intention to impose additional tariffs on goods such as copper, microchips, and other important imported consumer goods that are vital to the U.S. economy. As these tariffs are likely to drive up consumer prices in the coming months and there is no obvious alternative in the market to obtain foreign goods without incurring high import duties, inflationary pressures are expected to rise soon and persist longer than desired. According to Federal Reserve (Fed) officials, the uncertainty of the Trump administration's trade policy is likely to keep interest rates elevated for an extended period beyond previous expectations.
European economic indicators are likely to remain moderately light for the rest of the trading week. Meanwhile, new US Non-Farm Payrolls (NFP) data is expected this Friday. The NFP report could have a significant impact on the markets as the US economy moves into a post-tariff phase, and the March labor statistics will be a key indicator of the impact of the Trump administration's tariff strategy.
Trading recommendation: BUY 1.09100, SL 1.08400, TP 1.10300
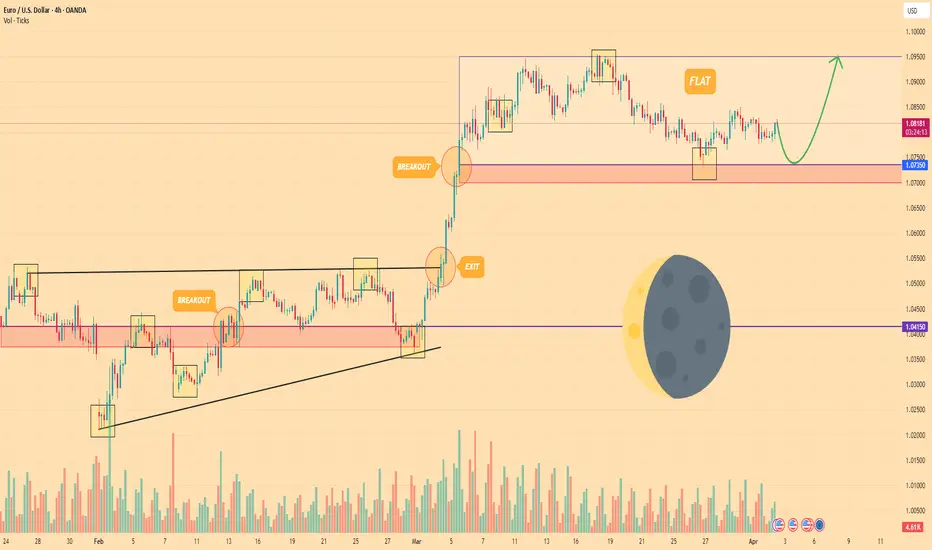
EURO - Price can bounce from support level to top part of flatHi guys, this is my overview for EURUSD, feel free to check it and write your feedback in comments👊
Some days ago, price entered a wedge pattern, bounced down from the resistance line to the support line, and broke the $1.0415 level.
Next, the price turned around and started to grow. In a short time, it rose to the $1.0415 level and broke one more time.
Then, price some time traded between resistance line with $1.0415 level and later corrected to support line of wedge.
After this, EUR made a strong upward impulse, thereby exiting from wedge pattern and starting to trades inside flat.
In flat, price reached top part and then made a correction movement to $1.0735 support level and turned around.
In my mind, Euro can correct to support level and then rise to $1.0950 top part of flat.
If this post is useful to you, you can support me with like/boost and advice in comments❤️
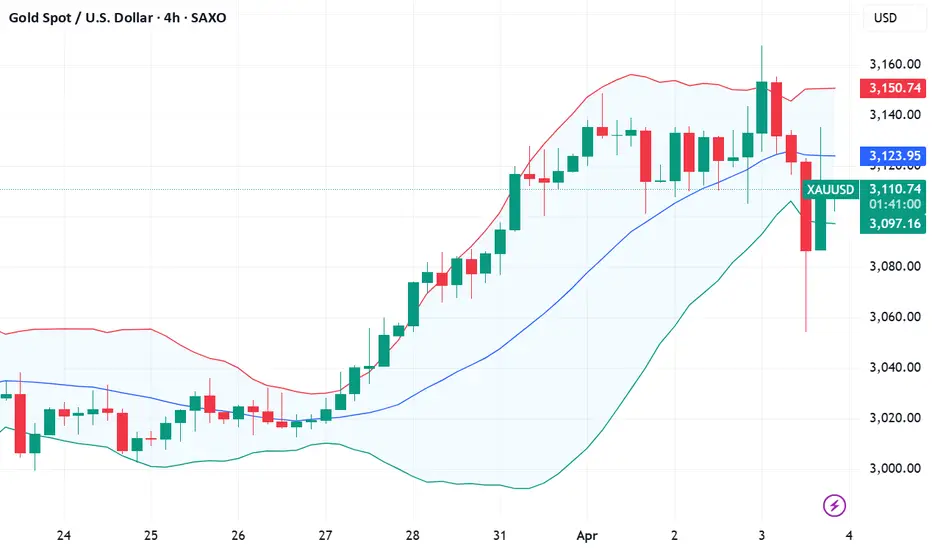
ADP in Focus: Will Strong Jobs Data Trigger Gold Pullback?🟡 GOLD MARKET BRIEF – Early Asian Surge Meets Resistance Ahead of Key US Jobs Data
Gold kicked off the day with a sharp rally during the Asian session, driven by consistent demand from Asian and Middle Eastern investors — a pattern we’ve seen forming repeatedly during early sessions lately.
However, price reacted swiftly at the 3130–3135 resistance zone, exactly as mapped out in yesterday’s trading plan. With sellers stepping in again, my outlook remains:
🔻 Look for reaction-based SELL opportunities in the Asian and London sessions, especially if price pulls back into key resistance.
📉 Technical Outlook:
Gold is approaching the apex of a symmetrical triangle pattern, suggesting a breakout is imminent.
✅ As always: Wait for the breakout — then trade the retest in the confirmed direction.
📰 Fundamental Focus:
All eyes today will be on the US ADP Non-Farm Employment report, which tends to offer early clues ahead of Friday’s NFP.
Should the data come in stronger than expected, USD could gain traction — likely applying downward pressure on Gold, in line with our target zone around 308x–307x.
🧭 Key Technical Levels:
🔺 Resistance: 3128 – 3135 – 3142 – 3148
🔻 Support: 3110 – 3100 – 3080 – 3070
🎯 Trade Plan:
🟢 BUY ZONE: 3102 – 3100
SL: 3096
TP: 3106 – 3110 – 3114 – 3118 – 3122 – 3126 – 3130
🔴 SELL ZONE: 3148 – 3150
SL: 3154
TP: 3144 – 3140 – 3136 – 3132 – 3128 – 3124 – 3120
📌 Caution: With ADP on deck during the US session, expect a spike in volatility.
Stick to clear levels, protect capital, and trade with discipline — not emotion.
Let the market come to you.
— AD | Money Market Flow

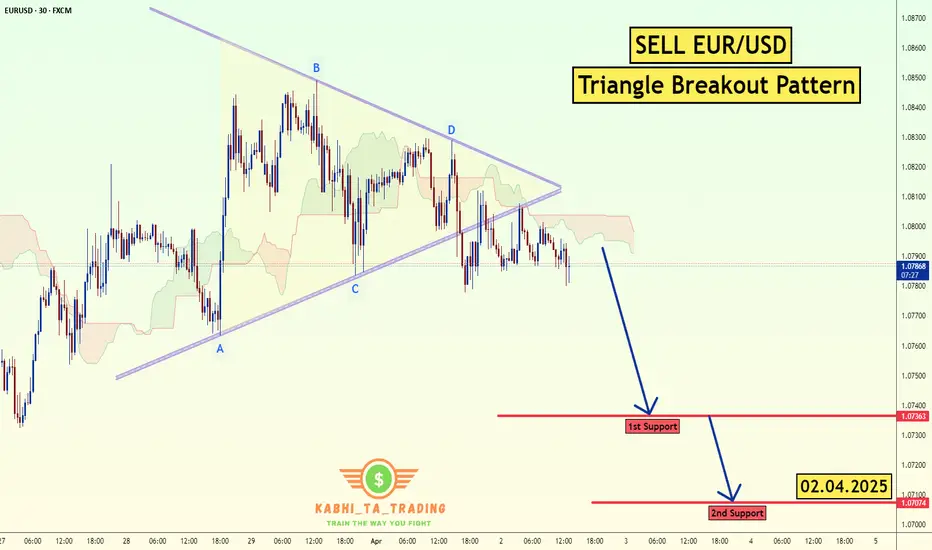
EUR/USD Triangle Breakout (02.04.2025)The EUR/USD Pair on the M30 timeframe presents a Potential Selling Opportunity due to a recent Formation of a Triangle Breakout Pattern. This suggests a shift in momentum towards the downside in the coming hours.
Possible Short Trade:
Entry: Consider Entering A Short Position around Trendline Of The Pattern.
Target Levels:
1st Support – 1.0736
2nd Support – 1.0707
🎁 Please hit the like button and
🎁 Leave a comment to support for My Post !
Your likes and comments are incredibly motivating and will encourage me to share more analysis with you.
Best Regards, KABHI_TA_TRADING
Thank you.
Fundamental Market Analysis for April 2, 2025 USDJPYThe Japanese Yen (JPY) fails to capitalise on the previous day's modest gains against its US counterpart and attracts fresh sellers during Wednesday's Asian session. The USD/JPY pair, however, remains in the range it has been in since the beginning of this week as traders await a new catalyst before positioning for the next leg of directional movement. As such, attention will remain focused on US President Donald Trump's announcement of retaliatory tariffs later today.
Meanwhile, speculation that the slowdown in the economy caused by the tariffs may force the Bank of Japan (BoJ) to keep policy steady for now is undermining the yen. However, investors seem convinced that the BoJ will continue to raise interest rates amid signs of rising inflation in Japan. This is a significant divergence from the growing confidence that the Federal Reserve (BoJ) will resume its rate-cutting cycle in June, and should support the lower-yielding Japanese Yen.
Trade recommendation: SELL 150.00, SL 150.90, TP 148.60
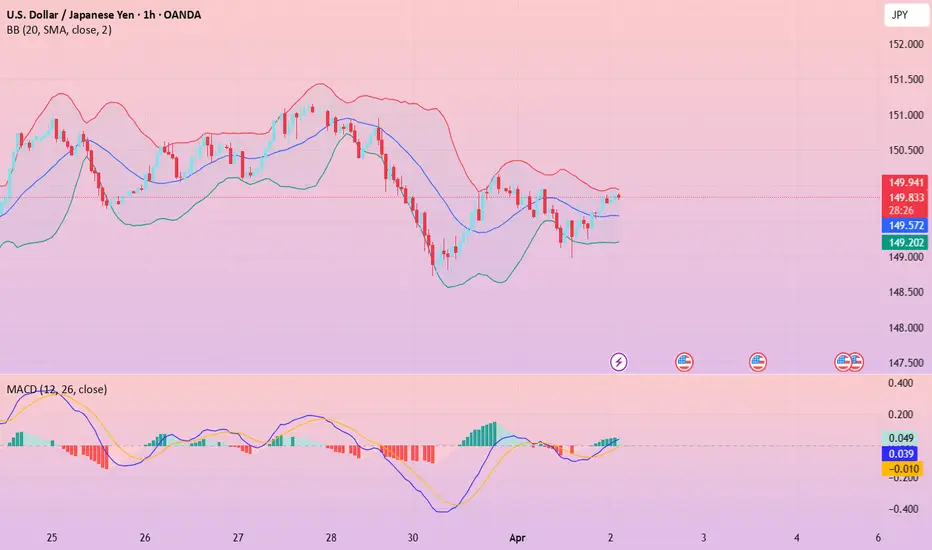
USD/JPY(20250402)Today's AnalysisToday's buying and selling boundaries:
149.55
Support and resistance levels
150.70
150.27
149.99
149.11
148.83
148.40
Trading strategy:
If the price breaks through 149.99, consider buying, the first target price is 150.27
If the price breaks through 149.55, consider selling, the first target price is 149.11