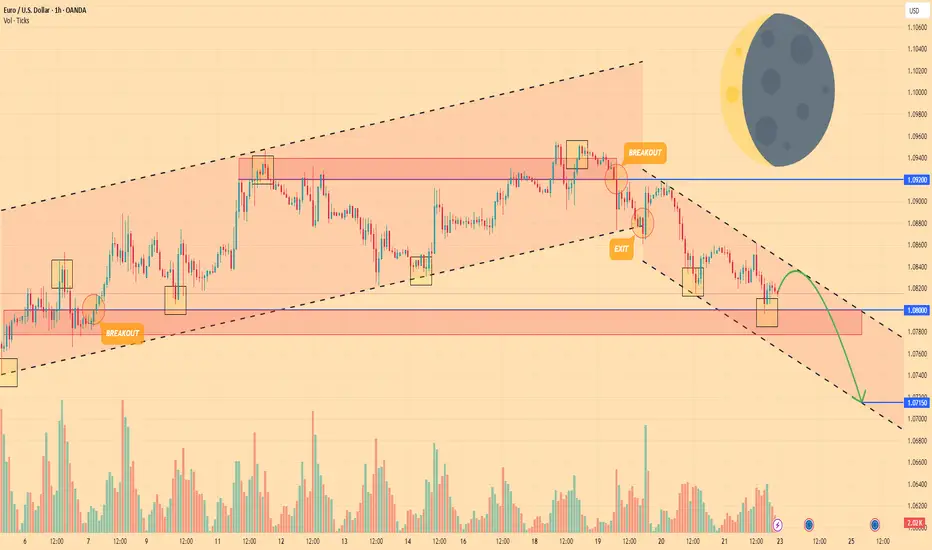
EURO - Price can break support level and continue to move downHi guys, this is my overview for EURUSD, feel free to check it and write your feedback in comments👊
Some time ago price reach and broke $1.0800 level and started to grow inside a rising channel pattern.
It reached the resistance level, bounced down, made correction to support and then rose up once again.
Euro touched $1.0920 level second time and turned around, after which exited from this rising channel.
Then price dropped fast and formed falling channel, breaking through $1.0920 level and reaching $1.0800 level.
After that it bounced up a little, but stayed inside the bearish channel without breaking resistance line.
Now price moves between support and resistance, but in my mind it can decline to $1.0715 support line.
If this post is useful to you, you can support me with like/boost and advice in comments❤️
Analysis
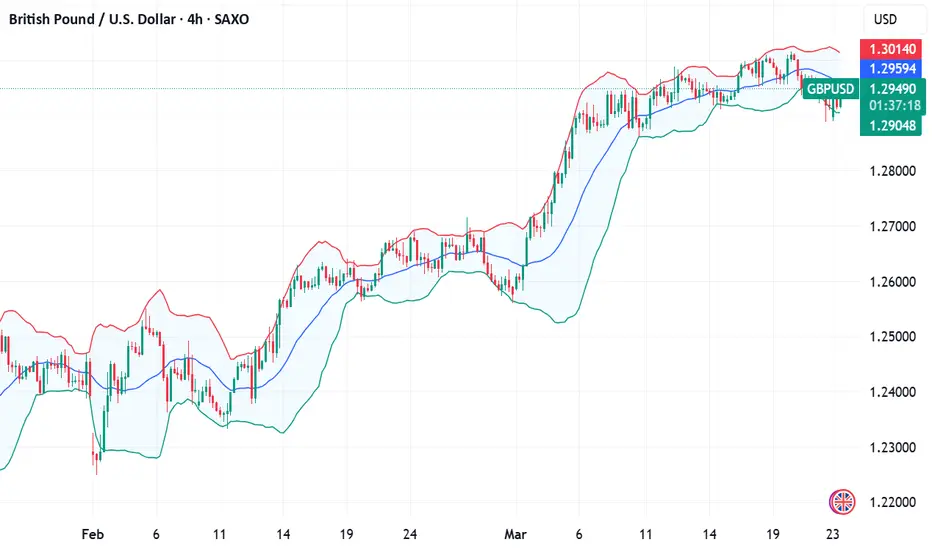
Fundamental Market Analysis for March 24, 2025 GBPUSDThe GBP/USD pair continues to hold below the round 1.2900 mark and is attracting buyers in the Asian session on Monday.
The US Dollar (USD) started the new week on a weak note and halted its three-day recovery from multi-month lows, which in turn is seen as a key factor acting as a tailwind for the GBP/USD pair. Despite the Federal Reserve (Fed) raising its inflation forecast, investors seem convinced that a tariff-induced slowdown in the US economy could force the central bank to resume its rate-cutting cycle in the near future.
In fact, the UK central bank has cautioned against assumptions of rate cuts and has also raised its forecast for inflation to peak this year. This suggests that the Bank of England will reduce borrowing costs more slowly than other central banks, including the Fed, which lends further support to the GBP/USD pair.
Moving forward, traders are awaiting the release of flash PMI indices from the UK and the US for meaningful momentum. In addition, speeches from influential FOMC members will stimulate demand for the dollar, which, along with comments from Bank of England Governor Andrew Bailey, should create short-term trading opportunities for the GBP/USD pair.
Trading recommendation: BUY 1.2930, SL 1.2850, TP 1.3060
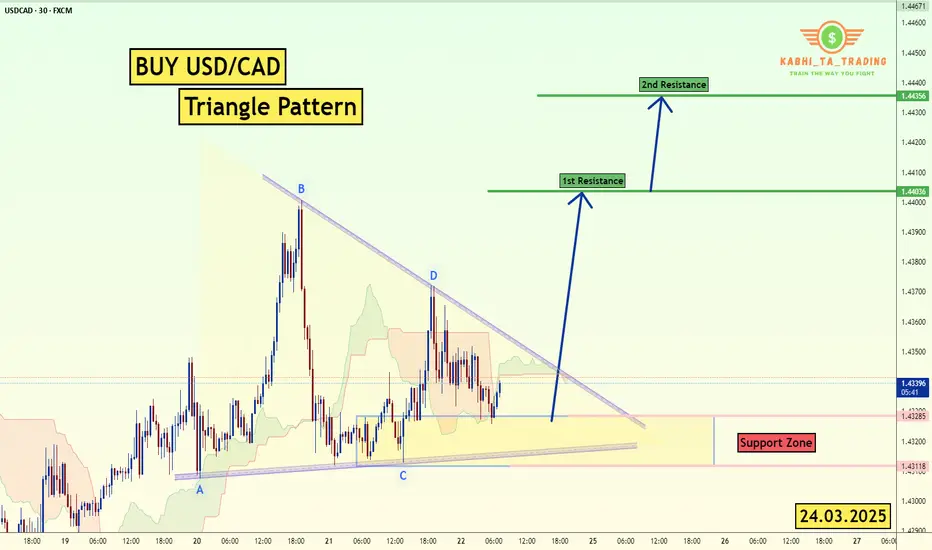
USD/CAD Triangle Pattern (24.03.2025)The USD/CAD pair on the M30 timeframe presents a Potential Buying Opportunity due to a recent Formation of a Triangle Pattern. This suggests a shift in momentum towards the upside and a higher likelihood of further advances in the coming hours.
Possible Long Trade:
Entry: Consider Entering A Long Position around Trendline Of The Pattern.
Target Levels:
1st Resistance – 1.4403
2nd Resistance – 1.4435
🎁 Please hit the like button and
🎁 Leave a comment to support for My Post !
Your likes and comments are incredibly motivating and will encourage me to share more analysis with you.
Best Regards, KABHI_TA_TRADING
Thank you.
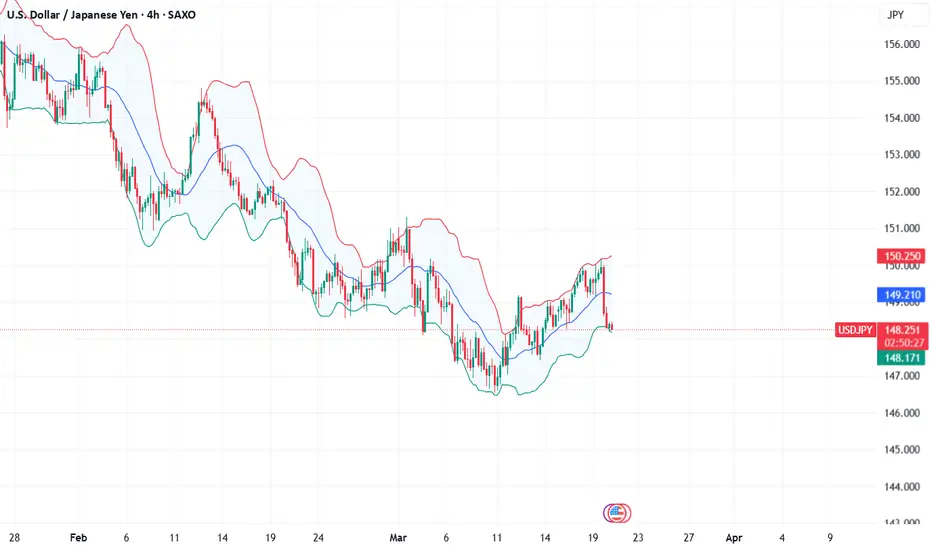
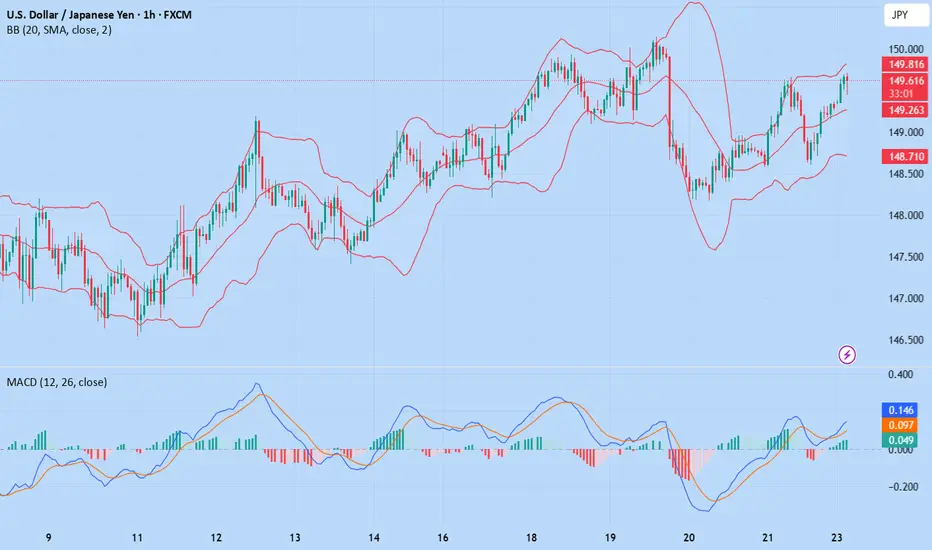
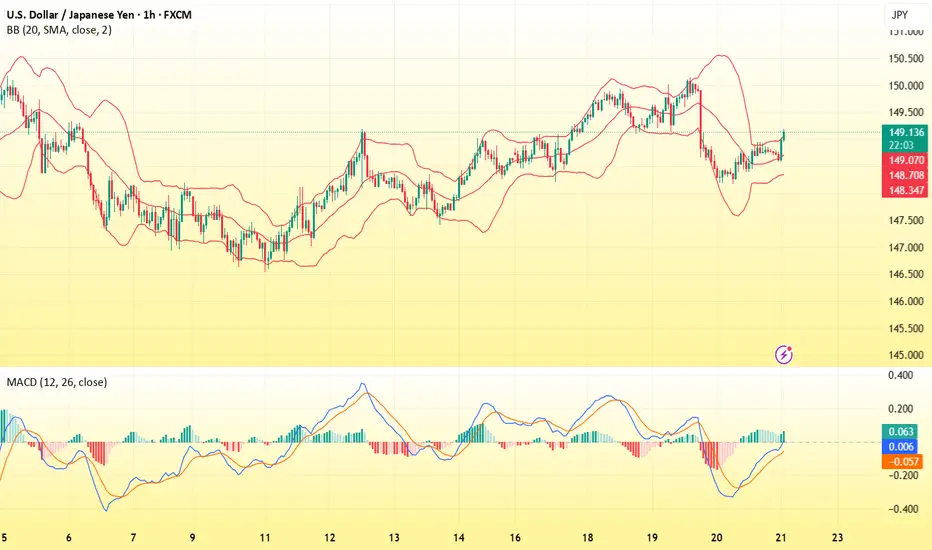
USD/JPY(20250324)Today's AnalysisToday's buying and selling boundaries:
149.18
Support and resistance levels:
150.25
149.85
148.59
148.77
148.51
148.11
Trading strategy:
If the price breaks through 148.59, consider buying, the first target price is 149.85
If the price breaks through 149.18, consider selling, the first target price is 148.77
WHAT WILL BE THE NEXT MOVE OF GOLD ?🚀 GOLD (XAU/USD) – High-Probability Trade Setups! 🚀
Hey, traders! Hope you're all geared up for another exciting week in the markets! 🏆 As we get ready for the market open, let’s break down what’s next for Gold (XAU/USD).
📊 Last Week’s Recap
📈 Gold hit 3057, but before the market closed, we saw a strong rejection pushing price back down. Now, Gold is stuck in a range between 3024 resistance and 3020 support—meaning we need a breakout before taking action!
💡 No-trade zone = 3020 - 3024 ❌ Stay out until a breakout happens!
Two Possible Trading Scenarios
🔵 Scenario 1: Buy Above 3024
📌 If a 30M candle closes above 3024, we wait for the next candle to wick down while keeping the previous low safe.
📌 Once price breaks the high of the previous closed candle, we enter buys targeting 3034! 🚀
✅ Break-even after 40 pips—lock in those profits! 💰
🔴 Scenario 2: Sell Below 3020
📌 If a 30M candle closes below 3020, we wait for the next candle to wick up while keeping the previous high safe.
📌 Once price breaks the low of the previous closed candle, we enter sells targeting 3011! 📉
✅ Break-even after 40 pips—protect your capital!
📍 Final Trade Plan
📊 BUY above 3024 🎯 TP: 3034
📊 SELL below 3020 🎯 TP: 3011
📢 Don’t chase trades! Let the market confirm and follow the plan! 📈🔥 #XAUUSD #GoldAnalysis #ForexTrading #SmartMoney

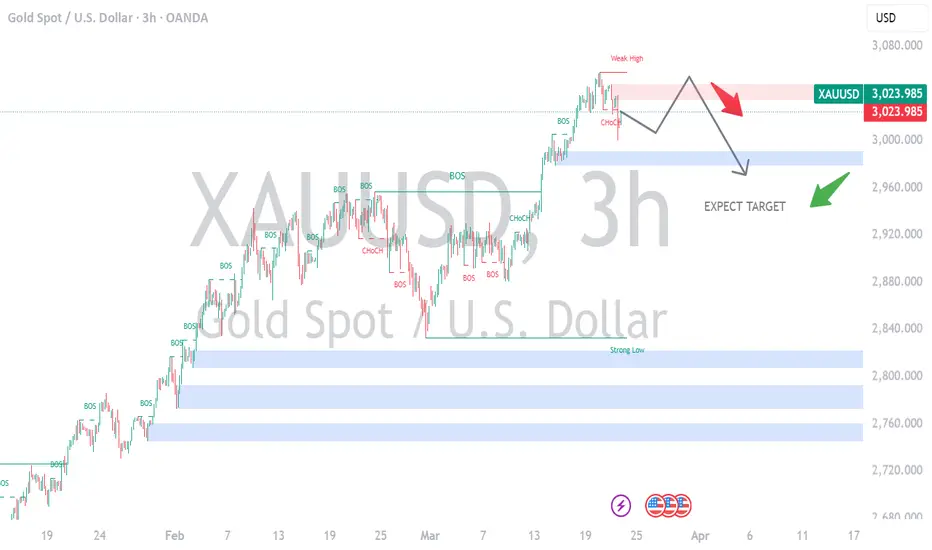
XAUUSD- short term downtrend H3 continue, sidewayGold Short-Term Downtrend (H3):
Gold is showing bearish momentum on the 3-hour chart, forming lower highs and lower lows. Sellers remain in control unless key resistance levels are broken. Watch for potential support around recent swing lows.
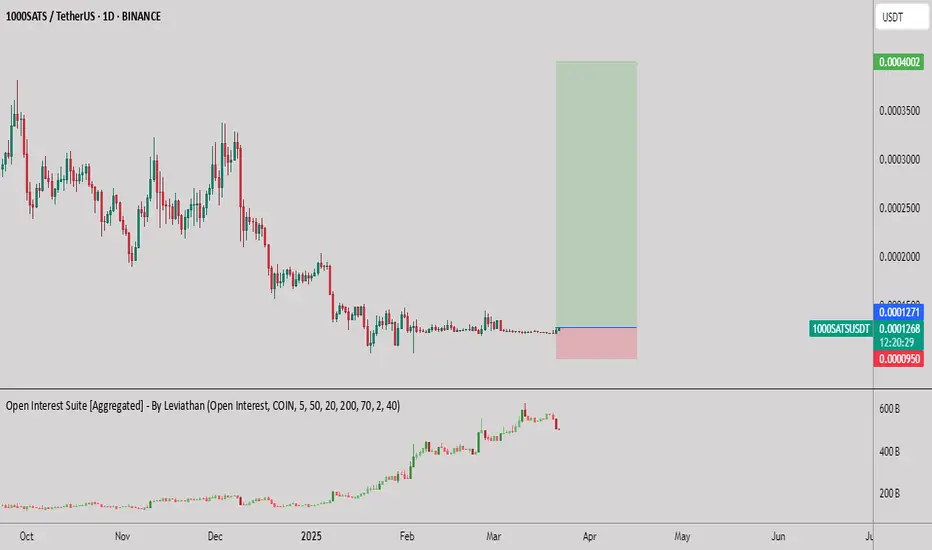
1000SATS/USDT (Binance - 1D Chart)📍 Timeframe: 1D (Binance Exchange)
📈 Current Price: 0.0001268 (+1.93%)
Key Technical Insights:
Accumulation & Breakout Setup:
Price has been consolidating at a low volatility range for several weeks.
Potential breakout setup is forming, as indicated by the bullish structure.
Support & Resistance Levels:
Support: 0.0000950 (Stop-loss region)
Current Resistance: 0.0001271 (Breakout Level)
Major Target: 0.0004000 (Upside target)
Risk-to-Reward Setup:
A clear risk-to-reward setup is visible on the chart.
Stop-loss placed below 0.0000950, targeting 0.0004000.
Risk/Reward Ratio: ~3.5:1 (High reward potential).
Open Interest Analysis:
Open Interest (OI) surged significantly before showing a slight decline.
A decline in OI while price remains stable suggests short liquidations or weak hands exiting before a potential move.
Trading Strategy:
Bullish Entry: Long positions above 0.0001271 with a stop below 0.0000950.
Breakout Confirmation: A daily close above 0.0001300 strengthens bullish sentiment.
Profit Targets:
First Target: 0.0002500
Second Target: 0.0004000
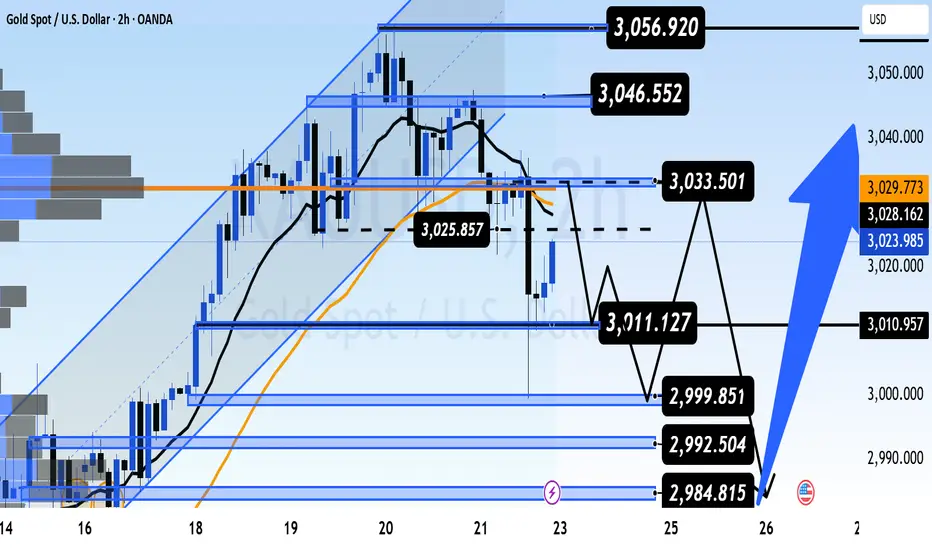
xAUUSD Structure, Sentiment & Strategic Patience📊 XAUUSD WEEKLY INSIGHT | Structure, Sentiment & Strategic Patience
As we close out a volatile trading week, let’s zoom out and assess what’s really happening with gold. The recent price action on the higher timeframes is revealing important signals — and it’s time to take a strategic pause before the next move.
🔍 WEEKLY SNAPSHOT:
Gold experienced a sharp correction of over $50, followed by a late-session recovery into the weekend. The result?
✅ Long upper wicks on both the W1 and D1 candles,
✅ Signs of rejection from all-time highs,
✅ Yet price still managed to close above the 50% candle body range — momentum is cooling, but not reversing (yet).
The big question now is:
Is this a healthy pullback within the uptrend… or the beginning of something deeper?
📐 Key Takeaways:
Structure on higher timeframes remains bullish – price is still moving within the primary ascending channel
Short-term retracement has reached the 0.5–0.618 Fibonacci zone on H1 and H2 – a potential decision area
End-of-week buying indicates positioning by informed participants, not random volatility
No confirmation of a major reversal yet – but conditions are developing
📌 Key Levels to Watch:
Resistance Zones: 3025 – 3033 – 3040 – 3046 – 3056
Support Zones: 3014 – 3005 – 3000 – 2993 – 2986
🧠 Mindset Going Into Next Week:
Don’t rush it.
Let Monday’s open reveal the volume story — whether through gaps, spikes, or clean structure. The best setups form after the market shows its hand, not before.
This is where strategic patience beats emotional trading.
📣 Final Note:
Stay focused on structure. Respect your levels. Watch how price reacts — not just where it goes.
And remember: sometimes no trade is a powerful trade when the market is indecisive.
More insights coming soon on market psychology and execution discipline.
💬 Feel free to leave a comment, follow for updates, or share your own views below.
Wishing everyone a strong and clear start to the new week,
— AD | Money Market Flow
HelenP. I Bitcoin may break support level and fall to trend lineHi folks today I'm prepared for you Bitcoin analytics. A few days ago, the price made a small upward move before dropping to Support 2, which aligned with the support zone, breaking through Support 1 in the process. After that, BTC attempted to rise but failed and continued to decline, breaking Support 2 and reaching the trend line. Following this move, Bitcoin reversed direction and started to climb, soon reaching the 80100 level and breaking it again. It then pushed up nearly to Support 1 before correcting back to Support 2, after which it made a strong impulse move back to Support 1. The price consolidated around this level for some time before correcting back to the trend line, from where it resumed its upward movement. In a short time, BTC broke through Support 1, climbed to 87500, and then corrected back to the support zone. At this stage, I expect BTCUSDT to pull back to the support level, make a small upward move, and then continue declining, breaking the support level. If this scenario plays out, I anticipate the price falling to 83000, which aligns with the trend line. If you like my analytics you may support me with your like/comment ❤️

GOLD - Price can decline to support area and then start to growHi guys, this is my overview for XAUUSD, feel free to check it and write your feedback in comments👊
Recently price started to decline to falling channel and soon reached $2880 level and then rose to the resistance line.
Then price bounced and in a short time declined to support line of the channel breaking $2880 level.
But soon, Gold bounced from line and broke $2880 level again and some time traded near resistance line.
Next, price made a correction to $2880 level and then started to grow and soon exited from falling channel.
After this Gold reached $3025 level, broke it, and is now traded near this level, which coincides with support line.
So, in my opinion, Gold can decline to support area and then it bounce up to $3085, breaking the support line.
If this post is useful to you, you can support me with like/boost and advice in comments❤️

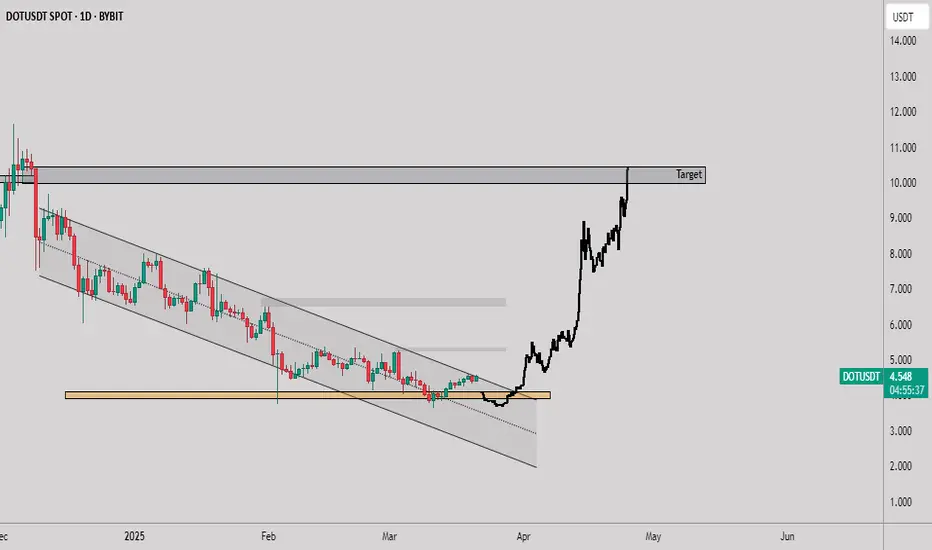
DOT/USDT (Bybit - 1D Chart)📍 Timeframe: 1D (Bybit Exchange)
📈 Current Price: $4.550 (+3.43%)
Key Technical Insights:
Descending Channel Breakout:
DOT had been trading in a descending channel since late 2024.
A successful breakout from the channel indicates a trend reversal.
Strong Support Retest & Bounce:
The price found support at the $4.00 region (marked in yellow).
Multiple tests of this level suggest strong demand and potential accumulation.
Major Resistance & Upside Target:
The next key resistance zone is around $10.00 (marked as "Target").
If momentum continues, a move towards $12.00–$14.00 is possible.
Possible Price Path:
The projected price movement (black line) suggests a retest of support before a rally.
If price holds above $4.20–$4.30, further bullish continuation is expected.
Trading Strategy:
Bullish Entry: Consider long positions on a retest of $4.20–$4.30 with a stop below $4.00.
Breakout Confirmation: A daily close above $5.00 strengthens the case for an upward push.
Profit Targets: $7.00, then $10.00, and extended targets at $12.00–$14.00.
HelenP. I Euro will decline to 1.0710, breaking support levelHi folks today I'm prepared for you Euro analytics. Euro recently tested the Support Zone, but buyers couldn't push the price higher. After a weak reaction, the price started to decline, showing that sellers are still strong. Now, it is trading near this support area, and I expect further downward movement. If sellers maintain pressure, EUR could break below the Support Zone and decline toward 1.0710 points, which coincides with the trend line. This level will be crucial—if the price bounces, we might see a local rebound, but if it breaks, a deeper drop could follow. Looking at past price action, we can see that the trend line has acted as strong support multiple times. However, each test weakens the level, increasing the chances of a breakdown. If the price reaches 1.0710 points, I will watch how it reacts. A clear breakdown could push EUR/USD lower, potentially toward 1.0425 (Support 2). For now, I anticipate a decline to 1.0710 points, where the price will decide its next move. My goal remains at 1.0710 points. If you like my analytics you may support me with your like/comment ❤️

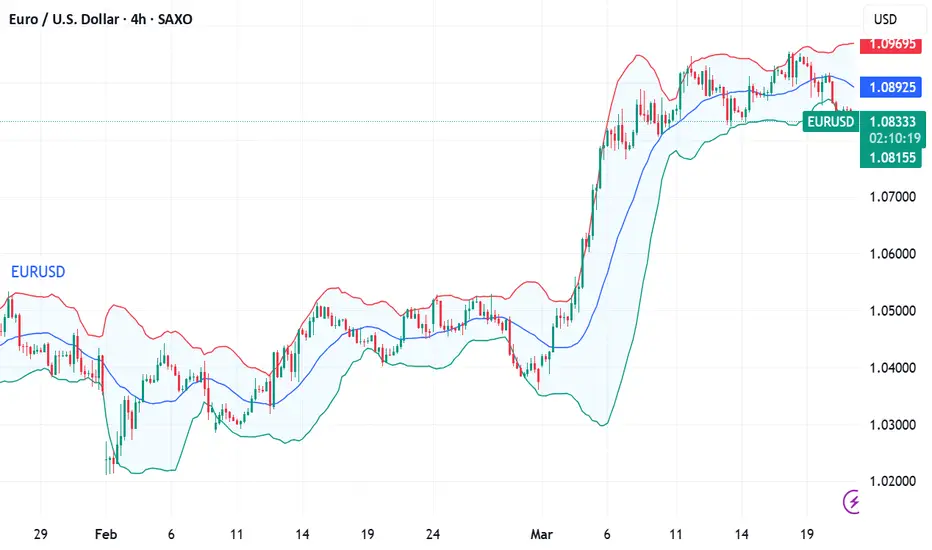
Euro can rebound from mirror line and start to move upHello traders, I want share with you my opinion about Euro. This chart illustrates how the price started trading within a range, where it initially corrected to the buyer zone and reached the mirror line. After that, it began to rise and, in a short time, moved up to the upper boundary of the range, which coincided with both the support level and the support area. Next, the price reversed and dropped back to the buyer zone, breaking through the mirror line. However, EUR soon resumed its movement within the range and eventually reached the upper boundary again. After consolidating near this area for a while, it made a slight correction before rebounding to the mirror line. Later, the Euro broke out of the range and eventually breached the mirror line, reaching the current support level, which aligned with the seller zone. Although it briefly rose after breaking this level, it recently reversed and fell back into the seller zone. At this point, the Euro might test the mirror line before starting to move upward, exiting the seller zone. Based on this, my TP is set at 1.1050. Please share this idea with your friends and click Boost 🚀

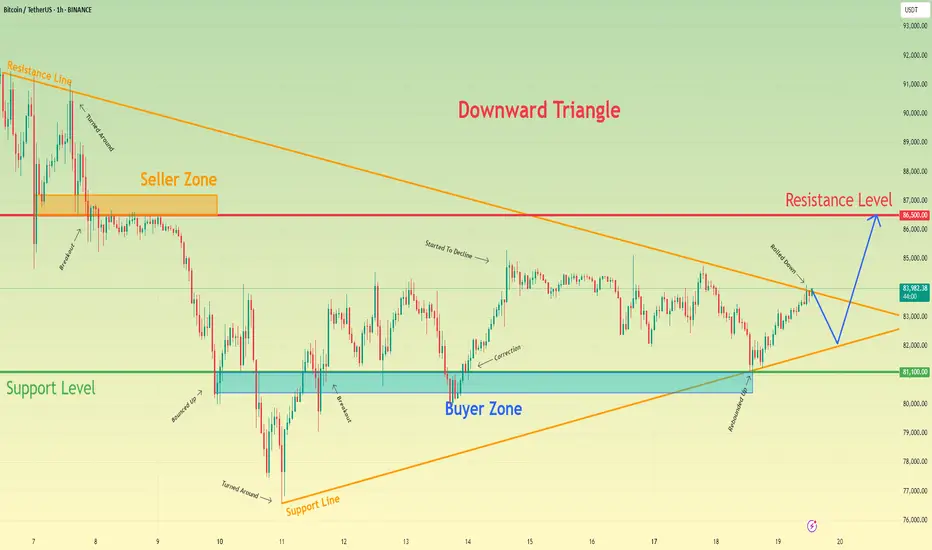
Bitcoin can exit from triangle and rise to resistance levelHello traders, I want share with you my opinion about Bitcoin. On the chart, we can see that the price entered a downward triangle, where it rebounded from the resistance line and dropped to the resistance level. After that, BTC bounced from the 86500 level, climbed back to the resistance line of the triangle, and then started to decline. Soon, it broke through 86,500 and reached the support level, which coincided with the buyer zone. BTC then broke this support and dropped further to the support line of the triangle before reversing and beginning to rise. In a short time, the price reached 81100, broke through it, and made a retest before continuing its upward movement. However, it later corrected back to the buyer zone, then climbed to 85000, and started declining again. Shortly after, the price dropped to the support level and then rebounded to the resistance line of the triangle. Given this price action, I expect BTC to correct toward the support line of the triangle before bouncing back up and breaking out of the pattern. From there, I anticipate further growth toward the 86500 resistance level, which is why I have set my TP at this level. Please share this idea with your friends and click Boost 🚀
Gold can continue to grow inside upward channelHello traders, I want share with you my opinion about Gold. This chart shows how the price initially rebounded from the support level, which aligned with the buyer zone, but soon reversed and dropped back down to the support line. After hovering near this line, the price entered a triangle pattern, where it bounced off the resistance line and fell to the support line, breaking below the support level. Following that move, the price reversed upward and returned to the buyer zone, where it consolidated briefly before declining again to the support line. From there, it bounced and began to climb. Shortly after, the price broke through the 2915 level and eventually exited the triangle pattern. From that point, the price started trending upward within an ascending channel, reaching the current support level, which overlaps with a key support area, before rising to the resistance line of the channel. Recently, the price pulled back to the support zone once again, and I believe there’s a good chance it will decline a little below from this area and continue its upward move within the channel, aiming for the resistance line. For this scenario, my TP is set at 3080. Please share this idea with your friends and click Boost 🚀

Solana’s Cup-and-Handle Setup: A Bullish Trap or Opportunity?Recent analysis suggests Solana (SOL) is forming a large cup-and-handle pattern, with a potential false breakout on the fifth wave before a flash crash in mid to late April. Some traders believe this correction could set the stage for a stronger breakout on the seventh wave, possibly pushing SOL past its current pattern high and toward the upper boundary of a broadening wedge formation. Despite short-term volatility, this multi-year structure supports a long-term bullish outlook.
In the near term, market structure remains uncertain, with SOL facing downward pressure despite bouncing from $120. While this level has historically been strong support, the depth of the correction and multiple broken levels suggest caution. Analysts remain divided on the next move—some expect consolidation between $120 and $180, while others warn of a potential drop to $80 if market conditions worsen. Monitoring key support and resistance levels will be crucial for traders navigating the next phase.

BITCOIN - Price can bounce up to $87K, breaking resistance levelHi guys, this is my overview for BTCUSDT, feel free to check it and write your feedback in comments👊
Price entered to wedge and at once dropped to support line, breaking two levels, after which it bounced up.
Soon, it broke $80200 level and then tried to grow, but failed and made a correction to $80200 support level.
Later BTC rose to $85400 level and then some time traded near, after which it turned around and corrected to support line.
Then price in a short time rose to resistance line of wedge, breaking the resistance level, but a not long time ago fell back.
Bitcoin broke $85400 level and continued to decline, and in my mind, it can soon reach support line of wedge.
After this movement, I expect that BTC can bounce up to $87000, breaking resistance level.
If this post is useful to you, you can support me with like/boost and advice in comments❤️

Fundamental Market Analysis for March 21, 2025 EURUSDFederal Reserve (Fed) Chairman Jerome Powell downplayed the danger to the economy from US President Donald Trump's tariff threats, which seem to exist in a quantum state where they both exist and don't exist at the same time. According to Fed Chairman Powell, downside risks have certainly increased thanks to repeated tariff threats, but Fed policymakers continue to insist that US economic data remains strong, albeit off recent highs.
The Federal Reserve Bank of Philadelphia's (Fed) manufacturing activity survey for March fell to 12.5 m/m, down from the previous reading of 18.1 and down for the second month in a row, but held the brakes and fell less than the median market forecast of 8.5. US weekly initial jobless claims also rose less than expected at 223,000 new jobless claimants, up from 220,000 the previous week. Investors had expected the figure to be 224k. Sales of existing homes in the US also rose by almost a third of a million transactions more than expected, rising to 4.26 million units in February from a revised January figure of 4.09 million. Market watchers had expected a slight slowdown to 3.95 million.
With little in the way of economic data on Friday, investors will have a week's worth of events to digest. Traders will also keep an eye on any social media developments from President Trump.
Trade recommendation: SELL 1.0850, SL 1.0930, TP 1.0760
USD/JPY(20250321)Today's AnalysisToday's buying and selling boundaries:
148.63
Support and resistance levels:
149.40
149.11
148.92
148.33
148.14
147.85
Trading strategy:
If the price breaks through 148.92, consider buying, the first target price is 149.11
If the price breaks through 148.63, consider selling, the first target price is 148.33
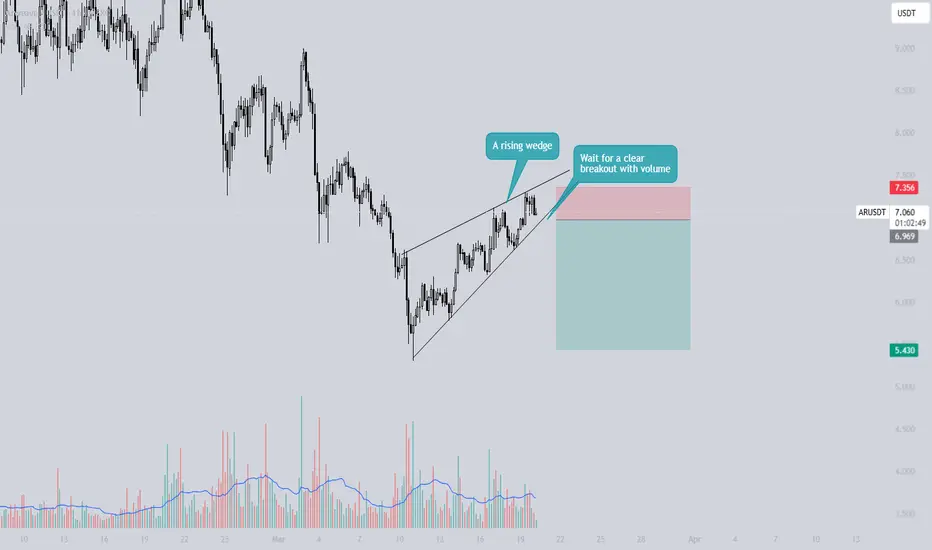
What is a Rising Wedge? - Opportunities on GALA and ARWEAVE!What is a rising wedge?
A rising wedge pattern is a bearish chart formation that signals either a potential trend reversal or the continuation of a downtrend. It occurs when the price consolidates within two upward-sloping, converging trendlines, indicating weakening momentum.
Key Characteristics of a Rising Wedge:
1. Higher Highs and Higher Lows – The price moves upward, but the momentum gradually weakens.
2. Converging Trendlines – Both the upper and lower trendlines slope upward while moving closer together, suggesting a loss of strength in the trend.
3. Breakout Direction – The pattern typically breaks below the lower trendline, confirming a bearish reversal.
How to Trade a Rising Wedge:
• Wait for Confirmation – A breakdown below the lower trendline with increased volume confirms the pattern.
• Set a Target – Measure the height of the wedge and project it downward, often aiming for the starting point of the wedge.
• Use a Stop-Loss – Place a stop-loss just above the recent swing high to manage risk.
Rising wedge on GALA and ARWEAVE
There will be some opportunities with the rising wedge pattern on GALA Games and ARWEAVE. With the projected downside move in BTC and ETH, these falling wedges could play out perfectly. The stop-losses are around 5%, so make sure to manage your risk accordingly.
Keep an eye on both setups for possible trade opportunities in the coming hours/days!
Thanks for your support.
- Make sure to follow me so you don't miss out on the next analysis!
- Drop a like and leave a comment!
Lets chat in the comment section. See you there :)
A possible short-term bullish set-up on EURCAD?Well, it seems that FX_IDC:EURCAD could be forming either a bullish pennant, or a falling wedge pattern in the near-term. Both patterns tend to result in a bullish breakout. However, we still require a confirmation. Without it, there is still a chance to see a move lower.
MARKETSCOM:EURCAD
Let us know what you think in the comments below.
Thank you.
74.2% of retail investor accounts lose money when trading CFDs with this provider. You should consider whether you understand how CFDs work and whether you can afford to take the high risk of losing your money. Past performance is not necessarily indicative of future results. The value of investments may fall as well as rise and the investor may not get back the amount initially invested. This content is not intended for nor applicable to residents of the UK. Cryptocurrency CFDs and spread bets are restricted in the UK for all retail clients.

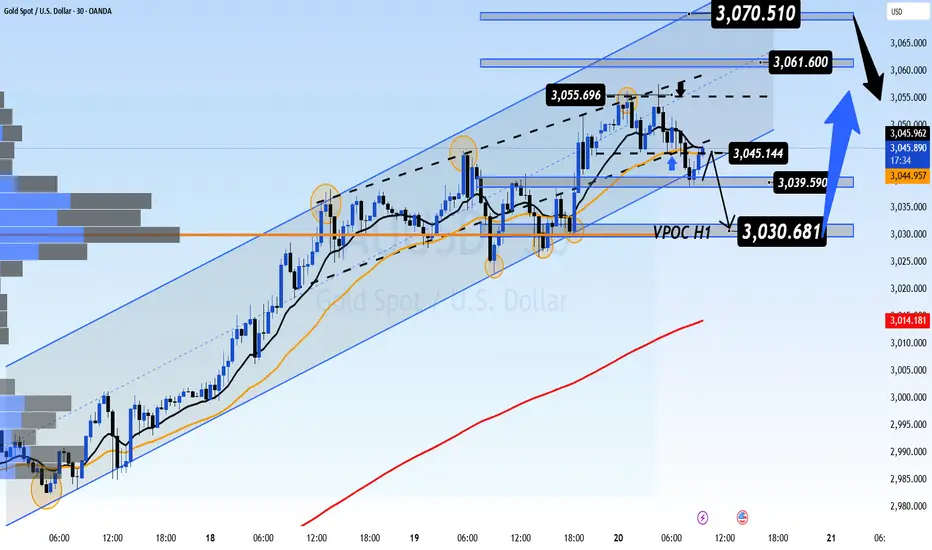
GOLD (XAU/USD) Trading Plan: Can Gold Surge Past $3100?🚀Published by MMFlowTrading on 20 March 2025
📊 Market Snapshot
Gold (XAU/USD) is riding a strong uptrend on the H1 chart, moving within a clear ascending channel 📈. After breaking the $3000 psychological barrier, bullish momentum remains intact 💪. However, with key resistance ahead and US economic data on the horizon, volatility could spike. Let’s break down the setup for today’s trading session! 🧠
🔍 Technical Analysis
Ascending Channel:
Gold is trading in a well-defined ascending channel (highlighted in orange on the chart) 📉📈. The price has respected both the upper and lower boundaries, confirming a solid uptrend. It’s currently testing the upper channel resistance at $3070.612 🚧
Key Resistance Levels:
Immediate resistance at $3070.612, a high-volume area (VPOC) where sellers may step in 🛑
A break above could target $3081.053, then $3097.774, with $3100 as the next psychological level 🎯
Key Support Levels:
Nearest support at $3031.774, aligning with the channel’s lower boundary and a prior VPOC 🛡️.
A deeper pullback might test $3024.254 or $3017.197, where buyers previously defended (marked by yellow circles) 📍
Additional Levels to Watch:
Resistance: $3054 - $3061 - $3070 🚧
Support: $3044 - $3038 - $3031 - $3026 🛡️
🌍 Fundamental Insights
US Dollar Dynamics:
Gold often moves inversely to the USD 💱. Today, 20 March 2025, markets are focused on the US Jobless Claims data (due at 13:30 GMT) and Fed speeches, which could sway the Dollar 📅. A weaker-than-expected US report may weaken the USD, boosting Gold towards $3100 🚀.
Safe-Haven Demand:
Geopolitical tensions (e.g., Middle East unrest, US-China trade talks) continue to support Gold as a safe-haven asset 🛡️. This underpins the bullish outlook for now.
Interest Rate Environment:
The Fed’s dovish tone in early 2025 has lowered the opportunity cost of holding Gold, supporting its upward trajectory 📉. Meanwhile, keep an eye on UK inflation data this week, as it could impact GBP and indirectly influence Gold.
📝 Trading Plan
Buy Opportunity (Buy Zone: $3032 - $3030) 🟢
Stop Loss (SL): $3026 ⛔
Take Profit (TP): $3038 - $3042 - $3046 - $3050 - $3060 💵
Sell Opportunity (Sell Zone: $3069 - $3071) 🔴
Stop Loss (SL): $3075 ⛔
Take Profit (TP): $3065 - $3060 - $3055 - $3050 💵
⚠️ Market Alert
Gold has been hitting all-time highs following the FOMC meeting earlier today 🌪️. With US data due during the London session, expect volatility—stick to your TP/SL to safeguard your account! 🛡️💡
Fundamental Market Analysis for March 20, 2025 USDJPYThe Japanese yen (JPY) attracted buyers for the second consecutive day and strengthened to a new one-week high against its US counterpart during the Asian session on Thursday. Expectations that strong wage growth could boost consumer spending and contribute to higher inflation give the Bank of Japan (BoJ) room to raise interest rates further. This has led to a recent sharp narrowing of the rate differential between Japan and other countries, which continues to support the low-yielding yen.
In addition, uncertainty over US President Donald Trump's trade policy and its impact on the global economy, as well as geopolitical risks and the political crisis in Turkey, are contributing to inflows into the Yen. The US Dollar (USD), on the other hand, is struggling to gain meaningful momentum amid increased economic uncertainty amid US President Donald Trump's trade tariffs. This, in turn, is weighing on the USD/JPY pair and contributing to the intraday decline.
However, interest rate differentials, the Bank of Japan's loose monetary policy, the trade balance differential and global market sentiment put pressure on the Japanese yen. The further direction of the USD/JPY pair lies on the upside.
Trading recommendation: BUY 148.400, SL 147.600, TP 150.100