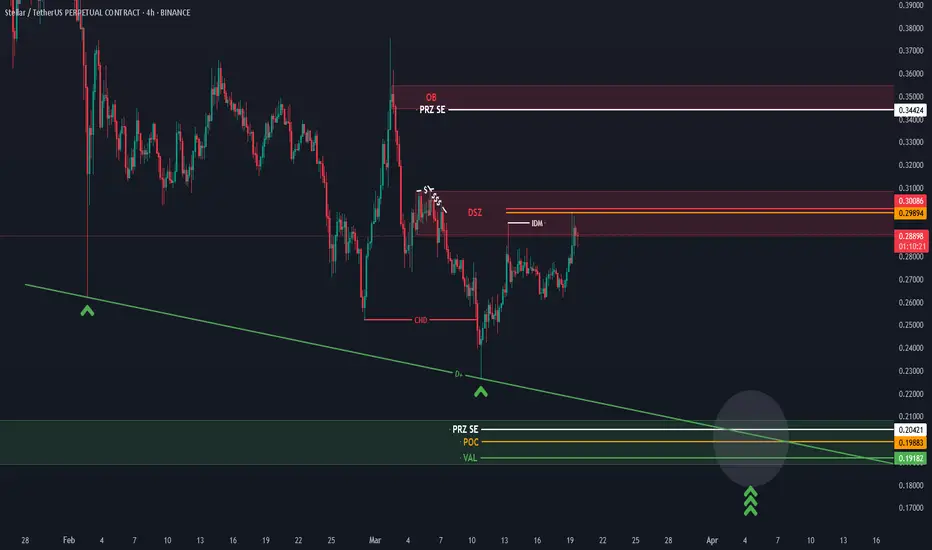
#XLM #XLMUSDT #Stellar #Analysis #Eddy#XLM #XLMUSDT #Stellar #Analysis #Eddy
Everything is clear on the chart, I didn't have enough time to explain further. From the supply area, with or without the area hunt, it can fall to the demand area. Then you can invest in your style by getting the necessary confirmations when the high-time divergence is completed, which is probably the third collision on the lines marked in the demand area.
This analysis is only to show important areas.
It is never too late to buy and invest. Do not rush and do not be fooled by the positive movements and reactions of the market. Wait for the price to reach its valuable areas. In the analysis of the Atom currency, as you can see, there is a strong demand area that is intact. Be patient until the price falls from the decision or extreme flips to the green area of the important demand area. Be sure to check this currency in your monthly time frame and draw the areas. Then refer to the weekly, daily and four-hour time frames and draw the lower time areas and look for confirmation for volatility.
Do not rush to invest and buy spot and let the price reach the support area.
Important areas are drawn and labeled so you can make informed decisions.
Good luck.
Analysis
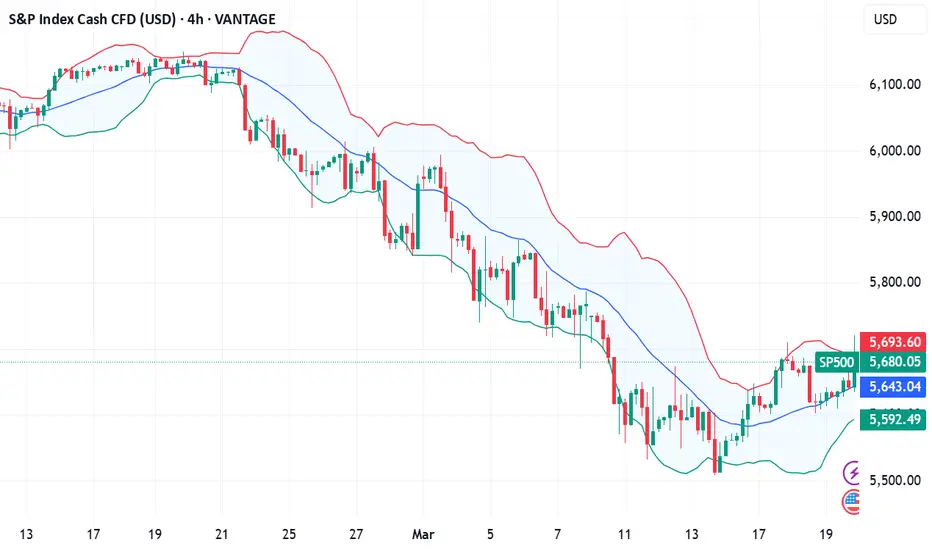
Sharp reversal in US marketsAmid market volatility and uncertainty, US stock indices experienced a sharp decline last week. The Dow Jones Index (#DJI30) fell by 3.5%, the S&P 500 (#SP500) dropped by 4.1%, and the Nasdaq-100 (#NQ100) lost 5.5%.
Investors reacted nervously to new economic data, including rising inflation and expectations of interest rate hikes, leading to a sell-off in stocks and a decline in key indices. The drop was particularly significant in the technology and consumer sectors, where companies like Apple and Tesla lost around 6-7% of their value.
However, starting March 13, 2025, the indices began to recover: #DJI30 gained 2.3%, #SP500 rose by 2.5%, and #NQ100 increased by 3.1%.
The recent rebound in US stock indices has been driven by several factors that restored investor confidence. Let’s take a closer look at the main reasons:
• Improvement in unemployment data: Labor market statistics played a crucial role in the market recovery. The US unemployment rate fell to 3.4% in February 2025, marking a record low in recent decades. This indicates strong employment levels and economic resilience, boosting investor optimism and supporting stock market growth.
• Stabilization of inflation and interest rate expectations: Although inflation in the US remains high, recent data showed a slowdown in its growth. Reduced inflationary pressure gave investors hope that the Federal Reserve (Fed) might slow down the pace of interest rate hikes. This was perceived as a sign of potential economic stabilization, positively impacting stock indices.
• Growth in consumer spending: One of the key drivers of the recent market recovery has been the increase in consumer spending. In Q1 2025, consumer demand in the US showed strong performance, serving as an essential indicator of economic activity. Increased spending on goods and services supports business stability and enhances corporate revenues, which, in turn, stimulates stock growth.
• Absence of new geopolitical risks: In recent weeks, there have been no major geopolitical crises or new threats on the international stage. This helped financial markets stabilize, as investors could focus on economic data and corporate earnings reports, contributing to stock index growth.
• Positive corporate earnings reports:
• #Microsoft (MSFT): Microsoft shares rose by 4.2% after reporting strong quarterly results, driven by growth in cloud services and software revenue.
• #Google (GOOGL): Alphabet’s stock increased by 3.7% due to higher advertising revenue and improved forecasts for upcoming quarters.
• #Apple (AAPL): Apple shares climbed 2.9%, supported by strong sales of new products and rising revenue from services.
• #Tesla (TSLA): Tesla stock surged 5.6%, fueled by strong electric vehicle sales growth and optimistic profit projections for the next quarter.
These companies demonstrated significant growth on the back of improved financial performance, strengthening investor confidence and aiding the stock market’s recovery amid volatility.
So despite last week’s market downturn, the current situation in the US stock market signals a potential recovery and a more positive trend in the coming weeks.
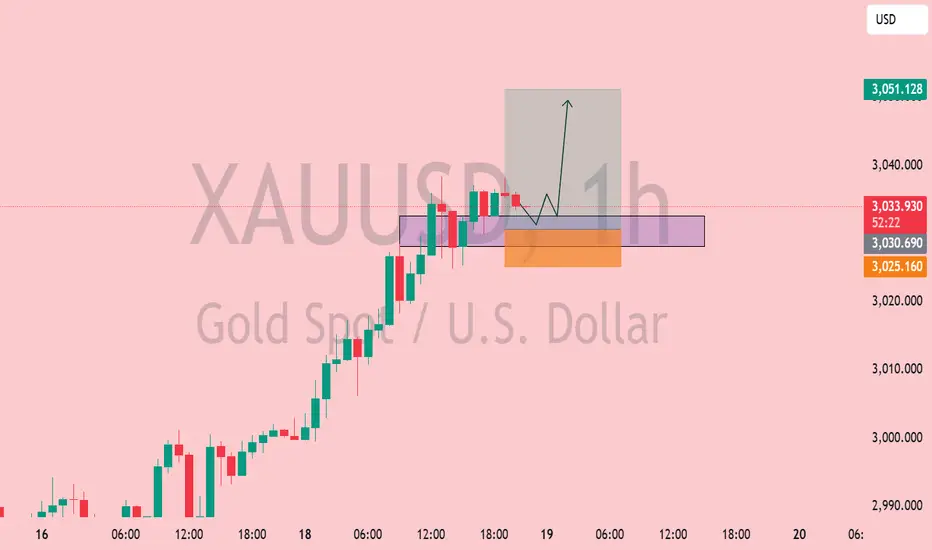
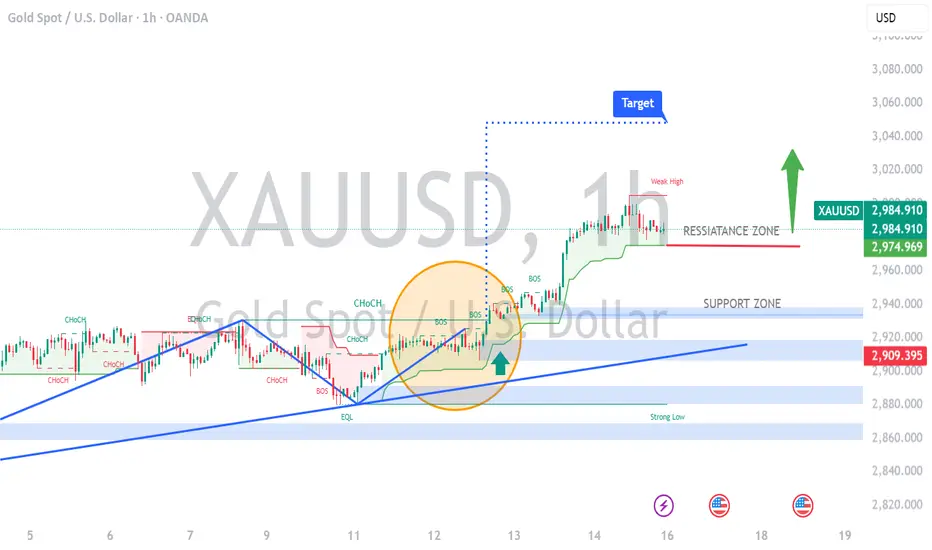
XAU/USD 1H – Bullish Continuation from Demand Zone?📊 XAU/USD (Gold) 1H Analysis – Bullish Continuation Setup
🔹 Market Structure: Gold has been in a strong uptrend, with price currently consolidating near a key demand zone.
🔹 Key Levels:
🔴 Resistance: $3,050 - $3,060 (Potential target)
🟣 Demand Zone: $3,030 - $3,035 (Support area)
🟠 Deeper Support: $3,025 (Break below weakens bullish bias)
📈 Potential Trade Setup:
1️⃣ A possible pullback into the demand zone could attract buyers.
2️⃣ Price may wick below liquidity before reversing.
3️⃣ If support holds, we anticipate a move toward $3,050+.
✅ Entry Zone: $3,030 - $3,035
🎯 Target: $3,050 - $3,060
🚨 Stop Loss: Below $3,025
⚠️ Watch for price action confirmation before entering. A strong bullish candle from support could signal entry. Let the market show its hand! 🚀✨
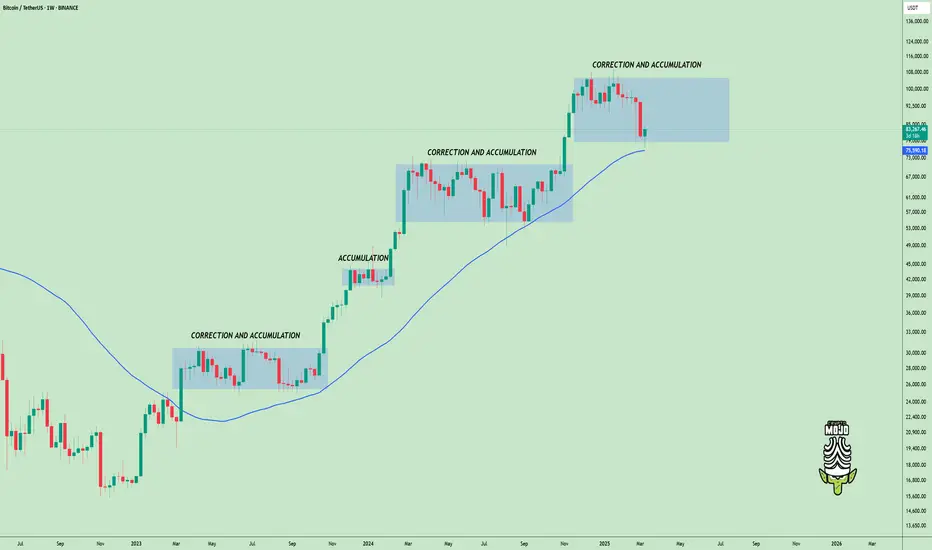
Bitcoin Correction & Accumulation Phase!#Bitcoin is in a correction and accumulation phase, something we’ve seen multiple times in this cycle.
As long as we don’t see any bearish confirmation on the higher time frame, this remains a normal correction within the bull run
We’re near the range's lower bound, which could be a good spot for short-term long setups on lower timeframes.
The next bullish breakout requires a weekly close above $110,000 🚀
History repeats itself—stay patient, accumulate smartly
What’s your strategy during these corrections? Let’s discuss it! 👇
DYOR, NFA
CAD/JPY Triangle (BoJ Interest Rate- Today) 19.03.2025The CAD/JPY pair on the M30 timeframe presents a Potential Buying Opportunity due to a recent Formation of a Triangle Pattern. This suggests a shift in momentum towards the upside and a higher likelihood of further advances in the coming hours.
Possible Long Trade:
Entry: Consider Entering A Long Position around Trendline Of The Pattern.
Target Levels:
1st Resistance – 105.50
2nd Resistance – 106.06
🎁 Please hit the like button and
🎁 Leave a comment to support for My Post !
Your likes and comments are incredibly motivating and will encourage me to share more analysis with you.
Best Regards, KABHI_TA_TRADING
Thank you.

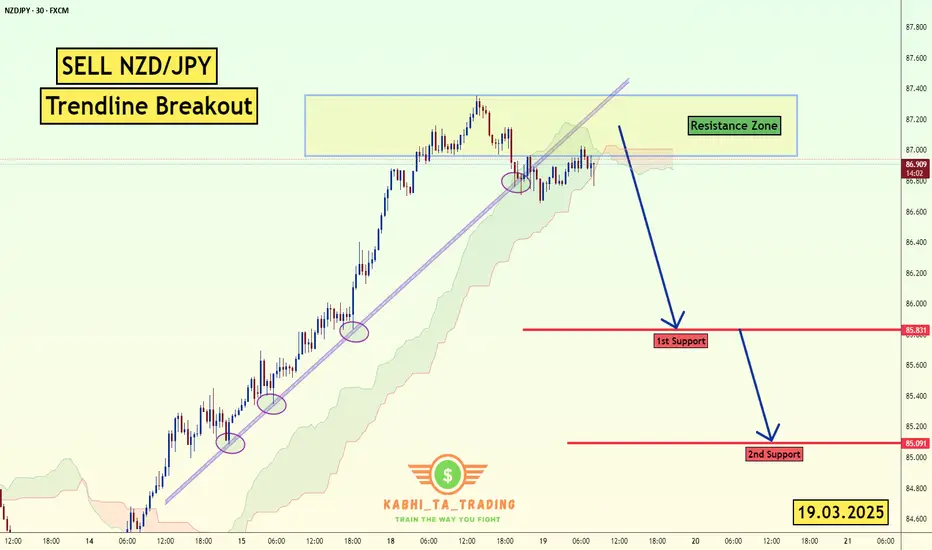
NZD/JPY Trendline Breakout (19.3.2025)The NZD/JPY Pair on the M30 timeframe presents a Potential Selling Opportunity due to a recent Formation of a Trendline Breakout Pattern. This suggests a shift in momentum towards the downside in the coming hours.
Possible Short Trade:
Entry: Consider Entering A Short Position around Trendline Of The Pattern.
Target Levels:
1st Support – 85.83
2nd Support – 85.10
🎁 Please hit the like button and
🎁 Leave a comment to support for My Post !
Your likes and comments are incredibly motivating and will encourage me to share more analysis with you.
Best Regards, KABHI_TA_TRADING
Thank you.
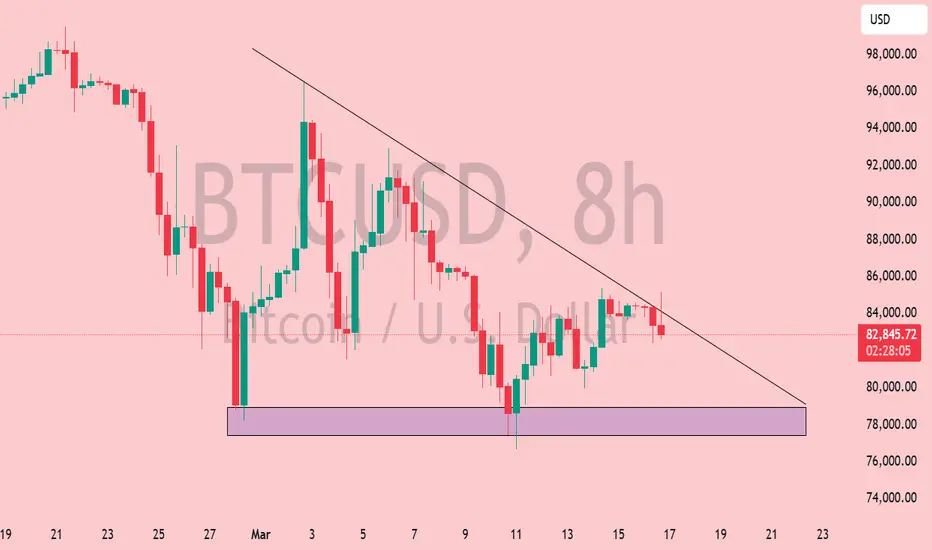
BTCUSD 8H: Trendline Pressure and Key Support Test🔥 BTCUSD 8H Deep Dive
1️⃣ Trendline Pressure: Bears controlling the market with a strong descending trendline.
2️⃣ Support Zone Strength: $77,500-$80,000 is a key demand area. Previous bounce shows buyers stepping in.
3️⃣ Liquidity Hunt? Price might sweep the support zone before reversal.
4️⃣ Volume Check Needed: Low volume = fakeout risk. High volume = potential breakout.
🎯 Targets
Bullish Breakout: $85,000-$87,500
Bearish Breakdown: $77,500-$75,000
📍 Eyes on next 8H close.
NZDJPY 4h chart analysis: Key levels Trends SetupThe NZDJPY pair is showing slight bullish momentum but the key level to watch is 86.000 A breakout above this level could signal further upside. while rejection could lead to retest of lower support levels, Stay alert and trade with cautions.

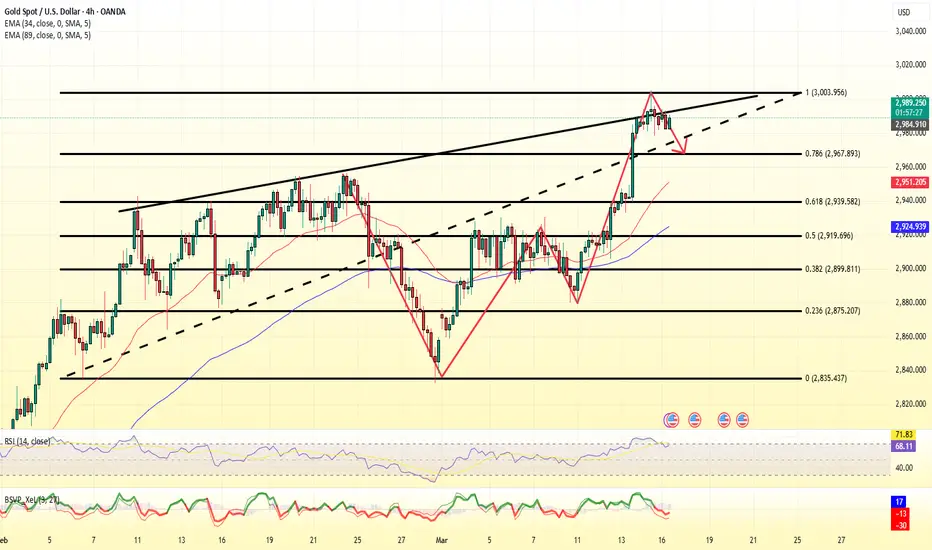
GOLD - Price can correct to support area and then continue growHi guys, this is my overview for XAUUSD, feel free to check it and write your feedback in comments👊
A few moments ago price started to grow inside a rising channel, where it so long rose near support line and reached $2845 level.
Then Gold broke this level, exited from channel and started to trades inside flat, where it at once made retest.
After this movement, Gold started to grow and later grew to top part of flat, which coincided with $2955 level.
Price some time traded near this level and then corrected to support area, after which started to grow.
Gold rose to $2955 level and broke it, thereby exiting from flat too and then it continued to move up next.
Possibly, Gold can fall to the support area, correcting, and then continue to rise to $3040
If this post is useful to you, you can support me with like/boost and advice in comments❤️

EURO - Price can bounce from support line of wedge to $1.1045Hi guys, this is my overview for EURUSD, feel free to check it and write your feedback in comments👊
Some time ago, the price declined to the $1.0475 level and broke it, after which it declined to $1.0360 points.
Then price turned around and started to grow inside the wedge, where it soon reached $1.0475 level and broke it again.
Next, Euro made a retest, after breakout and then continued to move up, and later it reached $1.0835 level.
Price has some time traded below this level, and then it broke it and reached the resistance line of wedge.
After this, EUR long time traded near $1.0835 level and not long time ago it bounced and started to grow.
In my mind, Euro can bounce from the support line and then rise to $1.1045 resistance line of the wedge pattern.
If this post is useful to you, you can support me with like/boost and advice in comments❤️

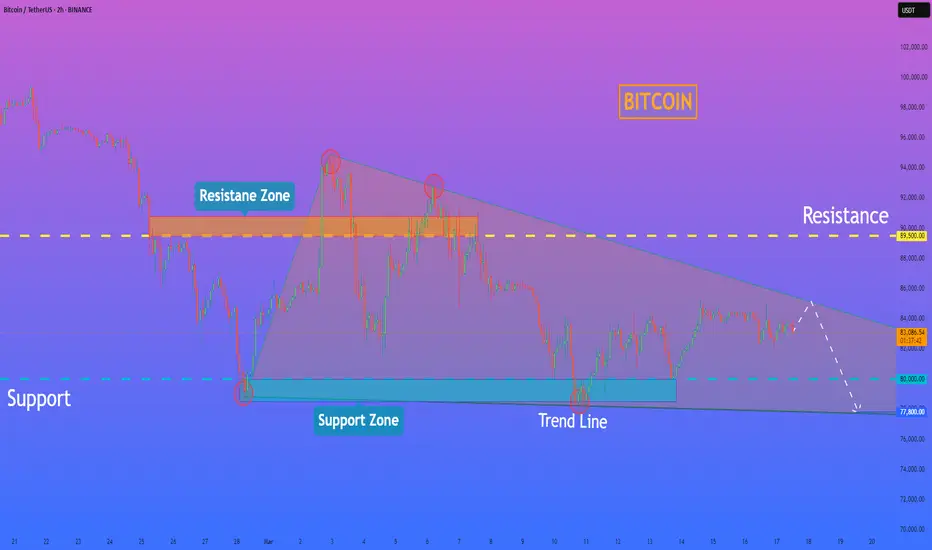
HelenP. I Bitcoin can drop of resistance line of wedge to $77800Hi folks today I'm prepared for you Bitcoin analytics. A few days ago, the price surged to 99000 before pulling back to the resistance level, which aligned with the resistance zone. Then, BTC broke through the 89500 level, traded below it for a while, and continued its decline toward the support level, which coincided with the support zone. Following this move, Bitcoin started trading inside a wedge pattern and quickly made a strong upward impulse from the support zone, reaching 94900 and breaking the resistance level once again. However, it soon corrected, dropping back below this level, and after attempting to recover, it failed. BTC then began to decline and, in a short time, fell to the support zone, where it reached the trend line. After bouncing off this level, it started to rise again, eventually making a correction to the support level before continuing its upward movement inside the wedge. At this point, I expect BTCUSDT to reach the resistance line of the wedge before reversing and dropping to the trend line, breaking the support level. Based on this, my goal is set at 77800, which coincides with the trend line. If you like my analytics you may support me with your like/comment ❤️
XAUUSD- Gold will continue the Bullish upward (Read caption) XAU/USD is expected to maintain its bullish momentum in the upcoming week, driven by sustained investor demand, a weakening U.S. dollar, and ongoing geopolitical uncertainties that continue to support safe-haven assets. Technical indicators suggest that gold may test key resistance levels, with buyers looking to push prices higher amid strong market sentiment. Traders should keep an eye on economic data releases and Federal Reserve commentary, as any dovish signals could further fuel the rally. As long as gold remains above crucial support zones, the bullish trend is likely to persist, with the potential for new highs in the near term.
#1000CHEEMSUSDT is setting up for a breakout Long BINANCE:1000CHEEMSUSDT.P from $0,0014000
🛡 Stop loss $0,0013740
1h Timeframe
⚡ Plan:
➡️ POC is 0,0013254
➡️ Waiting for consolidation near resistance and increased buying activity before the breakout.
➡️ Expecting an impulsive upward move as buy orders accumulate.
🎯 TP Targets:
💎 TP 1: $0.0014380
💎 TP 2: $0.0014700
🚀 BINANCE:1000CHEEMSUSDT.P is setting up for a breakout—preparing for an upward move!

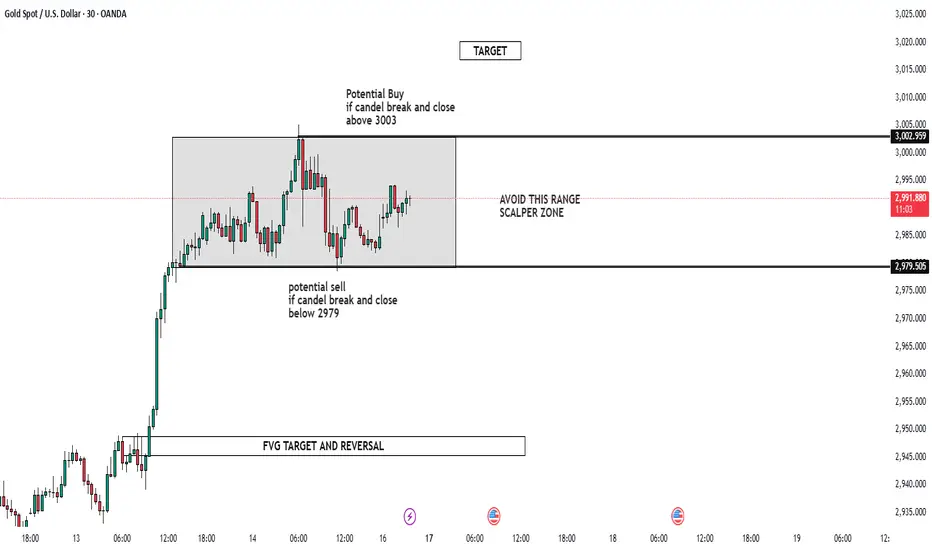
WELCOME 3000 GOLD WILL GOLD MARK NEW ATH AGAIN!🔥 Attention Traders! 🔥
XAUUSD is heating up! Here's the latest analysis:
🔻 Bearish Setup: Watch for a potential decline if the price breaks below 2979-3003. Key targets: 2960 & 2945.
🔺 Bullish Setup: A breakout above 2911 could signal buying opportunities! Keep an eye on these targets: 3015 & 3030.
📉 Risk Management: Always protect your capital by setting stop-losses and adjusting position sizes based on your risk tolerance. Trading with discipline is key to success!
📊 Stay Engaged: Share your thoughts and strategies as we navigate through this volatile market. Let’s aim for new highs while managing risk effectively! 💵🚀
Fundamental Market Analysis for March 18, 2025 EURUSDThe escalating trade war with further tariffs on European Union goods by US President Donald Trump is having a negative impact on the Euro (EUR).
The US has imposed tariffs on steel and aluminium, the EU has drawn up plans to retaliate, and Trump has promised to impose retaliatory 200% tariffs on European wines and spirits. Any signs of an escalation in the tariff war between the US and EU could put pressure on the euro.
German Chancellor Friedrich Merz has agreed to a €500bn infrastructure fund and radical changes to borrowing rules, or stretching the so-called ‘debt brake’. That should ensure the package is approved in Germany's lower house of parliament on Tuesday and in the upper house on Friday. This, in turn, could boost the common currency against the US dollar (USD) in the near term.
In addition, weaker-than-expected US retail sales data has heightened concerns about a slowdown in consumer spending. This report could put pressure on the USD and serve as a tailwind for the major pair. US retail sales rose 0.2% month-on-month in February, compared to a 1.2% drop (revised from -0.9%) in January, the US Census Bureau reported on Monday. The figure was weaker than market expectations, which had expected a 0.7% rise. On a year-over-year basis, retail sales rose 3.1% compared to 3.9% (revised from 4.2%) previously.
Trade recommendation: BUY 1.0920, SL 1.0840, TP 1.1040

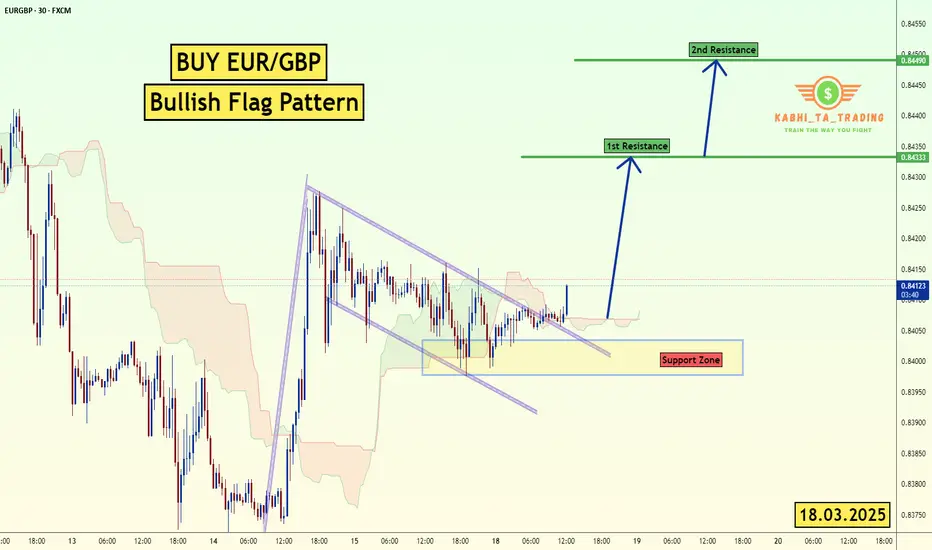
EUR/GBP Bullish Flag (18.3.25)The EUR/GBP pair on the M30 timeframe presents a Potential Buying Opportunity due to a recent Formation of a Bullish Flag Pattern. This suggests a shift in momentum towards the upside and a higher likelihood of further advances in the coming hours.
Possible Long Trade:
Entry: Consider Entering A Long Position around Trendline Of The Pattern.
Target Levels:
1st Resistance – 0.8433
2nd Resistance – 0.8448
🎁 Please hit the like button and
🎁 Leave a comment to support for My Post !
Your likes and comments are incredibly motivating and will encourage me to share more analysis with you.
Best Regards, KABHI_TA_TRADING
Thank you.
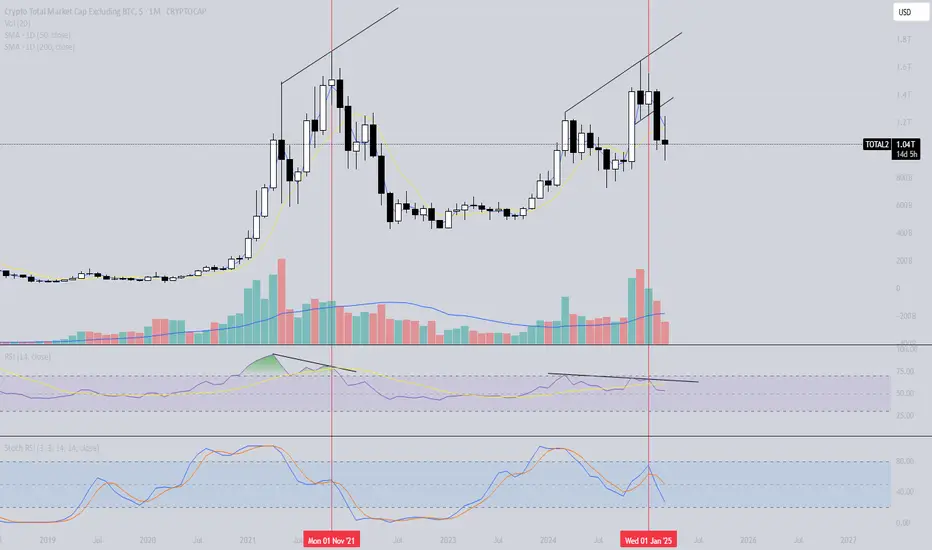
Total 2 Marketcap - Is this cycle repeating the last two cycles?In this analysis, we are discussing the possible repetition of the last two cycles by the total 2 (Crypto Total Market Cap Excluding BTC) on the monthly timeframe. By comparing this cycle in conjunction with the RSI and the Stochastic RSI with the previous two cycles we could make a statement that the market might follow the same bearish signals.
What did we see in the previous two cycles with regard to the price action and RSI
In both bullmarket cycles we saw the total 2 making highers highs and higher lows. In both instances the RSI made a lower high while the price action made a higher how consulting in a bearish divergence on the monthly timeframe.
What did we see in the previous two cycles with regard to the price action and Stochastic RSI
In the last two bullmarkets we saw the Stochastic RSI (momentum indicator) rising to levels above 80 on the indicator, overbought territory. This means that the momentum to the upside in the Crypto market is immense. However, in both instances the Stochastic RSI was in overbought territory during the first top. After the first top the momentum weakened and thus resulting in bearish momentum below level 80.
However, the momentum weakening, both cycles made a new higher high. By making a new higher high the Stochastic RSI made a bullish cross around the 40/50 level. Nevertheless, after making a new higher high and a new Stochastic RSI cross up the price fell, resulting in another bearish Stochastic RSI cross down.
What we can conclude is that in both previous cycles the Stochastic RSI made a cross down below the 80 level at the first top and made a second cross down around the 40/50 level during the final top.
How does the previous cycles relate to this current cycle
In this current bullmarket we see the Total 2 Marketcap rising and making higher highs and higher lows. However, this cycle looks alike the past two cycles in comparison with the price action, RSI and Stochastic RSI.
This Cycle the price action made higher highs and the RSI made a lower high. Thus, resulting in a bearish divergence.
Also, in this cycle the first peak occurred with the Stochastic RSI above the 80 level and breaking down at a later moment, resulting in bearish momentum. However, this cycle did the same as the previous two. With the bearish momentum the Total 2 Marketcap made a new high with a second Stochastic RSI cross down at the 40/50 level.
Conclusion
This cycle looks a lot like the past two cycles in comparison with the RSI and Stochastic and thus suggesting that there is a possibility that we go in to a new bearmarket and repeat the last two cycles. The current evidence shows that the market might follow the similar path again.
What is a bearish divergence
A bearish divergence signify potential downtrends when prices rally to a new high while the indicator (RSI) refuses to reach a new high and thus making a lower high.
Thanks for your support!
Drop a like and leave a comment to have a conversation about this topic. Make sure to follow me so you don’t miss out on the next analysis.
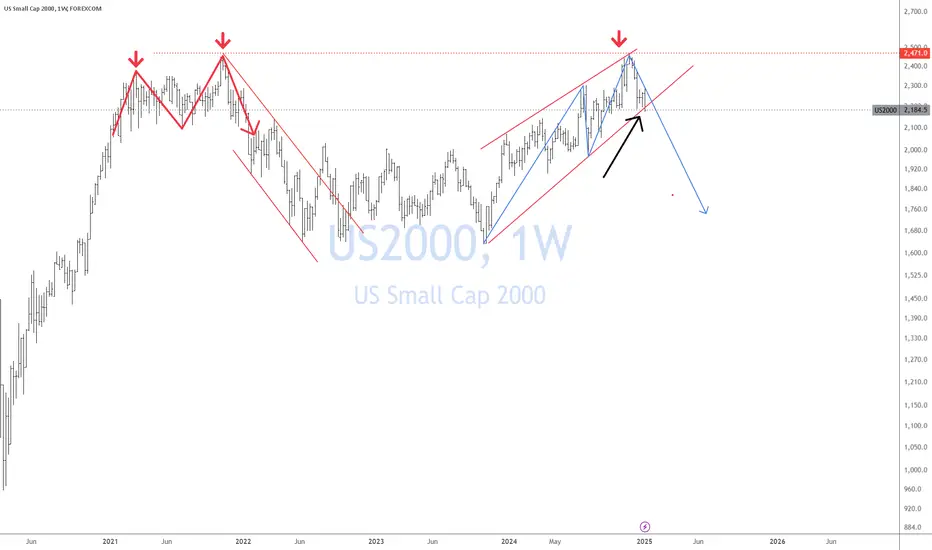
Small Cap Reversal patternAs rates persist higher as FED lowers rates, small-cap companies with limited pricing power, and high debt, needing to roll over debt are in trouble.
The chart is showing a CRACK!
#MUBARAKUSDT continues its downtrend📉 Short BYBIT:MUBARAKUSDT.P from $0,14040
🛡 Stop loss $0,15196
🕒 1H Timeframe
⚡️ Overview:
➡️ The main POC (Point of Control) is Nan
🎯 TP Targets:
💎 TP 1: $0,12395
💎 TP 2: $0,10611
💎 TP 3: $0,09178
📢 Monitor key levels before entering the trade!
BYBIT:MUBARAKUSDT.P continues its downtrend — watching for further movement!

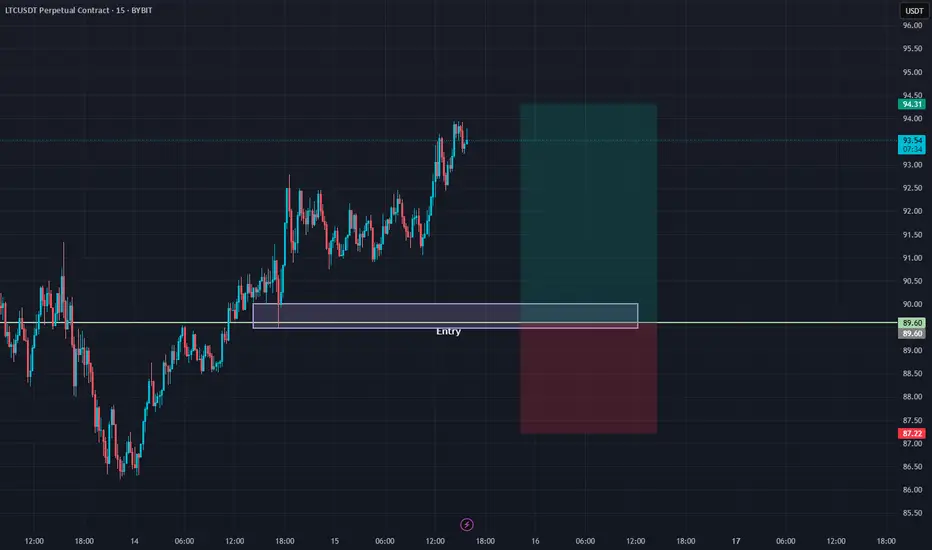
LTC Long SetupWould like to see a liquidity grab at $89.60 before moving to fill the gap.
Entry: 89.60
TP: 94.31 | 95.34 | 96,49
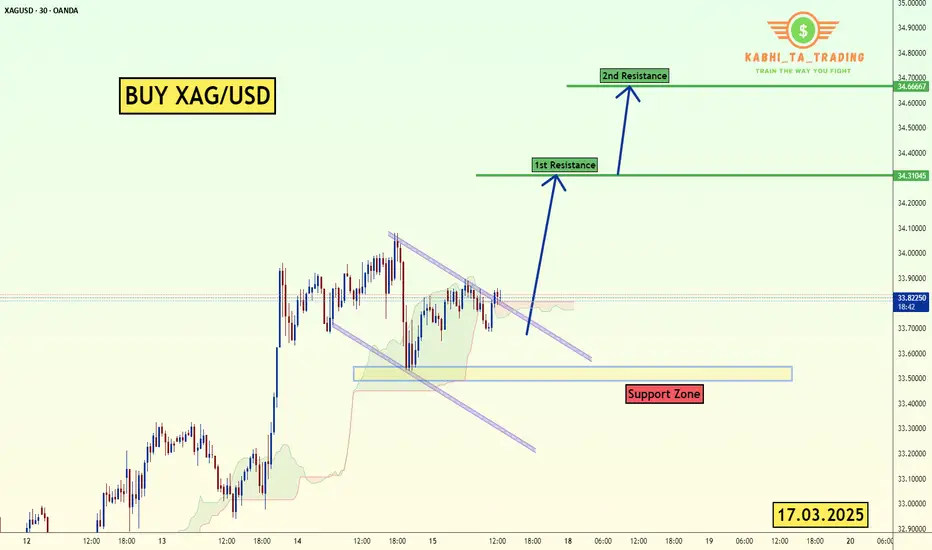
XAG/USD Breakout (17.3.2025)The XAG/USD pair on the M30 timeframe presents a Potential Buying Opportunity due to a recent Formation of a Breakout Pattern. This suggests a shift in momentum towards the upside and a higher likelihood of further advances in the coming hours.
Possible Long Trade:
Entry: Consider Entering A Long Position around Trendline Of The Pattern.
Target Levels:
1st Resistance – 34.31
2nd Resistance – 34.66
🎁 Please hit the like button and
🎁 Leave a comment to support for My Post !
Your likes and comments are incredibly motivating and will encourage me to share more analysis with you.
Best Regards, KABHI_TA_TRADING
Thank you.
GOLD hit 3000$ The first notable event is the Bank of Japan (BOJ) monetary policy meeting on Tuesday, followed by the US Federal Reserve (FED) interest rate decision on Wednesday. The Swiss National Bank (SNB) and the Bank of England (BOE) will announce their interest rate policies on Thursday.
These moves can directly affect the strength of the USD and capital flows into gold. This expert believes that if the FED maintains a "hawkish" stance and takes a cautious view on cutting interest rates, the USD may continue to strengthen, putting pressure on gold prices. On the contrary, if the signals from the FED are more easing, the precious metal may maintain its upward momentum.
Commodity experts at Macquarie have raised their gold price forecast to $3,500 an ounce by the third quarter of 2025. They had previously targeted $3,000 for mid-year, but gold prices have hit that mark earlier than expected.
Fundamental Market Analysis for March 17, 2025 USDJPYThe Japanese yen (JPY) fluctuated between moderate gains and minor losses against its US counterpart during Monday's Asian session amid mixed fundamentals. Optimism driven by China's stimulus measures announced over the weekend is evident in the overall positive tone in Asian stock markets. This, in turn, is seen as a key factor undermining the safe-haven yen.
Nevertheless, a significant yen depreciation remains elusive amid diverging policy expectations between the Federal Reserve (Fed) and the Bank of Japan (BoJ). In addition, geopolitical risks and concerns over the economic impact of US President Donald Trump's tariffs are supporting the yen. In addition, bearish sentiment around the US Dollar (USD) should restrain the USD/JPY pair.
Traders may also refrain from aggressive directional bets and prefer to step aside ahead of this week's key central bank events - the Bank of Japan and Fed decisions on Wednesday. This calls for caution from the yen bears and positioning for a continuation of the recent rebound in the USD/JPY pair from the multi-month low around 146.550-146.500 reached last Tuesday.
Trading recommendation: BUY 148.900, SL 148.400, TP 150.100
