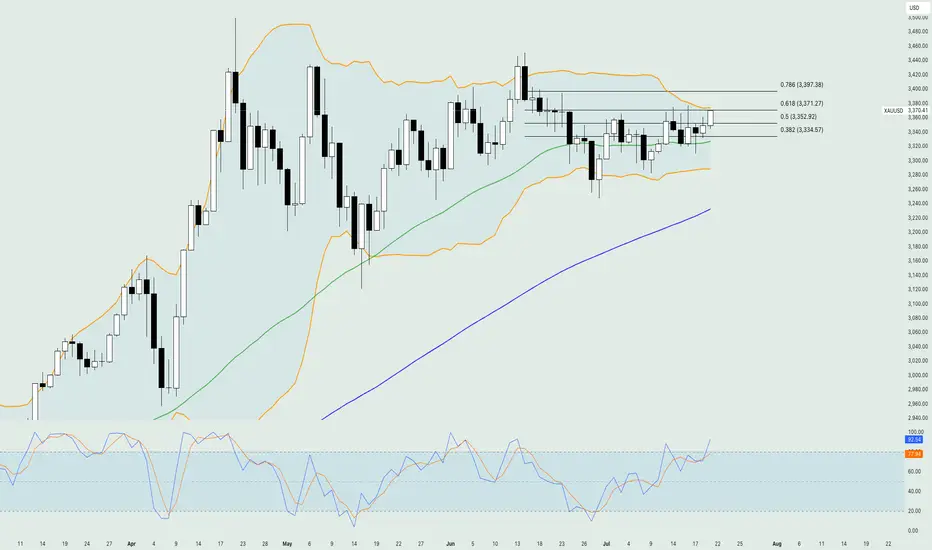
Gold - DAILY- 21.07.2025Gold held steady near $3,350 an ounce as markets opened Monday, with traders assessing mixed signals from Federal Reserve officials on the inflation impact of Trump’s tariff plans. Some Fed governors, like Waller and Bowman, signaled openness to rate cuts, while others remain cautious due to inflation risks. Trump continues pressuring the Fed to lower rates, with speculation about replacing Chair Jerome Powell. Meanwhile, EU officials are preparing for potential trade fallout as Trump’s Aug. 1 tariff deadline approaches. Gold is up over 25% this year, driven by geopolitical tensions and demand for safe-haven assets.
From a technical point of view, the price of gold found sufficient support on the 38.2% of the weekly Fibonacci retracement level and is currently testing the resistance on the 50% around $3,355. The moving averages are confirming the overall bullish trend in the market, while at the same time, the Stochastic oscillator is near the extreme overbought level, hinting at a potential bearish correction move in the upcoming sessions. The Bollinger bands are quite expanded, showing that volatility is there to support any short-term move to either side, while the level around $3,380 is the first major technical resistance area consisting of the upper band of the Bollinger bands and the 61.% of the weekly Fibonacci retracement level.
Disclaimer: The opinions in this article are personal to the writer and do not reflect those of Exness
Analysis
Crude Oil -DAILY- 21.07.2025Oil prices were steady after their first weekly decline this month, as attention shifted to U.S. trade negotiations and the European Union’s push to tighten restrictions on Russian energy exports. The EU is preparing new sanctions, including a lower price cap on Russian crude, limits on fuel refined from Russian oil, banking restrictions, and bans targeting an Indian refinery and Chinese firms. Despite western sanctions, Russian oil continues flowing to China and India. Meanwhile, diesel margins in Europe remain strong, signaling tight supply.
On the technical side, the price of crude oil has failed to break below the major technical support area, which consists of the 50-day simple moving average and the 50% of the weekly Fibonacci retracement level. The Stochastic oscillator has been in the neutral level since last week hinting that there is potential for the price to move to either direction in the near short term. On the other hand, the Bollinger bands have contracted rather massively showing that volatility has dried up therefore, the recent sideways movement might extend in the upcoming sessions.
Disclaimer: The opinions in this article are personal to the writer and do not reflect those of Exness

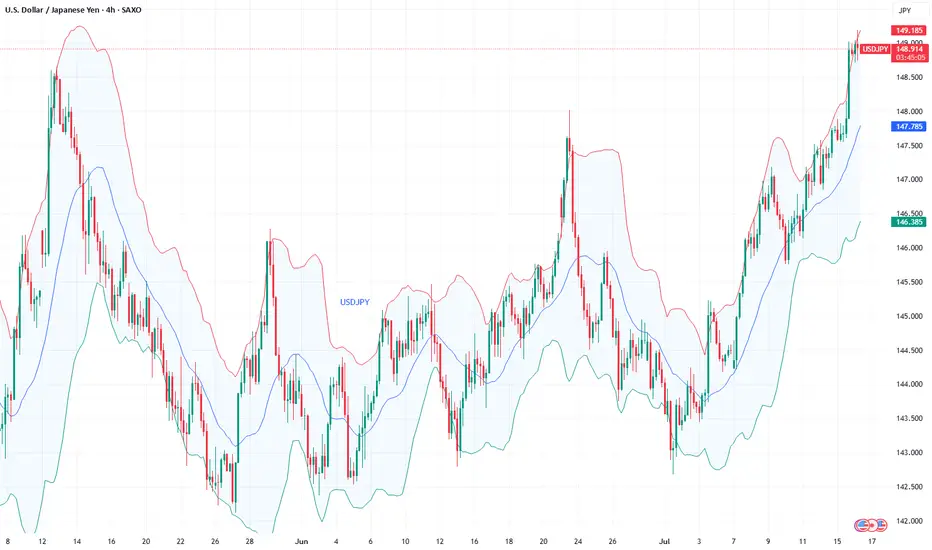
Fundamental Market Analysis for July 21, 2025 USDJPYThe pair opened the week near 148.500, clawing back ground after Sunday’s upper‑house election saw Japan’s ruling LDP‑Komeito coalition lose its majority. The outcome clouds the fiscal outlook and raises the probability of additional stimulus, a combination that tends to undermine the yen as investors anticipate higher public borrowing and a looser policy mix.
At the same time, subdued inflation and stagnant real wages have pushed expectations of Bank of Japan tightening into late‑2025 at the earliest. With the 10‑year US‑Japan yield gap hovering near yearly highs, capital continues to flow from low‑yielding JGBs into higher‑yielding US assets, reinforcing dollar demand against the yen.
Dollar strength is also underpinned by persistent tariff worries and a Federal Reserve that maintains a cautious stance rather than rushing to cut rates. Given these fundamentals, USDJPY could retest the psychological 150.000 barrier, while dips below 147.500 are likely to be viewed by the market as opportunities to re‑establish long positions rather than the start of a deeper correction.
Trading recommendation: BUY 148.500, SL 147.500, TP 149.500

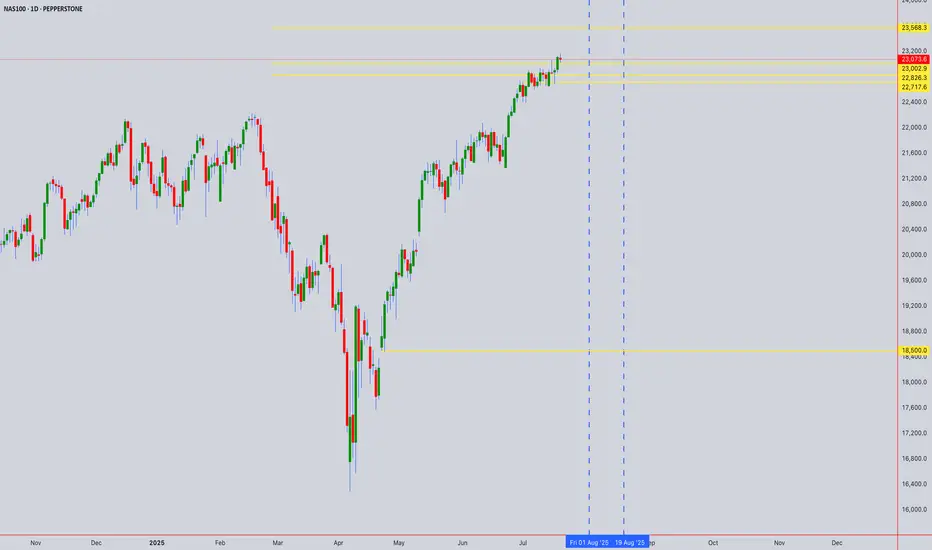
US100 (NASDAQ 100) 24-Hour Technical Analysis ForecastCurrent Price: 23,076.60 (Close: Friday, July 18th, 2025)
Analysis Period: Next 24 Hours (July 19-20, 2025)
Market Status: Weekend - Preparing for Monday Open
---------------------------------------------------------------------------------------------
EXECUTIVE SUMMARY - 24H OUTLOOK
Primary Bias: Neutral to Bullish (Short-term consolidation expected)
Key Resistance: 23,150 - 23,250
Critical Support: 22,850 - 22,950
Expected Range: 22,900 - 23,200
Volatility Level: Moderate (Tech earnings season approach)
---------------------------------------------------------------------------------------------
1. CANDLESTICK PATTERN ANALYSIS
Friday's Close Formation
---------------------------------------------------------------------------------------------
Pattern: Small-bodied candle with upper shadow at 23,076
Significance: Indecision after testing resistance near 23,150
Volume: Above-average volume suggesting institutional activity
Context: Failed to break cleanly above psychological 23,100 level
---------------------------------------------------------------------------------------------
Expected 24H Patterns
---------------------------------------------------------------------------------------------
Monday Gap: Potential small gap up to 23,100-23,120 area
Continuation Pattern: Bullish flag/pennant formation developing
Key Reversal: Watch for hammer formation at 22,950 support if decline occurs
---------------------------------------------------------------------------------------------
Pattern Probability Assessment
---------------------------------------------------------------------------------------------
Doji/Spinning Top: 40% probability (continued indecision)
Bullish Engulfing: 35% probability (if gap up occurs)
Bearish Reversal: 25% probability (if resistance holds)
---------------------------------------------------------------------------------------------
2. HARMONIC PATTERN ANALYSIS
Current Harmonic Setup
---------------------------------------------------------------------------------------------
Primary Pattern: Bullish Cypher Pattern in Development
---------------------------------------------------------------------------------------------
X: 22,400 (previous major low)
A: 23,250 (recent swing high)
B: 22,800 (61.8% retracement)
C: 23,150 (127.2% extension - current test area)
D (Completion): 22,650-22,750 (78.6% retracement zone)
---------------------------------------------------------------------------------------------
Alternative Pattern: Bull Flag
---------------------------------------------------------------------------------------------
Pole: 22,400 → 23,250 (850-point move)
Flag: Current consolidation 22,950-23,150
Target: 23,250 + 850 = 24,100 (extended projection)
---------------------------------------------------------------------------------------------
Fibonacci Levels (24H Focus)
---------------------------------------------------------------------------------------------
Golden Ratio Support: 22,950 (61.8% of recent swing)
38.2% Retracement: 23,025
23.6% Retracement: 23,050
Extension Target: 23,375 (161.8% projection)
---------------------------------------------------------------------------------------------
3. ELLIOTT WAVE THEORY - 24H COUNT
Primary Wave Count (Bullish Scenario)
---------------------------------------------------------------------------------------------
Macro Structure: Wave 5 of larger degree impulse in progress
Current Position: Wave 4 correction completing
Mini-wave Count: Flat correction pattern (A-B-C structure)
---------------------------------------------------------------------------------------------
24-Hour Wave Projection
---------------------------------------------------------------------------------------------
Wave A: 23,250 → 22,800 (Completed)
Wave B: 22,800 → 23,150 (Completed - 70% retrace)
Wave C: 23,150 → 22,950 (In Progress - Equal to A)
Wave 5 Target: 24,000-24,200 (1.618 extension)
---------------------------------------------------------------------------------------------
Alternative Count (Corrective Scenario)
---------------------------------------------------------------------------------------------
Structure: Double zigzag correction
Current Phase: Second zigzag development
Target: 22,750-22,850 (Wave Y completion)
---------------------------------------------------------------------------------------------
Critical Elliott Levels
---------------------------------------------------------------------------------------------
Wave 4 Low: 22,750 (must hold for bullish count)
Invalidation: Below 22,400 (Wave 1 high)
Confirmation: Break above 23,250 (Wave 3 high)
---------------------------------------------------------------------------------------------
4. WYCKOFF THEORY - 24H PHASE
Current Market Phase Assessment
---------------------------------------------------------------------------------------------
Primary Phase: Reaccumulation (Phase B-C transition)
Composite Operator Action: Testing supply at 23,150 area
Volume Analysis: Absorption of selling pressure evident
Smart Money Activity: Institutional buying on dips below 23,000
---------------------------------------------------------------------------------------------
Expected 24H Wyckoff Dynamics
---------------------------------------------------------------------------------------------
Phase Progression: Moving toward Phase D (Sign of Strength)
Testing Action: Final test of support at 22,950-23,000
Volume Expectation: Declining volume on any weakness
Breakout Setup: Spring action possible below 22,950
---------------------------------------------------------------------------------------------
Key Wyckoff Signals (24H Watch List)
---------------------------------------------------------------------------------------------
Sign of Strength (SOS): Break above 23,150 with volume
Last Point of Support (LPS): 22,950 area test
No Supply: Expected on rallies to 23,100-23,150
Backup to Edge of Creek: Potential dip to 22,850
---------------------------------------------------------------------------------------------
5. W.D. GANN THEORY - 24H ANALYSIS
Square of Nine Analysis
---------------------------------------------------------------------------------------------
Current Position: 23,076° on Gann wheel
Next Cardinal Point: 23,100° (significant psychological resistance)
Natural Support: 23,000° (perfect square - strong magnetic level)
Critical Angle: 22,900° (45-degree angle support from recent low)
---------------------------------------------------------------------------------------------
Time Theory - 24H Cycle
---------------------------------------------------------------------------------------------
Natural Time Cycle: 24-hour cycle from Friday's close
Critical Time Windows:
---------------------------------------------------------------------------------------------
6 hours: 02:00 UTC Monday (potential turn time)
18 hours: 14:00 UTC Monday (major turn potential)
24 hours: 20:00 UTC Monday (cycle completion)
---------------------------------------------------------------------------------------------
Angle Theory Application
---------------------------------------------------------------------------------------------
Rising 45° Line: Currently at 22,950 (critical support)
Rising 63.75° Line: 23,100 (steep resistance angle)
Declining 26.25° Line: 23,150 (gentle resistance)
---------------------------------------------------------------------------------------------
Gann Price Forecasting
---------------------------------------------------------------------------------------------
Square Root Method:
---------------------------------------------------------------------------------------------
Current: √23,076 ≈ 151.9
Next resistance: 152² = 23,104
Major resistance: 153² = 23,409
---------------------------------------------------------------------------------------------
Primary Target: 23,104 (natural Gann resistance)
Extended Target: 23,409 (next perfect square)
---------------------------------------------------------------------------------------------
Time-Price Harmony
---------------------------------------------------------------------------------------------
Harmonic Time: 144 hours from last major low
Price Harmony: 23,076 in harmony with 22,500 base
Next Harmony Level: 23,400 (Fibonacci price relationship)
---------------------------------------------------------------------------------------------
6. MULTI-TIMEFRAME INTRADAY ANALYSIS
5-Minute Chart Analysis
---------------------------------------------------------------------------------------------
Micro Trend: Consolidating triangle pattern
Support: 23,050-23,060 (recent lows)
Resistance: 23,090-23,100 (intraday highs)
Volume Profile: Balanced - no clear direction
RSI (5M): 48-52 range (neutral)
Pattern: Symmetrical triangle (breakout pending)
---------------------------------------------------------------------------------------------
15-Minute Chart Analysis
---------------------------------------------------------------------------------------------
Structure: Bull flag formation
Flag Boundaries: 23,040-23,120
Breakout Level: Above 23,120 (bullish)
Breakdown Level: Below 23,040 (bearish)
Moving Averages: EMA20 at 23,065 (support)
MACD: Consolidating above zero line
---------------------------------------------------------------------------------------------
30-Minute Chart Analysis
---------------------------------------------------------------------------------------------
Primary Pattern: Ascending triangle
Horizontal Resistance: 23,150 (multiple tests)
Rising Support Line: From 22,950 to current levels
Breakout Target: 23,350 (triangle height projection)
Volume: Decreasing (typical triangle behavior)
Bollinger Bands: Contracting (low volatility)
---------------------------------------------------------------------------------------------
1-Hour Chart Analysis
---------------------------------------------------------------------------------------------
Major Structure: Bullish continuation pattern
Cup and Handle: Handle formation in progress
Handle Depth: 7% correction (healthy)
Breakout Level: 23,175 (handle resistance)
Target: 24,000 (cup depth projection)
RSI (1H): 55 (bullish but not overbought)
---------------------------------------------------------------------------------------------
4-Hour Chart Analysis
---------------------------------------------------------------------------------------------
Macro Trend: Strong uptrend intact
Correction Type: Shallow pullback (wave 4 character)
Support Cluster: 22,900-23,000 (multiple confluences)
Resistance Zone: 23,150-23,250
Ichimoku Cloud: Price above cloud (bullish)
Volume Trend: Higher lows pattern (accumulation)
---------------------------------------------------------------------------------------------
7. TECHNICAL INDICATORS MATRIX
Momentum Indicators
---------------------------------------------------------------------------------------------
RSI (4H): 58 (Bullish momentum, room for upside)
RSI (1H): 55 (Neutral-bullish)
Stochastic %K: 62 (Above %D line - bullish)
Williams %R: -35 (Not oversold, upside potential)
---------------------------------------------------------------------------------------------
Trend Indicators
---------------------------------------------------------------------------------------------
MACD (4H): Above signal line, histogram positive
ADX: 35 (Strong trend strength)
Parabolic SAR: 22,950 (supportive)
Supertrend: 22,850 (strong support)
---------------------------------------------------------------------------------------------
Volume Indicators
---------------------------------------------------------------------------------------------
OBV: Rising trend (accumulation pattern)
Volume Rate of Change: Positive
Chaikin Money Flow: +0.15 (buying pressure)
Accumulation/Distribution: Uptrend
---------------------------------------------------------------------------------------------
8. KEY SUPPORT & RESISTANCE LEVELS (24H)
Critical Resistance Levels
---------------------------------------------------------------------------------------------
R1: 23,100 (Psychological + Gann)
R2: 23,150 (Technical resistance + harmonic)
R3: 23,200 (Minor resistance)
R4: 23,250 (Major swing high)
R5: 23,350 (Extended target)
---------------------------------------------------------------------------------------------
Vital Support Levels
---------------------------------------------------------------------------------------------
S1: 23,040 (Immediate support)
S2: 23,000 (Psychological + Gann)
S3: 22,950 (Critical support cluster)
S4: 22,900 (Strong technical support)
S5: 22,850 (Major support zone)
---------------------------------------------------------------------------------------------
9. 24-HOUR TRADING SCENARIOS
Scenario 1: Bullish Breakout (50% Probability)
---------------------------------------------------------------------------------------------
Trigger: Break above 23,120 with volume expansion
Initial Target: 23,180-23,200
Extended Target: 23,300-23,350
Stop Loss (Longs): Below 22,990
Expected Timeline: 12-18 hours from breakout
---------------------------------------------------------------------------------------------
Scenario 2: Continued Consolidation (35% Probability)
---------------------------------------------------------------------------------------------
Range: 23,000-23,150
Trading Strategy: Range-bound scalping
Buy Zone: 23,020-23,040
Sell Zone: 23,120-23,140
Duration: Full 24-hour period
---------------------------------------------------------------------------------------------
Scenario 3: Bearish Breakdown (15% Probability)
---------------------------------------------------------------------------------------------
Trigger: Break below 22,990 on volume
Target 1: 22,900-22,950
Target 2: 22,850-22,900
Bounce Level: 22,800-22,850
Recovery Above: 23,050 negates bearish scenario
---------------------------------------------------------------------------------------------
10. RISK FACTORS & CATALYSTS (24H)
Bullish Catalysts
---------------------------------------------------------------------------------------------
Tech earnings optimism building
AI sector momentum continuation
Institutional portfolio rebalancing (month-end flows)
Strong economic data expectations
Risk-on sentiment from Asia markets
---------------------------------------------------------------------------------------------
Bearish Risk Factors
---------------------------------------------------------------------------------------------
Profit-taking ahead of earnings
Rising bond yields concern
Geopolitical tensions impact
Overbought technical condition worries
Sector rotation out of tech
---------------------------------------------------------------------------------------------
High-Impact Events (Next 24H)
---------------------------------------------------------------------------------------------
Asian market opening (risk sentiment gauge)
Weekend news flow analysis
Pre-earnings positioning
Options expiry effects
Futures gap analysis
---------------------------------------------------------------------------------------------
11. TRADING RECOMMENDATIONS (24H)
For Scalpers (5M-15M Timeframes)
---------------------------------------------------------------------------------------------
Primary Setup: Triangle breakout trade
Entry Long: Above 23,120
Target: 23,160-23,180
Stop Loss: 23,080
Risk/Reward: 1:2 ratio
---------------------------------------------------------------------------------------------
For Intraday Traders (30M-1H)
---------------------------------------------------------------------------------------------
Strategy: Bull flag continuation
Entry Zone: 23,050-23,070 (on dips)
Target 1: 23,150
Target 2: 23,200
Stop Loss: 23,000
---------------------------------------------------------------------------------------------
For Swing Setup (4H basis)
---------------------------------------------------------------------------------------------
Approach: Pullback buying opportunity
Optimal Entry: 22,950-23,000
Primary Target: 23,350-23,400
Extended Target: 23,600
Stop Loss: 22,850
---------------------------------------------------------------------------------------------
12. CONFLUENCE ANALYSIS
Bullish Confluence at 22,950-23,000
---------------------------------------------------------------------------------------------
Gann Theory: 23,000° perfect square support
Elliott Wave: Wave 4 completion zone
Wyckoff: Last Point of Support (LPS)
Fibonacci: 61.8% retracement level
Moving Averages: EMA 50 confluence
Volume Profile: High volume node support
---------------------------------------------------------------------------------------------
Resistance Confluence at 23,150-23,200
---------------------------------------------------------------------------------------------
Harmonic: Cypher pattern C-point resistance
Previous Structure: Multiple test area
Psychological: Round number resistance
Gann Angles: 63.75° resistance line
Elliott Wave: Wave B completion area
Technical: Flag pattern upper boundary
---------------------------------------------------------------------------------------------
FINAL 24H FORECAST SUMMARY
Most Likely Scenario: Continued consolidation with upward bias, testing 23,150 resistance with potential breakout to 23,200+ levels.
Trading Range Expectation: 22,980 - 23,180 (primary range)
Breakout Levels:
---------------------------------------------------------------------------------------------
Bullish: Above 23,120 → targets 23,200-23,350
Bearish: Below 22,980 → targets 22,900-22,950
---------------------------------------------------------------------------------------------
Key Time Windows:
---------------------------------------------------------------------------------------------
Asian Open: 00:00-02:00 UTC (gap direction)
US Pre-market: 08:00-13:30 UTC (institutional flows)
US Cash Open: 13:30 UTC (volume confirmation)
---------------------------------------------------------------------------------------------
Risk Management Notes:
---------------------------------------------------------------------------------------------
Position sizing should account for tech sector volatility
Weekend gap risk considerations
Earnings season positioning effects
---------------------------------------------------------------------------------------------
Probability Assessment:
---------------------------------------------------------------------------------------------
50% - Bullish breakout scenario
35% - Range-bound consolidation
15% - Bearish breakdown
---------------------------------------------------------------------------------------------
Disclaimer: This analysis is for educational purposes only. Trading involves substantial risk of loss. Always use appropriate risk management and never risk more than you can afford to lose. Past performance does not guarantee future results.
---------------------------------------------------------------------------------------------
---------------------------------------------------------------------------------------------
For those interested in further developing their trading skills based on these types of analyses, consider exploring the mentoring program offered by Shunya Trade.
I welcome your feedback on this analysis, as it will inform and enhance my future work.
Regards,
Shunya Trade
⚠️ Disclaimer: This post is educational content and does not constitute investment advice, financial advice, or trading recommendations. The views expressed here are based on technical analysis and are shared solely for informational purposes. The stock market is subject to risks, including capital loss, and readers should exercise due diligence before investing. We do not take responsibility for decisions made based on this content. Consult a certified financial advisor for personalized guidance.
VZ: Verizon Earnings tomorrowwith 6% dividend yield and stock price at support level on the lower channel band, this draw attention to the earnings report tomorrow pre-market hours. Focused on future outlook as well.
If all good, I will buy VZ.
Disclaimer: This content is NOT a financial advise, it is for educational purpose only.

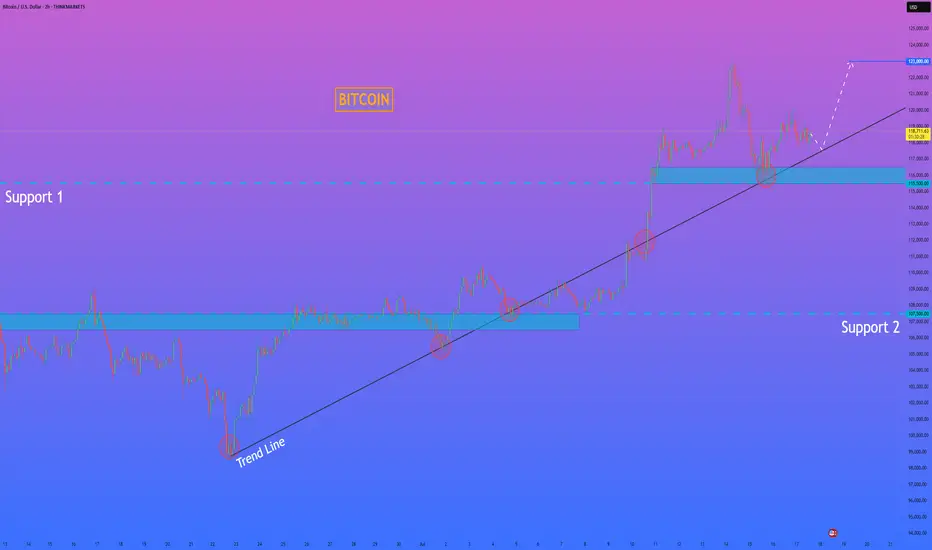
HelenP. I Bitcoin will correct to trend line and then start riseHi folks today I'm prepared for you Bitcoin analytics. The price has been trading in a strong bullish structure, clearly respecting the ascending trend line since the rebound from the 107500 level. Each time the price touched the trend line, it formed a higher low and continued the upward movement. After breaking through the important Support 1 zone (115500–116500), BTC made a strong impulse upward and reached a local high above 122000 points. Currently, the price is making a pullback and moving closer to the trend line again. This area has previously acted as a major point of interest for buyers, and now it's expected to play a key role once more. The support zone and trend line are converging, which makes this level critical for the next move. I believe BTCUSD will bounce from this area and continue its bullish momentum. My goal is set at 123000 points. Given the market structure, higher lows, and strong reaction from the support zones, I remain bullish and expect further growth from current levels. If you like my analytics you may support me with your like/comment ❤️
Disclaimer: As part of ThinkMarkets’ Influencer Program, I am sponsored to share and publish their charts in my analysis.
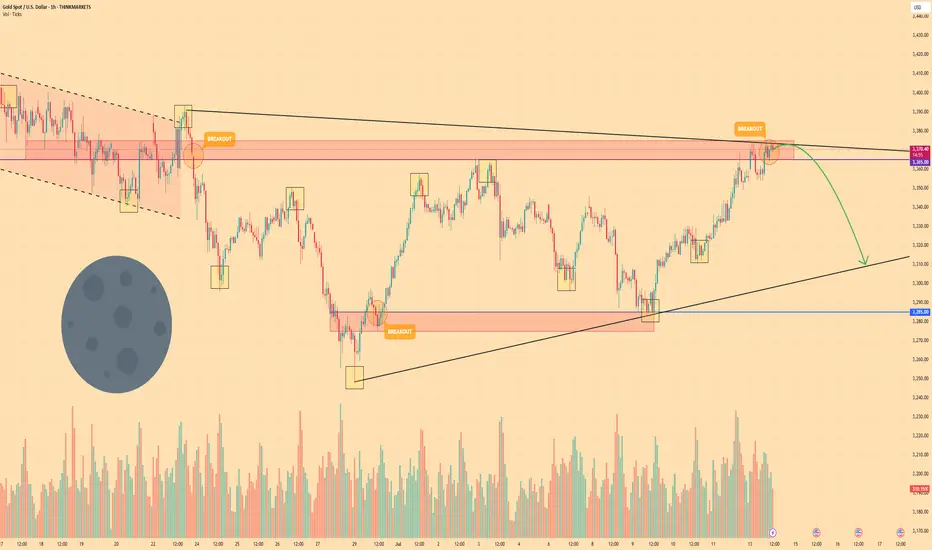
Gold may rise a little and then drop to support levelHello traders, I want share with you my opinion about Gold. Initially, gold was trading within a large consolidating pennant, showing both upward and downward impulses as it moved between the converging trend lines. The price eventually saw a breakout from this pattern, followed by a strong impulse up, but this momentum stalled as it approached the major horizontal resistance level at 3390. This level, which corresponds with the upper seller zone, has proven to be a significant barrier for buyers, rejecting the price and confirming a strong seller presence in that area. Currently, the market is in a corrective phase after being rejected from the highs. The price is drifting upwards once again in what appears to be a final retest of the aforementioned seller zone. This slow upward movement lacks the impulsive strength of the previous trend, suggesting that buyers are losing control and sellers are preparing to defend the 3390 resistance level once more. I expect this corrective move to fail upon reaching the seller zone around 3390. After this retest, I anticipate a sharp reversal and the beginning of a new downward trend. The logical target for this move is the major support level at 3310, an area that has historically acted as a strong buyer zone. That is why my TP is set at 3310. Please share this idea with your friends and click Boost 🚀
Disclaimer: As part of ThinkMarkets’ Influencer Program, I am sponsored to share and publish their charts in my analysis.

GOLD - Price may bounce up to $3375 level from support lineHi guys, this is my overview for XAUUSD, feel free to check it and write your feedback in comments👊
Initially, the price action was confined within a descending channel before a decisive bullish breakout occurred.
This first breakout triggered a strong upward impulse, setting the stage for the current market structure.
The price is now consolidating in a wide flat range, bounded by support near the $3285 level and resistance at $3375.
An ascending support line is providing dynamic support within this consolidation pattern, indicating underlying buying pressure.
I expect a brief retest of this support line, which should act as a launchpad for the price to move higher.
The primary target for this long setup is the $3375 resistance level, marking the top of the current flat range.
If this post is useful to you, you can support me with like/boost and advice in comments❤️
Disclaimer: As part of ThinkMarkets’ Influencer Program, I am sponsored to share and publish their charts in my analysis.

ETH/USDT 4H Chart✅ Market Trend and Structure:
Uptrend: The highlighted orange trend line shows continuous growth since mid-April. The price is trading above the 50- and 200-period moving averages (EMA and SMA), confirming bullish sentiment.
Current price: around 3556 USDT – very close to local highs.
Resistance break in the 3200–3300 USDT area, which now acts as support.
📈 Technical Levels:
Resistance (red horizontal lines):
3600–3650 USDT – local resistance resulting from market reaction.
3888 USDT – next historical resistance level.
4133 USDT – established long-term target (green dashed line at the top).
Support:
3300 USDT – strong support after a previous breakout.
3080 USDT – previous high, now the next support level.
3070 / 2900 USDT – key technical support levels in the event of a larger correction.
📊 Indicators:
MACD:
The MACD is in a strongly bullish zone, but:
The histogram is flattening.
A bearish crossover pattern is possible in the following candles – a signal of weakening momentum.
RSI:
RSI ~74 – is in the overbought zone, which often heralds a correction or at least consolidation.
A value above 70 confirms the bullish trend but may suggest that momentum is overheated.
📌 Conclusions and Scenarios:
🔼 Upside Scenario (trend continuation):
If the price remains above 3300–3350 USDT, it could move towards 3888, and then 4133 USDT.
A break above 3650 USDT on heavy volume will be a strong continuation signal.
🔽 Corrective scenario (short-term pullback):
The RSI and MACD suggest a possible correction.
Potential pullback to:
3300 USDT (retest of previous resistance as support).
SMA 200 (~2600 USDT) with a deeper downward move.

EUR/USD Forecast – Bears in Control Ahead of US Jobless DataEUR/USD Forecast – Bears in Control Ahead of US Jobless Data
🌐 Macro View: Dollar Regains Strength Amid Uncertainty
EUR/USD remains under selling pressure as the greenback finds renewed strength following midweek weakness. The market is bracing for fresh U.S. jobless claims data, expected to show a slight rise to 235K. A print below 220K could reignite USD demand, while a surprise above 240K may offer a temporary lifeline for the euro.
Amid geopolitical and economic turbulence, the euro continues to underperform as investors shift to the dollar for safety and yield advantage.
📉 Technical Outlook – MMF & Smart Money Perspective
The recent breakdown below 1.1600 confirms the bearish momentum. Based on the MMF (Market Momentum Flow) methodology, price action is currently moving within a controlled distribution structure, suggesting further downside potential.
Key zones identified from H1 structure:
OBS + FVG High Zone (1.1662 – 1.1687): Strong supply zone + volume imbalance.
1.1637: Mid-key level and possible liquidity magnet.
1.1616 – 1.1573: Ideal area for sweeping sell-side liquidity before any sustainable bounce.
If price reclaims 1.1662, intraday bullish correction may be in play. However, as long as 1.1687 holds, bears remain in control.
🧭 Trade Plan for Today
🔴 SELL ZONE: 1.1662 – 1.1687 (FVG + OBS Volume Zone)
SL: 1.1710
TP: 1.1637 → 1.1616 → 1.1590 → 1.1573
✅ Preferred entry zone aligned with high-volume imbalance & MMF rejection pattern.
🟢 BUY ZONE (Scalp Only): 1.1575 – 1.1580 (Sell-side Liquidity Zone)
SL: 1.1550
TP: 1.1612 → 1.1630 → 1.1645
⚠️ Use with caution — only upon clear price reaction at lower liquidity sweep area.
🔍 Strategy Insight
This is a classic scenario of a controlled pullback within a larger bearish structure. Patience is key — let price tap into imbalanced zones before executing. Given today's U.S. data, volatility may spike during the New York session, so risk management is crucial.
💬 What’s Your Take?
Do you expect EUR/USD to retest the 1.1550s zone, or could a surprise from U.S. job data flip the narrative?
👇 Drop your analysis below & follow for more MMF-based setups.

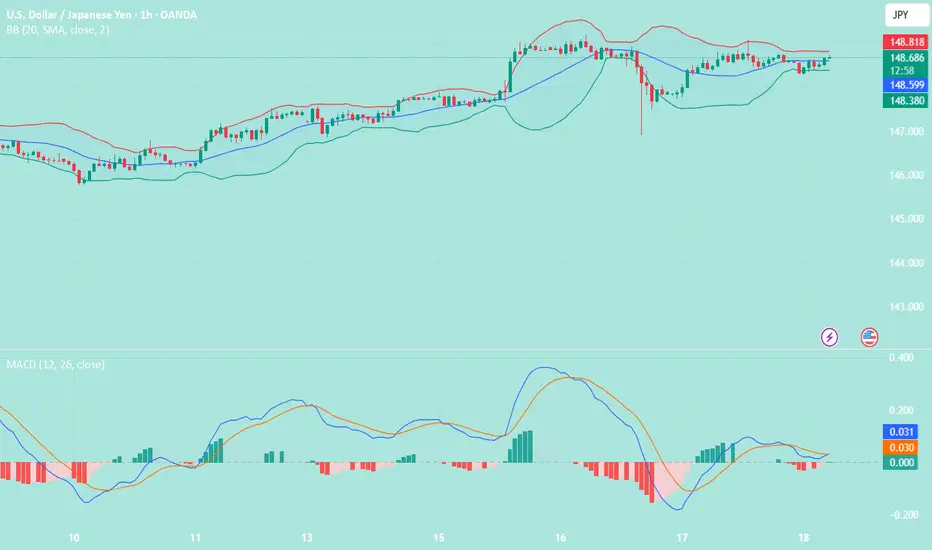
USD/JPY(20250718)Today's AnalysisMarket news:
① Kugler: It is appropriate to keep the interest rate policy stable for "a while".
② Daly: Whether to cut interest rates in July or September is not the most critical.
③ Bostic: It may be difficult to cut interest rates in the short term.
Technical analysis:
Today's buying and selling boundaries:
148.45
Support and resistance levels:
149.80
149.30
148.97
147.93
147.61
147.10
Trading strategy:
If the price breaks through 148.97, consider buying in, the first target price is 149.30
If the price breaks through 148.45, consider selling in, the first target price is 147.93
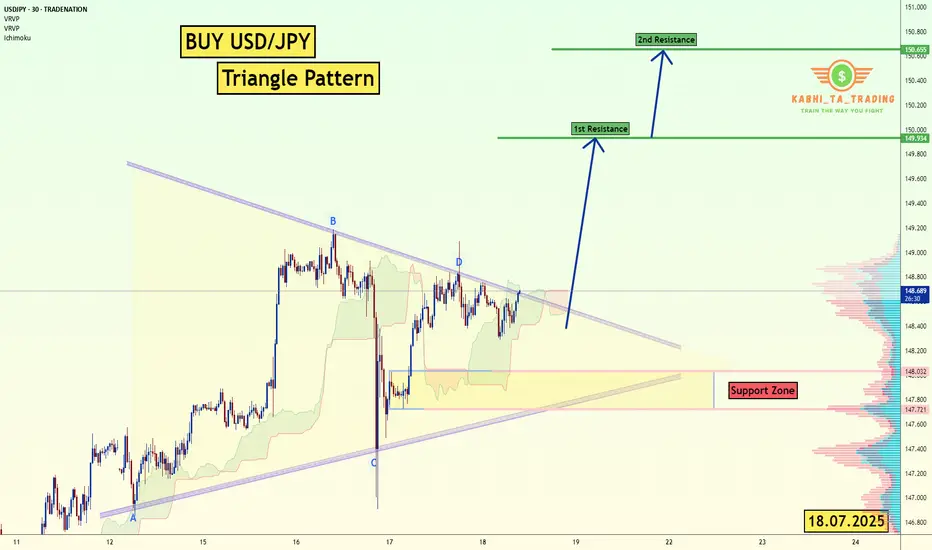
USD/JPY - Triangle Pattern (18.07.2025)The USD/JPY pair on the M30 timeframe presents a Potential Buying Opportunity due to a recent Formation of a Triangle Pattern. This suggests a shift in momentum towards the upside and a higher likelihood of further advances in the coming hours.
Possible Long Trade:
Entry: Consider Entering A Long Position around Trendline Of The Pattern.
Target Levels:
1st Resistance – 149.93
2nd Resistance – 150.65
🎁 Please hit the like button and
🎁 Leave a comment to support for My Post !
Your likes and comments are incredibly motivating and will encourage me to share more analysis with you.
Best Regards, KABHI_TA_TRADING
Thank you.
Disclosure: I am part of Trade Nation's Influencer program and receive a monthly fee for using their TradingView charts in my analysis.
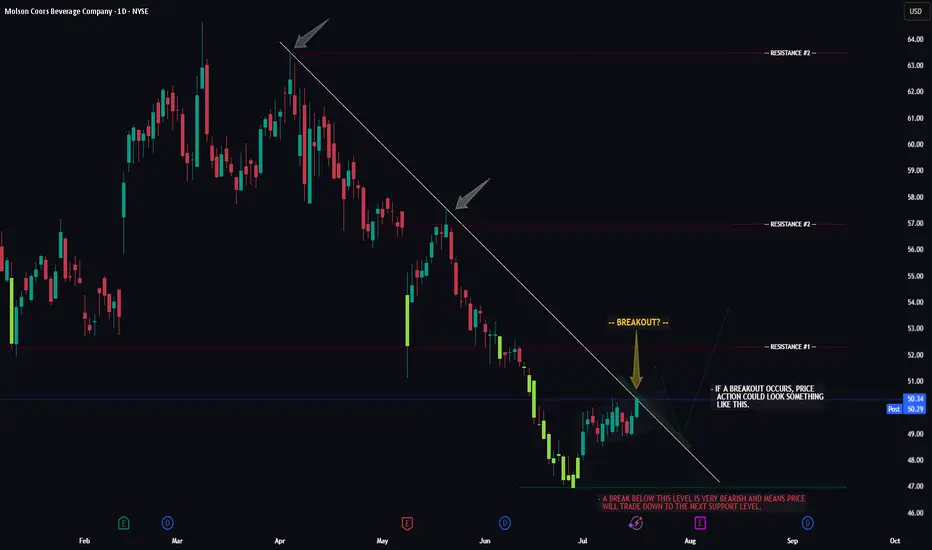
TAP -- Breakout Attempt -- Target LevelsHello Traders!
The chart of TAP (Molson Beer co.) is currently flirting with a major resistance trendline. Now whether or not price can successfully seal the deal and make it too third base remains to be seen.
If price does breakout, watch for a potential retrace to the breakout trendline first, then we could see the larger move to resistance level #1.
If price gets rejected and fails to breakout we could see a move below support before it attempts to breakout again.
Thanks everyone and best of luck with your trading journey!
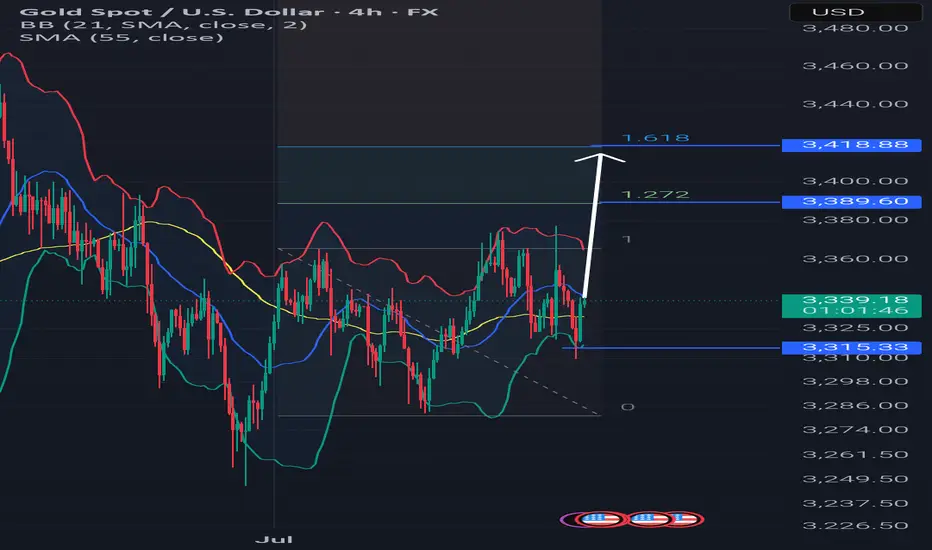
bulish on gold 3389currently no momentom downward.
breakout 3315 more potential riding on sell mode.
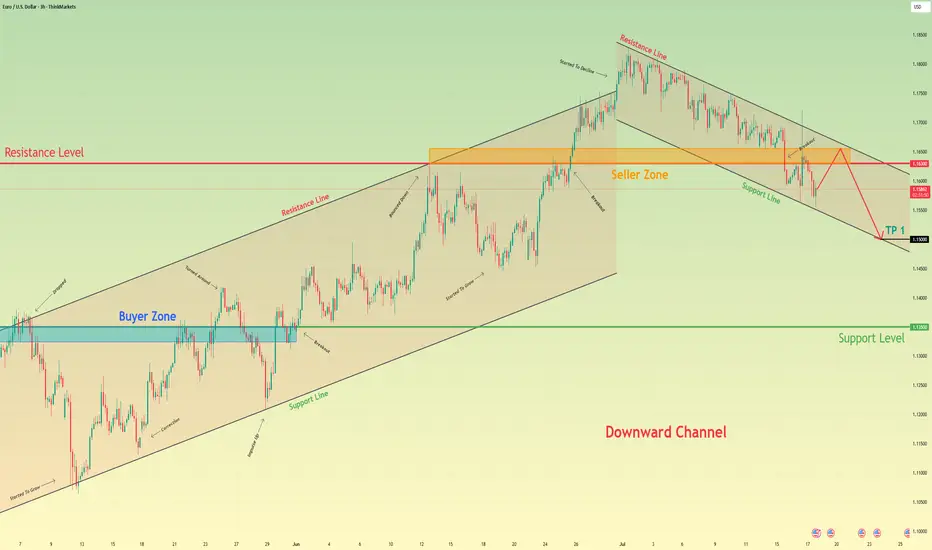
Euro may reach seller zone and then continue to fall in channelHello traders, I want share with you my opinion about Euro. The price pair has recently shifted its market structure, establishing a clear downward channel after breaking its previous uptrend. Before this breakdown, the price was consistently trading within an Upward Channel, repeatedly finding support in the buyer zone (1.1325–1.1350) and reversing upward. The bullish momentum eventually faded when the price failed to break the major horizontal resistance level at 1.1630. This failure triggered a strong bearish impulse, leading to a decisive breakout below the channel's support line and confirming a trend reversal. Currently, the price is making a corrective move up inside the newly formed downward channel, which appears to be a classic retest of the broken structure from below. I expect this upward move to stall as it approaches the heavy confluence of resistance formed by the channel's upper Resistance Line and the horizontal seller zone at 1.1630–1.1655. After testing this area, I anticipate a rejection and the beginning of a new bearish leg down. That's why I've set my TP at the 1.1500 level — it aligns perfectly with the support line of the current downward channel, making it a logical target for sellers. Please share this idea with your friends and click Boost 🚀
Disclaimer: As part of ThinkMarkets’ Influencer Program, I am sponsored to share and publish their charts in my analysis.
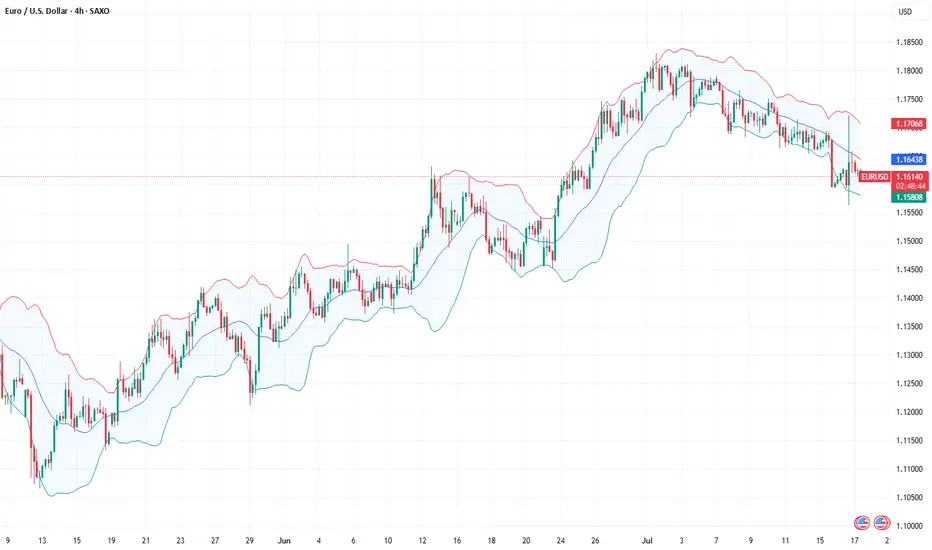
Fundamental Market Analysis for July 17, 2025 EURUSDThe euro is edging back toward the 1.16 – 1.17 range highs after headlines suggesting former U.S. president Donald Trump might try to dismiss Fed Chair Jerome Powell and a softer-than-expected U.S. Producer Price Index (PPI) print pressured the dollar. Political noise around the Fed’s independence, coupled with a cooling inflation pulse, has pushed market pricing toward a longer policy pause; the pair is hovering near 1.16250 at the time of writing.
Fundamental support also stems from the upcoming 24 July ECB meeting. Governing-Council commentary reveals a split between hawks and would-be doves, yet consensus that euro-area inflation remains above target makes an aggressive rate cut unlikely for now. Meanwhile, subdued U.S. Treasury yields—futures price a 95 % probability of no change this month and only 50 bp of total easing over 12 months—help narrow the U.S.–German 10-year spread to about 150 bp.
Against a backdrop of ongoing U.S. trade tensions and steady inflows into euro-area assets, that narrower spread leaves room for EURUSD to grind toward the 1.1680 target if sentiment stays risk-positive.
Trading recommendation: BUY 1.16250, SL 1.15950, TP 1.16800
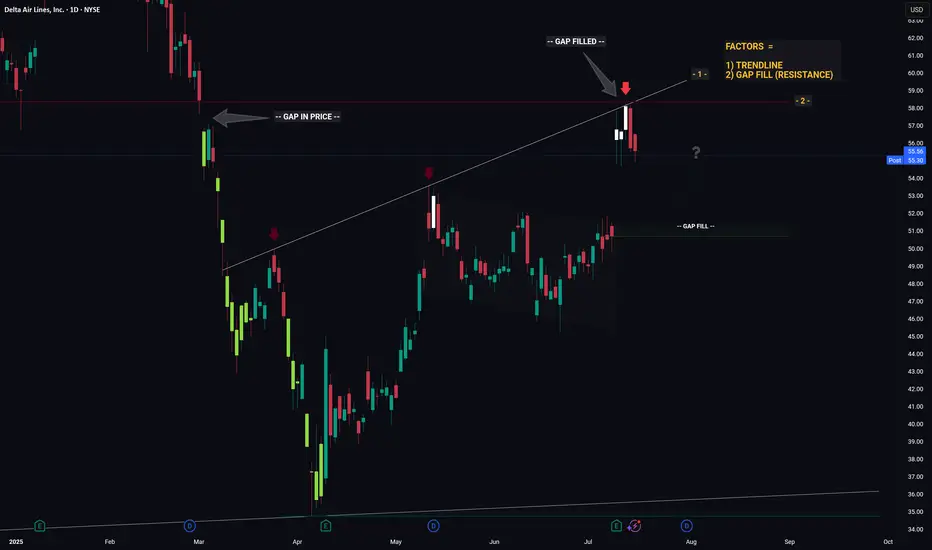
DELTA - Converging Levels Creates Huge Resistance - Retrace?Hello Traders!
Whichever Hedge Fund that is responsible for the recent price action in DELTA mustve been in a generous mood... because theyre giving us an excellent hint as to what price will likely do next.
And what hint might that be you ask...
1) Trendline (connecting the recent highs)
2) Gap Fill (Resistance)
Individually these factors are relatively strong, however when combined they essesntially create a strong barrier that will be very hard for price to break through. Think about it like a wall made from Captain Americas shield... now try and break through that.. aint gonna be easy.
So whats next for price? If I was a betting man (and I am, incase you were wondering) I would say theres a high probability that price is going to trade down from this resistance level then retrace to the gap fill below. From the gap fill level we will likely see a bounce.
Thanks, I hope you found this post educational or helpful and best of luck on your trading journey!
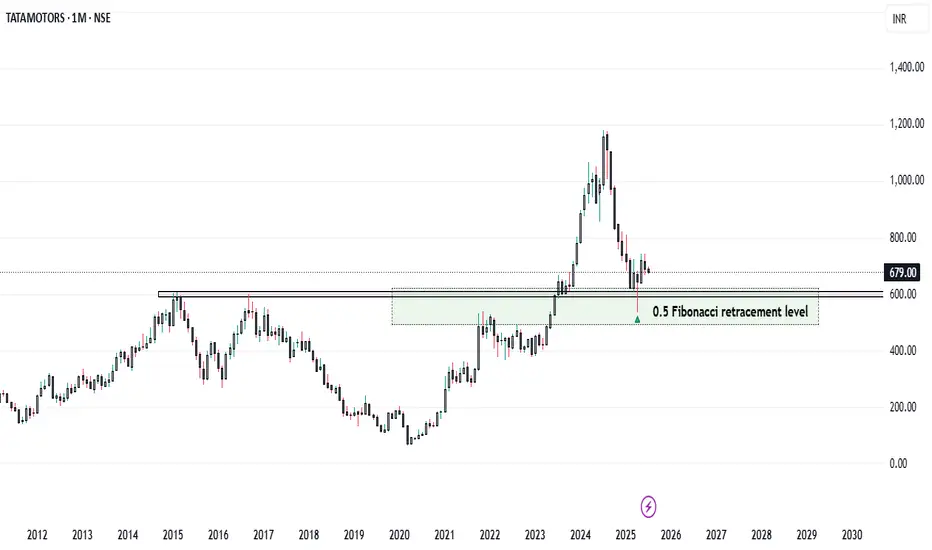
Tata Motors: From Profit Pressure to Growth Potential... Company Overview
* Name: Tata Motors Ltd.
* Industry: Automotive
* Key Segments: Passenger Vehicles (PV), Commercial Vehicles (CV), Electric Vehicles (EV), Jaguar Land Rover (JLR)
* FY25 Milestone: The Automotive business became debt-free
Q4 FY25 Performance Overview
* Net Profit: ₹8,556 crore (Down 51% YoY)
* Reason for Decline:
* High base due to deferred tax benefit in Q4 FY24
* Lower domestic volumes in PV and CV segments
* Reduced operating leverage amid falling demand
* Revenue: Marginal YoY increase (Consolidated revenue at record level for FY25)
* Positive Developments Despite Profit Decline :
* JLR Profitability Improvement
* Profit rose despite slightly lower revenue
* Supported by higher volumes and reduced depreciation
* Debt-Free Automotive Division:
* Major financial milestone for FY25 :
* Record Annual Revenue:
* Highest consolidated revenue in Tata Motors' history
* Future-Focused Investments:
* Capital allocation towards EVs, new product development, and manufacturing capacity
Strategic Growth Drivers – Reasons for Optimism
1. Electric Vehicle (EV) Leadership
* Tata Motors holds a dominant position in India’s EV market
* Plans to launch 10 EV models by 2026
* Battery Gigafactory is expected to begin production in 2026
* Strong alignment with India’s clean mobility goals
2. Expanding Product Portfolio
* Focused on SUV and ₹10–20 lakh price segments
* Upcoming launches:
* Curvv EV
* Harrier EV
* Sierra EV
* Strategy to cater to diverse customer preferences
3. Improving Financial Health
* Targeting 10% EBITDA across PV and EV divisions
* Demerger of CV and PV businesses to streamline operations and unlock value
4. Strong Base in Commercial Vehicles
* Market leader with 37.83% share in EV segment
* CV recovery is expected with infrastructure and rural demand growth
5. Supportive Macroeconomic and Policy Environment
* Government incentives: FAME II, PLI scheme
* EV-friendly policies encouraging domestic manufacturing
* Economic tailwinds: rising disposable income, urbanization, rural penetration
Risks and Challenges Ahead
* Intensifying Competition:
* Pressure from Maruti Suzuki, Hyundai, and new players
* Global Geopolitical and Trade Risks:
* US tariffs, material shortages (e.g., rare earths for EVs)
* Domestic Demand Slowdown:
* Inflation and high interest rates are affecting affordability
* Jaguar Land Rover’s Transition Challenges:
* EV transformation complexity
* Global demand volatility
* Production ramp-up hurdles
Conclusion
Tata Motors is at a pivotal juncture. While short-term profitability has taken a hit due to exceptional prior-year gains and cyclical volume pressures, the company’s fundamentals remain strong. Its leadership in EVs, ambitious expansion plans, and a now debt-free automotive business position it for long-term success.
However, realizing this potential depends on:
* Execution of its EV roadmap
* Sustained domestic demand
* Managing global uncertainties
* Staying competitive in an evolving auto landscape
Strategic Verdict:
Short-term caution, long-term confidence.
Tata Motors appears well-poised for a resilient comeback, driven by structural transformation and market-aligned growth strategies.
GOLD - Price can start to decline and break support levelHi guys, this is my overview for EURUSD, feel free to check it and write your feedback in comments👊
Gold initially traded inside a steady falling channel, carving lower highs at $3390 and lower lows around $3285 as bears held sway.
A brief fake breakout at $3365 briefly flipped sentiment, but sellers quickly reasserted control and pushed price back toward the channel floor.
Buyers then absorbed selling at the $3285 support area, sparking a rebound into a rising wedge pattern marked by converging trendlines.
Within this wedge, three minor breakouts failed to trigger sustained rallies, underscoring persistent resistance near the upper boundary.
I anticipate Gold to roll over from the wedge’s ceiling and break below $3365, targeting the wedge’s lower support line at $3310
If this post is useful to you, you can support me with like/boost and advice in comments❤️
Disclaimer: As part of ThinkMarkets’ Influencer Program, I am sponsored to share and publish their charts in my analysis.
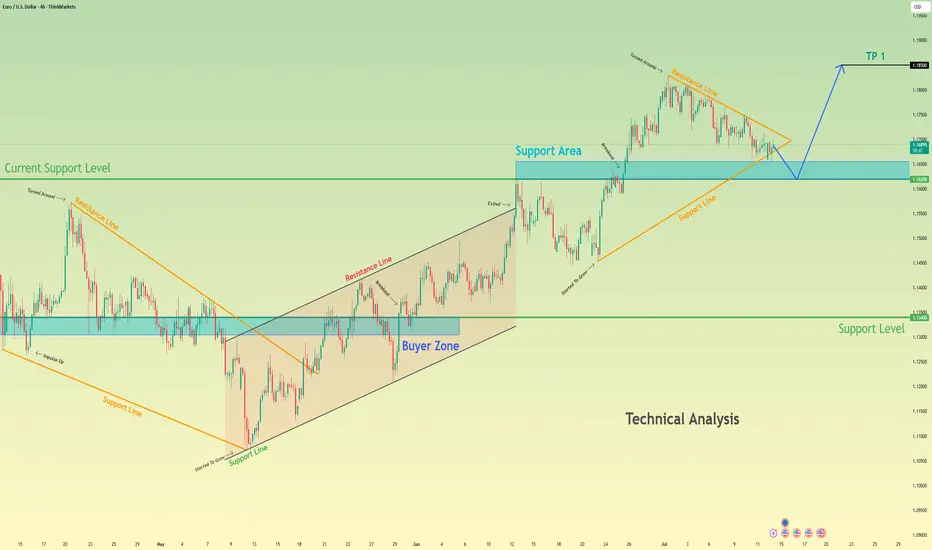
Euro may fall to support area and then start to growHello traders, I want share with you my opinion about Euro. The price previously moved inside a wedge formation, where it tested the buyer zone and showed a strong reaction from this area. After that, the pair broke out upward and started to trade inside an upward channel, building momentum and forming a clear bullish structure. Later, the price created a pennant pattern, often considered a continuation signal. But before continuing the upward trend, I expect the Euro to first exit from the pennant and decline toward the support area. This zone was previously resistantce, and now it may turn into a strong support. Now the price is trading near the pennant resistance, but I don’t expect a breakout right away. The market needs to correct before it resumes the uptrend. Once the price reaches the current support level or slightly lower, it may find demand again and bounce. That’s why I expect the Euro to retest the support zone and then grow further toward TP 1 - 1.1850 points. This target aligns with the upper border of the upward channel and would complete the continuation move after the pennant breakout. Given the previous structure, bullish momentum, and patterns on the chart, I remain bullish after the correction and expect the price to rise from the support zone. Please share this idea with your friends and click Boost 🚀
Disclaimer: As part of ThinkMarkets’ Influencer Program, I am sponsored to share and publish their charts in my analysis.
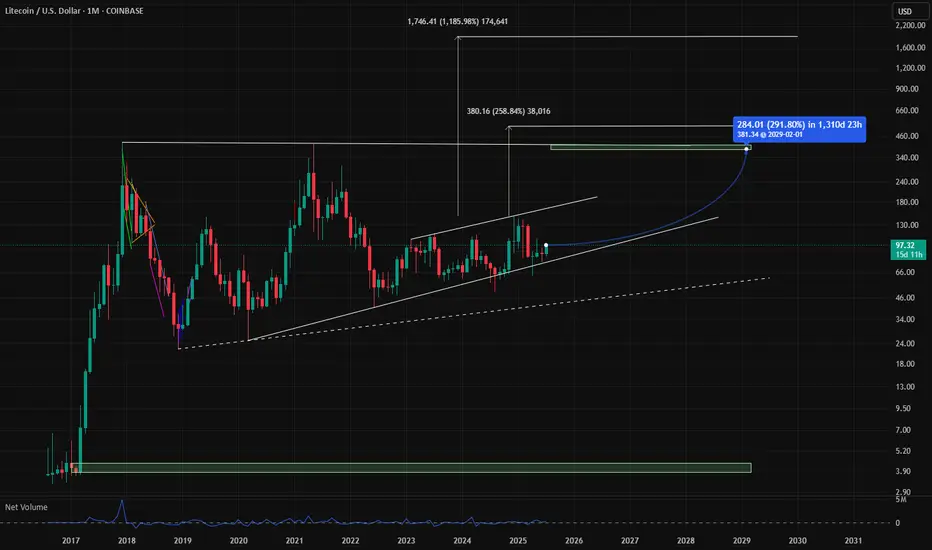
LTC Targets 400$ + 1900$ Litcoin LTC Targets for the next run are atm +290% is a realistic szenario. The addvanced targets at 1900$ are very impressiv but remember there are only 21 Mio. Coins too, like BTC because it is the fork and think about an alternative payment methode like btc, would be a reason for 1900$ pro LTC. So in Crypto is nothing unreal if you could imagine, but first of all approx. 400$ are a good direction. GM
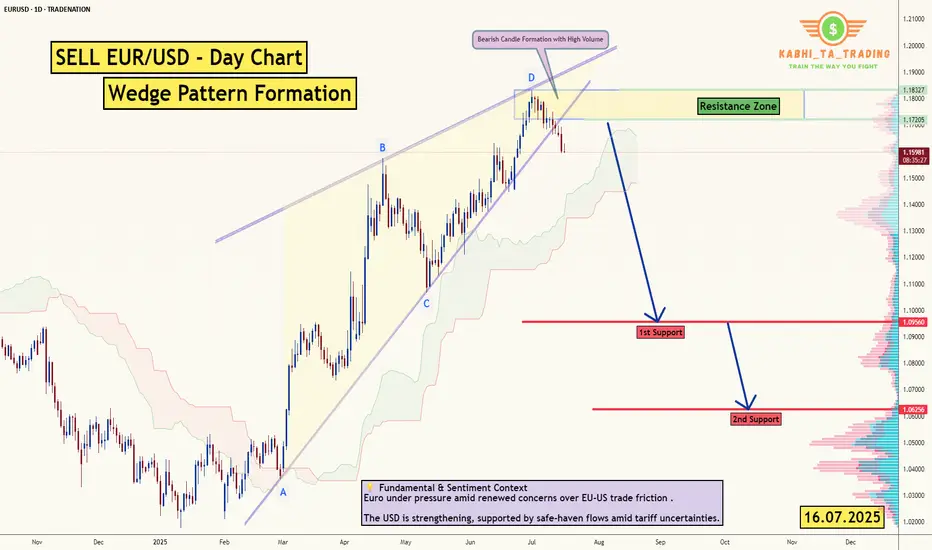
EUR/USD - Daily Chart (Wedge Breakout) (16.07.2025) The EUR/USD Pair on the D1 timeframe presents a Potential Selling Opportunity due to a recent Formation of a Wedge Pattern. This suggests a shift in momentum towards the downside in the coming Days.
Possible Short Trade:
Entry: Consider Entering A Short Position around Trendline Of The Pattern.
Target Levels:
1st Support – 1.0956
2nd Support – 1.0625
💡 Fundamental & Sentiment Context
Euro under pressure amid renewed concerns over EU‑US trade friction .
The USD is strengthening, supported by safe‑haven flows amid tariff uncertainties.
🎁 Please hit the like button and
🎁 Leave a comment to support for My Post !
Your likes and comments are incredibly motivating and will encourage me to share more analysis with you.
Best Regards, KABHI_TA_TRADING
Thank you.
Disclosure: I am part of Trade Nation's Influencer program and receive a monthly fee for using their TradingView charts in my analysis.
Fundamental Market Analysis for July 16, 2025 USDJPYEvent to Watch Today:
15:30 EET. USD – Producer Price Index
USDJPY:
USD/JPY has stabilized around 148.900, maintaining upside potential due to:
Interest Rates: The Fed keeps yields elevated (10-year bonds at 4.46%), while the Bank of Japan maintains an ultra-loose policy, keeping real yields negative.
Political Uncertainty: Upcoming elections in Japan and possible fiscal tightening reduce the yen’s appeal.
Dollar Demand: Trade frictions and geopolitical risks drive safe-haven flows into the dollar.
A break above 149.000 could open the path to 149.500. Support at 148.600 remains a critical barrier for the bullish scenario.
Trade Recommendation: BUY 149.000, SL 148.700, TP 149.900