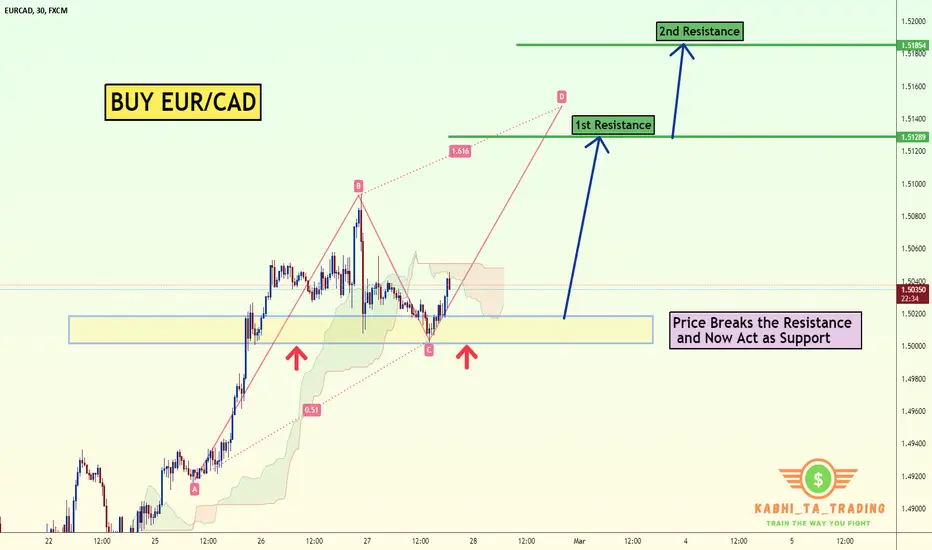
EUR/CAD Buy @ Support ZoneThe EUR/CAD pair on the M30 timeframe presents a Potential Buying Opportunity due to a recent Formation of a AB=CD Pattern. This suggests a shift in momentum towards the upside and a higher likelihood of further advances in the coming hours.
Possible Long Trade:
Entry: Consider Entering A Long Position around Trendline Of The Pattern.
Target Levels:
1st Resistance – 1.5128
2nd Resistance – 1.5185
🎁 Please hit the like button and
🎁 Leave a comment to support for My Post !
Your likes and comments are incredibly motivating and will encourage me to share more analysis with you.
Best Regards, KABHI_TA_TRADING
Thank you.
Analysis
Trump's Bombshell Strategic Reserve Announcement.Let's summarize the situation.
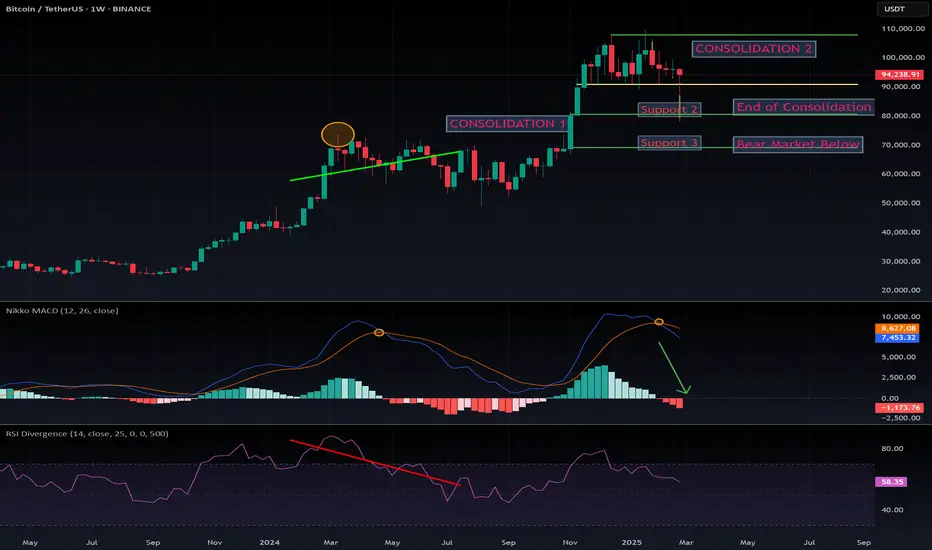
We were on the edge of slipping into a bear market, with CRYPTOCAP:BTC under heavy selling pressure and looking bearish on daily, hourly, and weekly timeframes.
A lot of people were caught off guard, selling their crypto to prepare for shorts and ending up sidelined—I was one of them, and I’m pissed. Since I live in Asia, I was asleep when it happened, and so was the entire Asian market.
Then, conveniently, Trump announced the strategic crypto reserve, which was originally scheduled for Friday to coincide with the White House crypto summit. Meanwhile, the tariffs are set to take effect on Tuesday.
On the global stage:
- The rejection of Zelensky has pushed Europe to react, with some leaders now considering sending troops to Ukraine. This could seriously complicate things for the Trump administration and potentially escalate into WWIII. No joke, this is a serious situation.
- Israel has decided to destroy Gaza completely and is now enforcing a full-scale siege, which will cause massive international backlash. The situation there never been so bad.
- Recession fears are mounting, and we can see markets starting to shake and correct.
And then Trump drops his crypto reserve announcement…
- This was a sloppy reveal—posted only on his own platform, not on X—which caused panic, as people scrambled to verify the source, thinking it was fake news.
- Even worse, the initial announcement didn’t mention Bitcoin or Ethereum! Instead, they listed CRYPTOCAP:XRP , Cardano, and Solana as part of the reserve, which made people think their accounts were hacked. Later, they corrected it, clarifying that CRYPTOCAP:BTC and CRYPTOCAP:ETH are at the "heart" of the reserve.
So yeah… Sunday night, completely unexpected, and poorly executed.
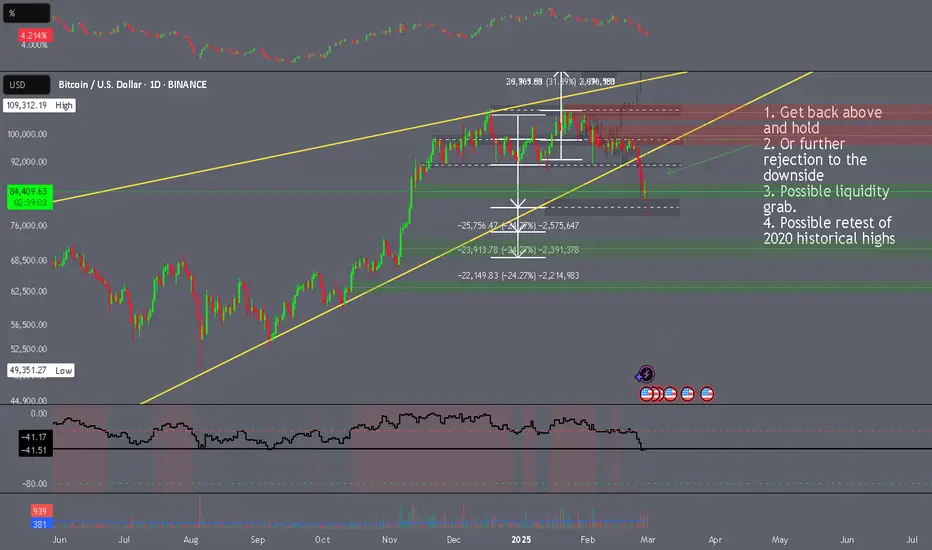
What does this mean for CRYPTOCAP:BTC ?
- Weekly timeframe: Nothing has changed—it’s still in a serious correction, and a 10% daily pump isn’t enough to reverse the trend. My previous analysis is still valid.
- Daily timeframe: The MACD has reset, and RSI is now in a neutral zone. This suggests a potential short-term pump over the next few days.
- Key levels: Supports at $91k and $80k are back, but $99k remains a major resistance and could reject $BTC.
- Leverage & liquidity: A massive $4.3 billion in longs has been built up, meaning we’re likely to retest the downside to liquidate them.
- CME gap: We just created a 10%+ CME gap, which will most likely be filled.
Conclusion:
Optimism is back, and we could see a short altseason as capital flows into altcoins, now that some are officially part of the U.S. national reserve.
BUT the global situation remains extremely concerning:
- War tensions in Europe and the Middle East
- Recession risks still on the table
- Uncertainty about how this crypto reserve will actually work
This is great news, but going all-in on longs at this point seems risky. How long will this momentum last? More than a week? I’m not sure.
Technically, the correction isn’t over. Unlike December 2024—when Trump’s election happened at the end of a correction, with a bullish MACD crossover—we are now at the START of a weekly correction, which could last until May 2025.
So yeah, fundamentally bullish, but technically, the correction still has room to go.
#BTC Short idea, #FVGIn this selling trend, it's a great opportunity to try short from this FVG I have noticed.
I'm going to try with minimum risk. 1:4 RR
Let's see.


Can we go for a R/R2 Buy Position on AUSUSD?After the big drop seems that it'll have correction to 0.63...
This is only an idea...
Please manage your risk...

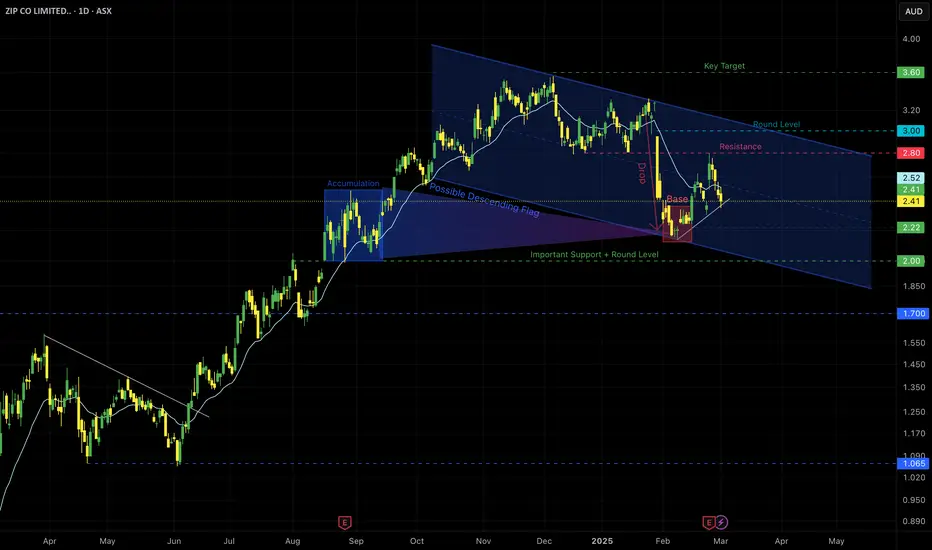
Is the ZIP DIP OVER? Is it a suitable time to Buy?Is the Base solid enough to drive the price to 3 OR will it require a manipulation below the base to test key support "2"?
THIS IS ONLY AN IDEA AND COULD BE RIGHT...
For the Fundamental lovers:
Also keep in mind:
Dow Jones Newswires:
"Zip Price Target Raised 5.9% to A$3.60/Share by Ord Minnett"
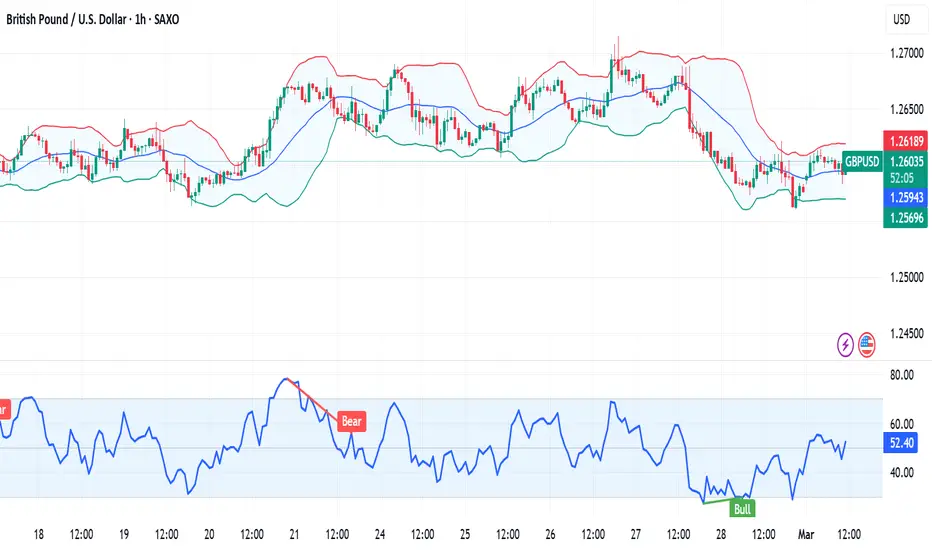
Fundamental Market Analysis for March 3, 2025 GBPUSDThe US Dollar Index (DXY), which tracks the dollar against a basket of currencies, started the new week on a weak note and has already cancelled out most of Friday's gains to more than a one-week high.
The British Pound (GBP), on the other hand, continues to post relative gains amid expectations of a less aggressive easing policy from the Bank of England (BoE). That said, concerns over US President Donald Trump's retaliatory tariffs and their impact on the UK economy may keep GBP bulls away from new bets. In addition, geopolitical risks could limit deeper USD losses and limit GBP/USD gains.
Meanwhile, signs that the disinflation process in the US has stalled, reinforcing the case for the Fed to take a wait-and-see approach to future interest rate cuts, could also serve as a tailwind for the USD. This could help to further contain GBP/USD and warrant some caution before positioning for a resumption of the recent uptrend from levels below 1.2100, or the yearly low reached on 13 January.
The main focus will be on the closely watched monthly US employment data on Friday. The widely-reported Nonfarm Payrolls (NFP) figure will shape expectations on the path of the Fed rate cut and drive demand for the dollar in the near term.
Trading recommendation: BUY 1.2610, SL 1.2560, TP 1.2690
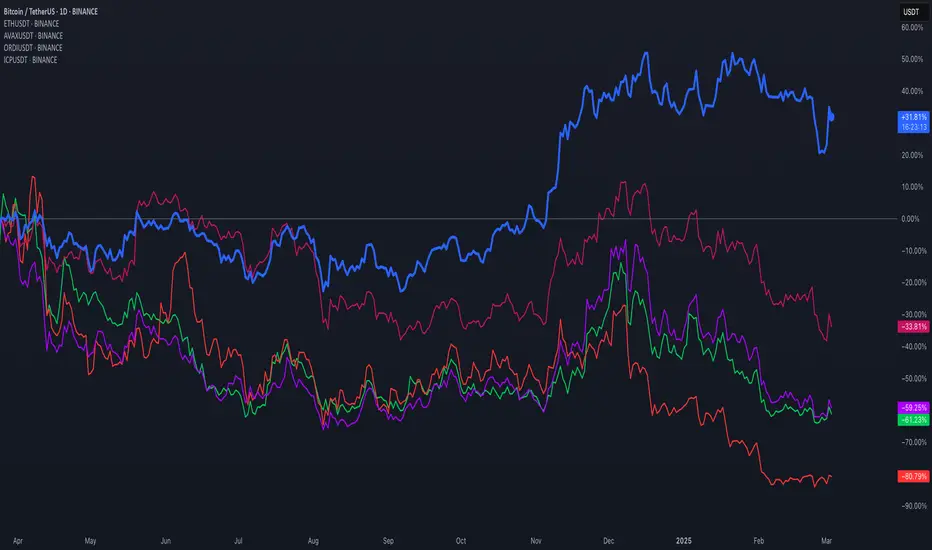
How to pick a benchmark for you portfolio and beat the market What is a benchmark?
A benchmark is an index or a basket of assets used to evaluate the performance of an investment portfolio In the context of portfolio analysis the benchmark serves as a point of comparison to determine whether a fund a strategy or an investment is performing better worse or in line with the reference market.
In the current chart, Bitcoin ( BINANCE:BTCUSDT ) is displayed with a solid and larger blue line in relation to other cryptocurrencies for the current period.
Benchmarks are essential tools for institutional and private investors as they allow measuring the effectiveness of asset allocation choices and risk management Additionally they help determine the added value of an active manager compared to a passive market replication strategy.
Benchmark analysis example: NASDAQ:TSLA - NASDAQ:NDX
Benchmark analysis example: NASDAQ:TSLA - NASDAQ:AAPL - NASDAQ:NDX
What is the purpose of a benchmark
The use of a benchmark in portfolio analysis has several objectives
1) Performance Evaluation: Provides a parameter to compare the portfolio's return against the market or other funds
2) Risk Analysis: Allows comparing the volatility of the portfolio against that of the benchmark offering a measure of risk management
3) Performance Attribution: Helps distinguish between returns derived from asset selection and those linked to market factors
4) Expectation Management: Supports investors and managers in assessing whether a portfolio is meeting expected return objectives
5) Strategy Control: If a portfolio deviates excessively from the benchmark it may signal the need to review the investment strategy
How to select an appropriate benchmark?
The choice of the correct benchmark depends on several factors:
1) Consistency with Portfolio Objective: The benchmark should reflect the market or sector in which the portfolio operates
2) Representativeness of Portfolio Assets: The benchmark should have a composition similar to that of the portfolio to ensure a fair comparison
3) Transparency and Data Availability: It must be easily accessible and calculated with clear and public methodologies
4) Stability Over Time: A good benchmark should not be subject to frequent modifications to ensure reliable historical comparison
5) Compatible Risk and Return: The benchmark should have a risk and return profile similar to that of the portfolio
Most used benchmarks
There are different benchmarks based on asset type and reference market Here are some of the most common.
Equity
FRED:SP500 Representative index of the 500 largest US companies.
NYSE:MSCI World Includes companies from various developed countries ideal for global strategies
FTSE:FTSEMIB Benchmark for the Italian stock market
NASDAQ:NDX Represents the largest technology and growth companies
Bonds
Barclays Global Aggregate Bond Index Broad benchmark for the global bond market
JP Morgan Emerging Market Bond Index EMBI Benchmark for emerging market debt
[* ]BofA Merrill Lynch US High Yield Index Representative of the high-yield bond market junk bonds
Mixed or Balanced
6040 Portfolio Benchmark 60 equities SP 500 and 40 bonds Bloomberg US Aggregate used to evaluate balanced portfolios
Morningstar Moderate Allocation Index Suitable for moderate-risk investment strategies
Alternative
HFRI Fund Weighted Composite Index Benchmark for hedge funds
Goldman Sachs Commodity Index GSCI Used for commodity-related strategies
Bitcoin Index CoinDesk BPI Benchmark for cryptocurrencies
A reference benchmark is essential in portfolio analysis to measure performance manage risk and evaluate investment strategies The selection of an appropriate benchmark must be consistent with the strategy and market of the portfolio to ensure meaningful comparison.
Understanding and correctly selecting the benchmark allows investors to optimize their decisions and improve long-term results.
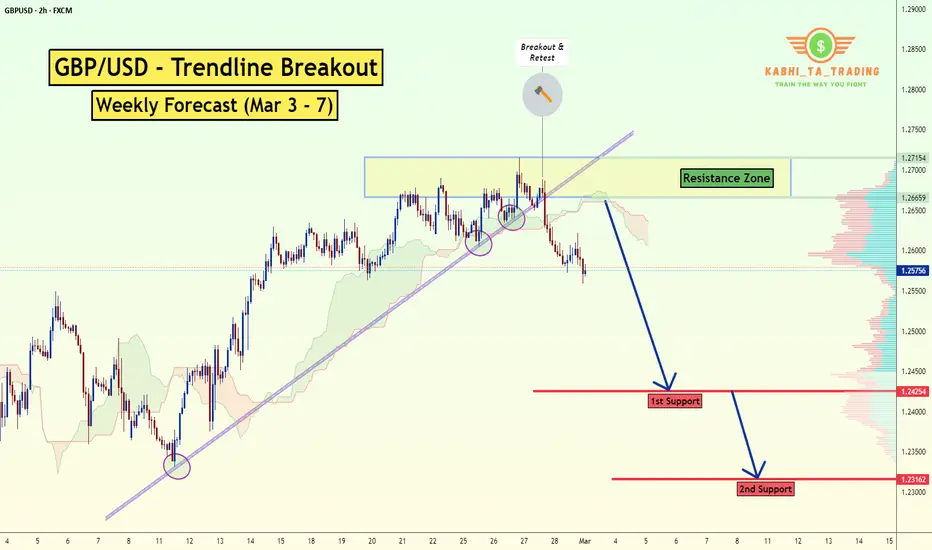
GBP/USD Trendline Breakout (Weekly Forecast Mar 3 - 7)The GBP/USD Pair on the H2 timeframe presents a Potential Selling Opportunity due to a recent Formation of a Trendline Breakout Pattern. This suggests a shift in momentum towards the downside in the coming hours.
Possible Short Trade:
Entry: Consider Entering A Short Position around Trendline Of The Pattern.
Target Levels:
1st Support – 1.2425
2nd Support – 1.2316
🎁 Please hit the like button and
🎁 Leave a comment to support for My Post !
Your likes and comments are incredibly motivating and will encourage me to share more analysis with you.
Best Regards, KABHI_TA_TRADING
Thank you.
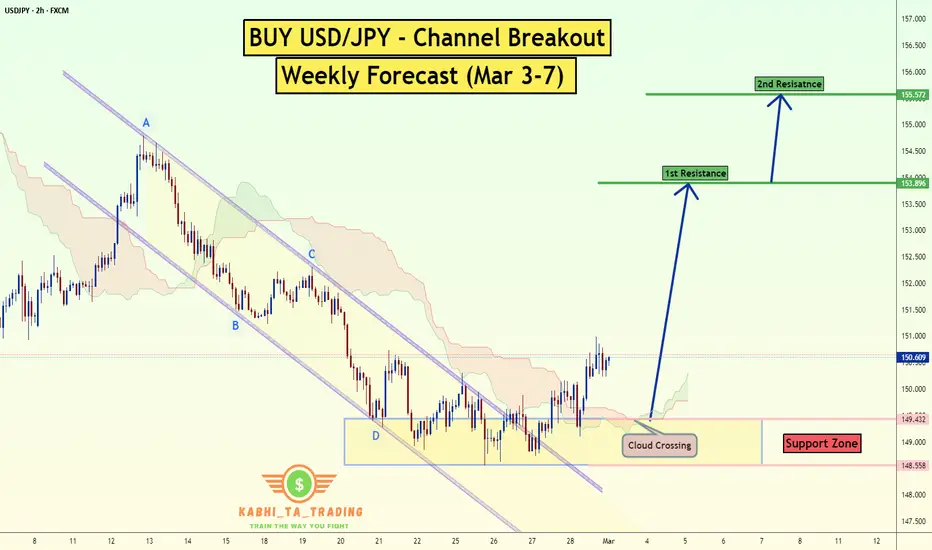
USD/JPY Channel Breakout (Weekly Forecast Mar 3-7)The USD/JPY pair on the H2 timeframe presents a Potential Buying Opportunity due to a recent Formation of a Channel Breakout Pattern. This suggests a shift in momentum towards the upside and a higher likelihood of further advances in the coming hours.
Possible Long Trade:
Entry: Consider Entering A Long Position around Trendline Of The Pattern.
Target Levels:
1st Resistance – 153.90
2nd Resistance – 155.60
🎁 Please hit the like button and
🎁 Leave a comment to support for My Post !
Your likes and comments are incredibly motivating and will encourage me to share more analysis with you.
Best Regards, KABHI_TA_TRADING
Thank you.
USD/CHF Wedge Breakout (Weekly Forecast Mar 3-7)The USD/CHF pair on the H2 timeframe presents a Potential Buying Opportunity due to a recent Formation of a Wedge Breakout Pattern. This suggests a shift in momentum towards the upside and a higher likelihood of further advances in the coming hours.
Possible Long Trade:
Entry: Consider Entering A Long Position around Trendline Of The Pattern.
Target Levels:
1st Resistance – 0.9138
2nd Resistance – 0.9221
🎁 Please hit the like button and
🎁 Leave a comment to support for My Post !
Your likes and comments are incredibly motivating and will encourage me to share more analysis with you.
Best Regards, KABHI_TA_TRADING
Thank you.

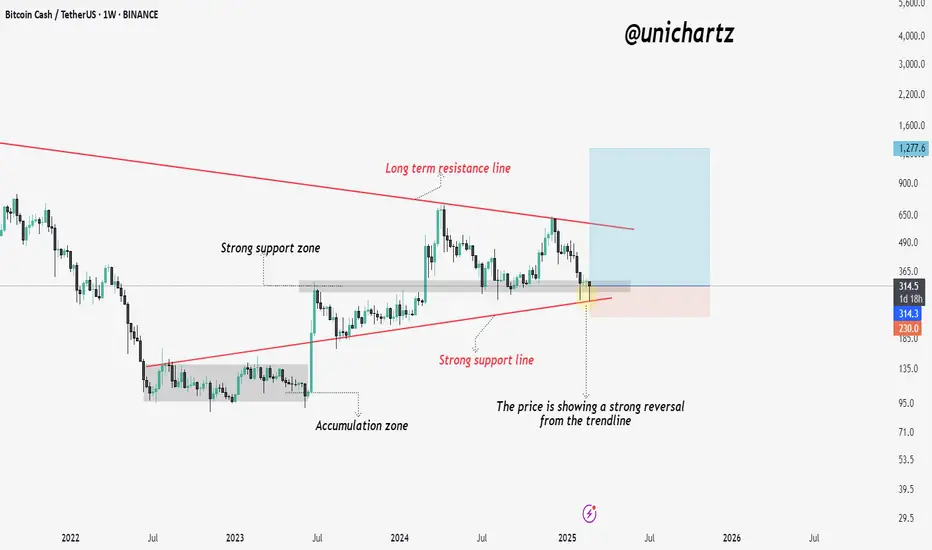
Bitcoin Cash at Critical Trendline – Next Big Move?Bitcoin Cash (BCH/USDT) is currently showing signs of a strong reversal after testing a key support zone and the ascending trendline. This level has acted as critical support in previous price cycles, making it an important area to watch.
The price has rebounded from the strong support line, which aligns with the accumulation zone from early 2023. Additionally, BCH remains within a long-term descending channel, with the upper resistance line acting as a ceiling for previous bullish moves.
Remember!Remember guys,
Pay attention to the technicals
Plan ahead
The news is just a distraction
Price is everything
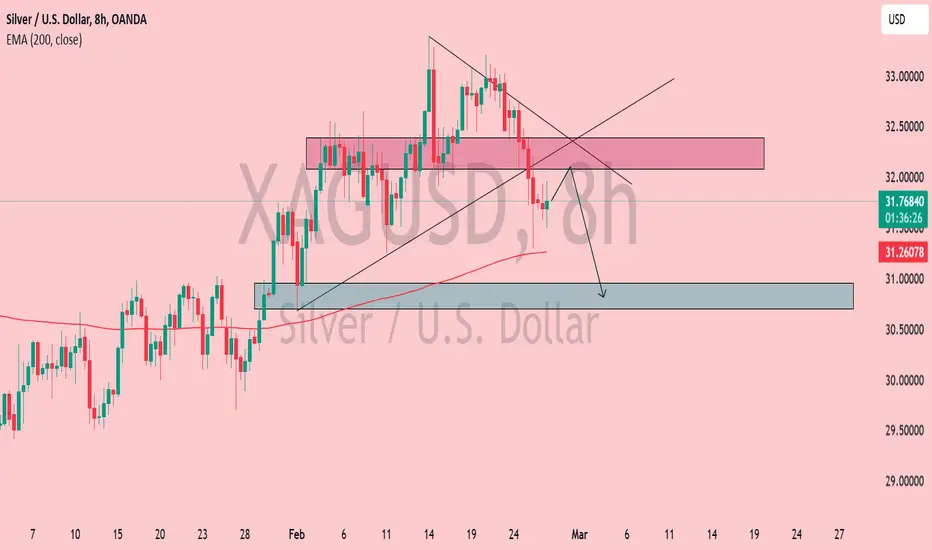
Silver (XAG/USD) Bearish Retest – Drop to $31 Incoming?Silver (XAG/USD) - 8H Chart Analysis
📉 Bearish Setup in Play
Breakout & Retest: Price broke down from a wedge pattern and is currently retesting the supply zone (highlighted in red).
EMA (200) Support: The 200 EMA (31.26) is acting as dynamic support. If price holds below, further downside is expected.
Bearish Target: A move towards the demand zone (30.80 - 31.00) (blue area) is anticipated.
Key Resistance: The rejected zone around 32.00 remains crucial for trend direction.
💡 Trade Idea:
If rejection is confirmed at the supply zone, short positions targeting 31.00 look promising.
A break above 32.00 could invalidate the bearish outlook.
🔥 Watch for confirmation! 🚀
Fundamental Market Analysis for February 28, 2025 EURUSDEUR/USD remains under selling pressure near 1.0390 during Asian trading on Friday. The euro (EUR) is weakening against the US dollar (USD) amid risk-off sentiment. The US Personal Consumption Expenditure (PCE) price index will take centre stage later on Friday.
Late Thursday, US President Donald Trump said that 25 per cent duties on imports from Canada and Mexico will take effect on March 4, rather than April 2 as he had anticipated the day before. Trump also said goods from China would be subject to an additional 10 per cent duties. He also promised this week to impose 25 per cent tariffs on shipments from the European Union. Tariff uncertainty from Trump is likely to weigh on the common currency in the near term.
Cleveland Fed President Beth Hammack said on Thursday she expects the US central bank's interest rate policy to be put on hold for now amid a search for evidence that inflationary pressures are easing and returning to the 2 per cent target. Meanwhile, Atlanta FRB President Raphael Bostic said late Wednesday that the Fed should keep interest rates on hold, which continues to put downward pressure on inflation. The Fed's cautious stance could boost the US Dollar and serve as a headwind for EUR/USD.
Trade recommendation: SELL 1.0380, SL 1.0430, TP 1.0300

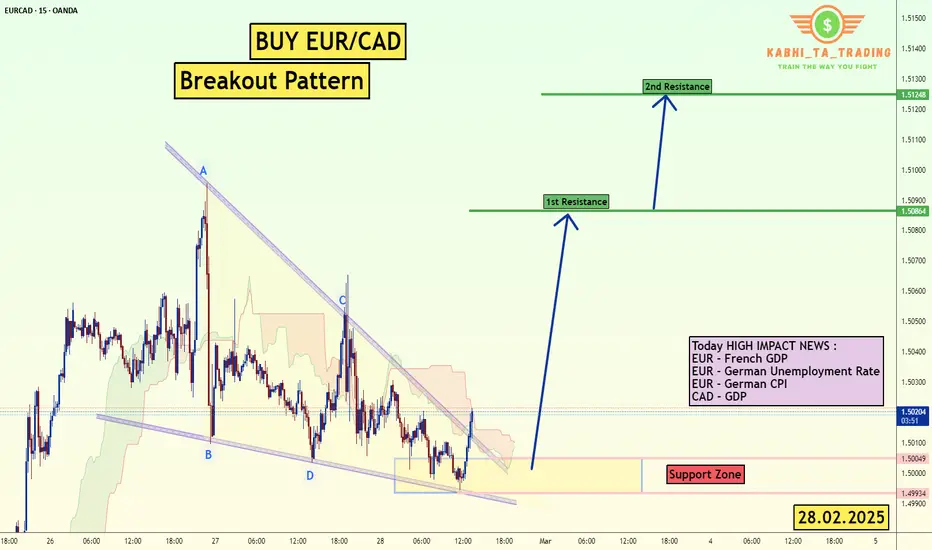
Buy EUR/CAD High Impact NewsThe EUR/CAD pair on the M15 timeframe presents a Potential Buying Opportunity due to a recent Formation of a Breakout Pattern. This suggests a shift in momentum towards the upside and a higher likelihood of further advances in the coming hours.
Possible Long Trade:
Entry: Consider Entering A Long Position around Trendline Of The Pattern.
Target Levels:
1st Resistance – 1.5086
2nd Resistance – 1.5124
🎁 Please hit the like button and
🎁 Leave a comment to support for My Post !
Your likes and comments are incredibly motivating and will encourage me to share more analysis with you.
Best Regards, KABHI_TA_TRADING
Thank you.