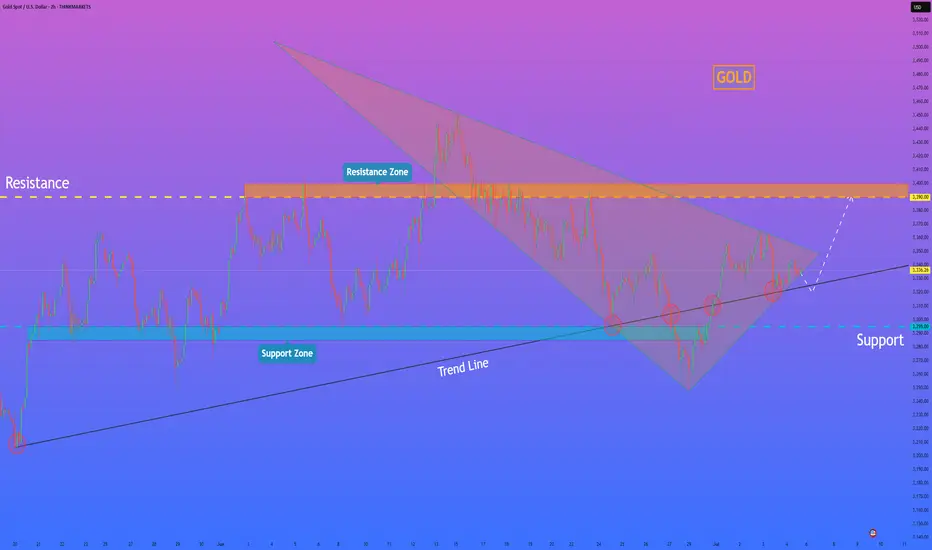
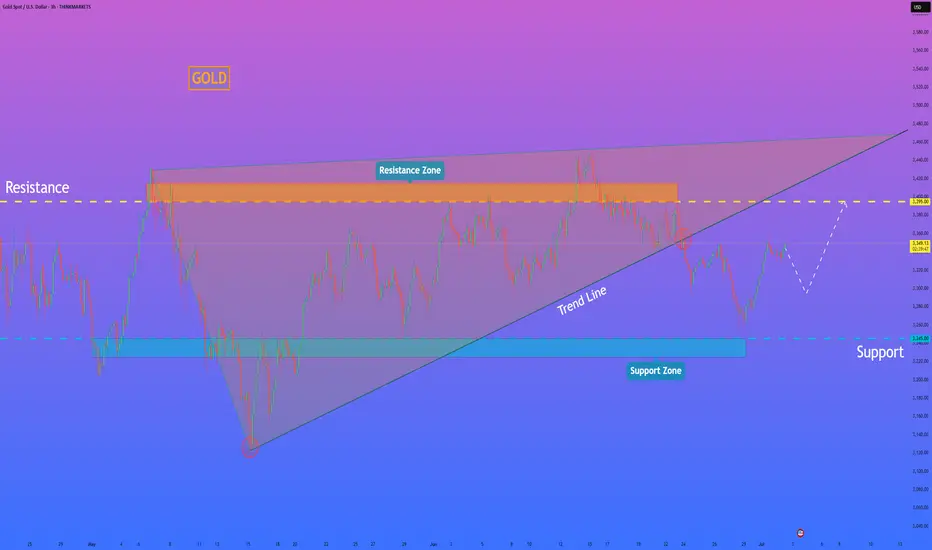
HelenP I. Gold can correct to trend line and then bounce upHi folks today I'm prepared for you Gold analytics. If we look at the chart, we can see that gold has formed a broadening wedge pattern with several touches of the trend line, which acts as a dynamic support. After a strong drop, the price found support near the 3295 level and rebounded, forming a local upward movement. However, bulls have not yet shown a strong impulse, and the price is still trading below the resistance zone between 3390 and 3400 points. Currently, the price is hovering just above the trend line, and appears to be testing this support again. I expect a short decline, possibly to the area around 3295 - 3285 points - that’s the key support zone. If this area holds and we see a bounce, it will confirm that buyers are still active and ready to push the price up again. In this case, we could see gold continue moving inside the wedge pattern and aim for the upper resistance. My goal is set at the 3390 level, right near the wedge's upper border and strong resistance. This target matches the local highs from previous attempts, and if bulls gain momentum, they may try to break through this zone. But for now, I remain cautiously bullish and expect gold to bounce off the trend line and move upward toward the resistance. If you like my analytics you may support me with your like/comment.❤️
Disclaimer: As part of ThinkMarkets’ Influencer Program, I am sponsored to share and publish their charts in my analysis.
Analysis
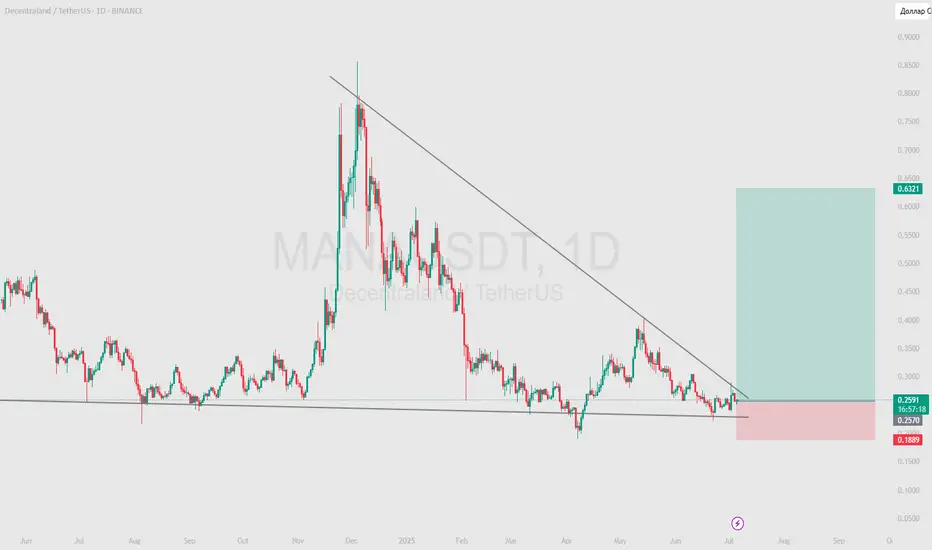
MANA - move in support and then shoot at 150%Price Prediction:
Short Term (1-3 Days):
The price may continue to move within the falling wedge, maintaining a downward trajectory. However, there is a high probability of testing the lower boundary of the wedge ($0.1900 USDT).
If the price holds above $0.1900 USDT, this could signal a corrective rally toward the $0.2750 USDT level.
Medium Term (1-2 Weeks):
If the price successfully tests the lower boundary of the wedge and rebounds upward, this could lead to a reversal of the pattern and the start of an uptrend.
The target levels after a wedge breakout would be $0.3863 USDT (previous local high).
In case of an unsuccessful test of support ($0.1889 USDT), the price may continue to decline toward deeper support levels (e.g., $0.1500 USDT).
Long Term (1 Month+):
If there is a successful reversal of the falling wedge pattern, this could mark the beginning of a sustained recovery. Target levels could extend beyond $0.3863 USDT, such as $0.5000 USDT or higher.
However, if the downtrend continues without reversal, long-term targets could be significantly below current levels.
Trading Recommendations:
Long (Buy):
Entry: After a successful test of the lower boundary of the wedge ($0.1900 USDT) and a subsequent bounce upward.
Take-Profit: $0.2750 USDT → $0.3863 USDT → $0.5000 USDT.
Stop-Loss: Below $0.1889 USDT (to protect against further declines).
Short (Sell):
Entry: If the price fails to break above the upper boundary of the wedge ($0.2750 USDT) and begins to decline.
Take-Profit: $0.1900 USDT → $0.1500 USDT.
Stop-Loss: Above $0.2750 USDT (to protect against a bullish reversal).
Conclusion:
At the moment, the asset MANA is in a downtrend, forming a falling wedge. This creates potential for both a corrective rally and a continuation of the decline. The key event will be the test of the lower boundary of the wedge ($0.1900 USDT). A successful test could lead to a reversal of the pattern and the start of an uptrend, while an unsuccessful test could strengthen the downtrend.
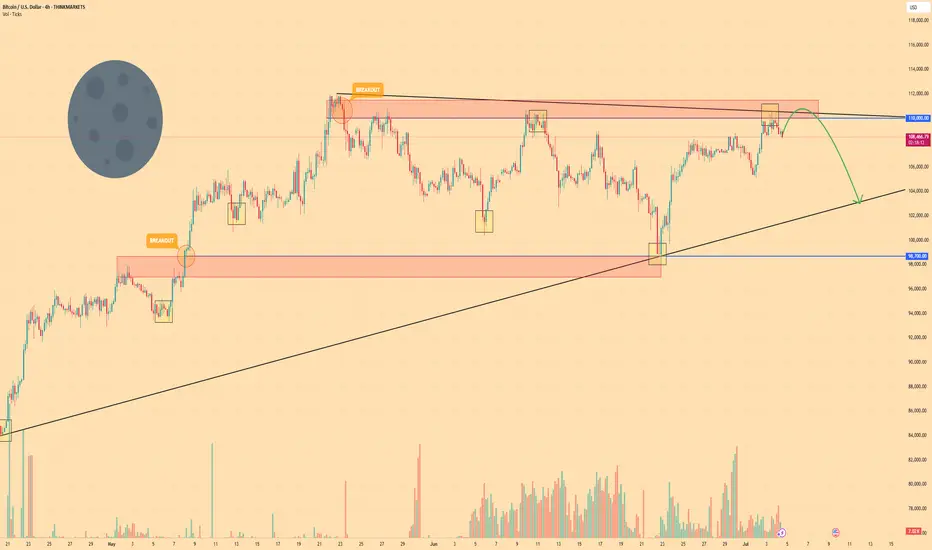
BITCOIN - Price can drop from resistance area to $103000Hi guys, this is my overview for BTCUSD, feel free to check it and write your feedback in comments👊
Some days ago, price entered a pennant pattern, where it at once made an upward impulse from support line.
Then the price reached $98700 level and soon broke it, after a small correction, and then continued to move up.
Later BTC rose to the resistance line of the pennant, but soon turned around and started to decline, breaking $110000 level.
Price little corrected and then tried to bounce back and failed, after which it fell to $98700 level and then started to grow.
In a short time, BTC rose to a $110000 resistance level and tried to break it again, but recently turned around and started to fall.
Now, I expect that BTC can grow to the resistance area and then drop to $103000 support line of the pennant.
If this post is useful to you, you can support me with like/boost and advice in comments❤️
Disclaimer: As part of ThinkMarkets’ Influencer Program, I am sponsored to share and publish their charts in my analysis.
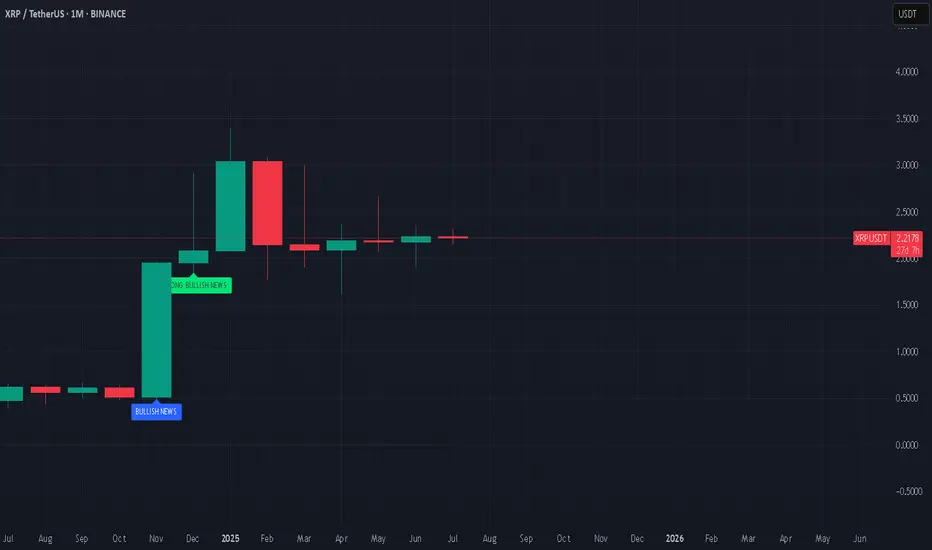
Will Ripple "leave a dent in the universe"?They called us crazy, when we bought xrp at the bottom, in the midst of court cases. What they don't see is that, many TODAY major companies that changed the world (e.g. Apple, Amazon, MSFT etc.) had long term court cases with the SEC before "leaving a dent in the universe". In our opinion, Ripple is next in line.
#xrp #crypto #bitcoin #ripple #banking #blockchain #finance #money #stablecoin #financialsystem
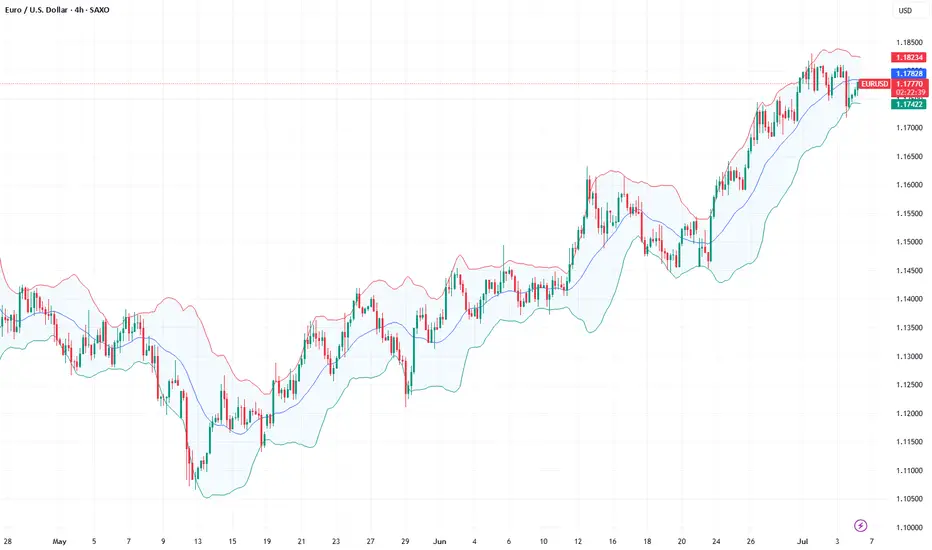
HelenP. I Euro may soon reverse and test support near $1.1655Hi folks today I'm prepared for you Euro analytics. If we look at the chart, EURUSD has been climbing steadily within an uptrend, bouncing multiple times from the trend line and making higher highs. However, despite the recent bullish structure, the pair is now showing signs of slowing momentum. The price is approaching a possible turning point near the top, and the latest candles show hesitation. Now the pair is trading near 1.1790 and still staying above the trend line, but I believe it may rise a bit more and then break down below the trend line. Once this structure is broken, I expect sellers to take control and push EURUSD toward the nearest support zone between 1.1655 and 1.1630 points. This zone acted as a key level in the past and may serve as the next area of interest for buyers. Given the extended movement and potential loss of bullish pressure, I remain bearish and expect EURUSD to move down to retest support. The level of 1.1655 is my current goal. If you like my analytics you may support me with your like/comment ❤️
Disclaimer: As part of ThinkMarkets’ Influencer Program, I am sponsored to share and publish their charts in my analysis.

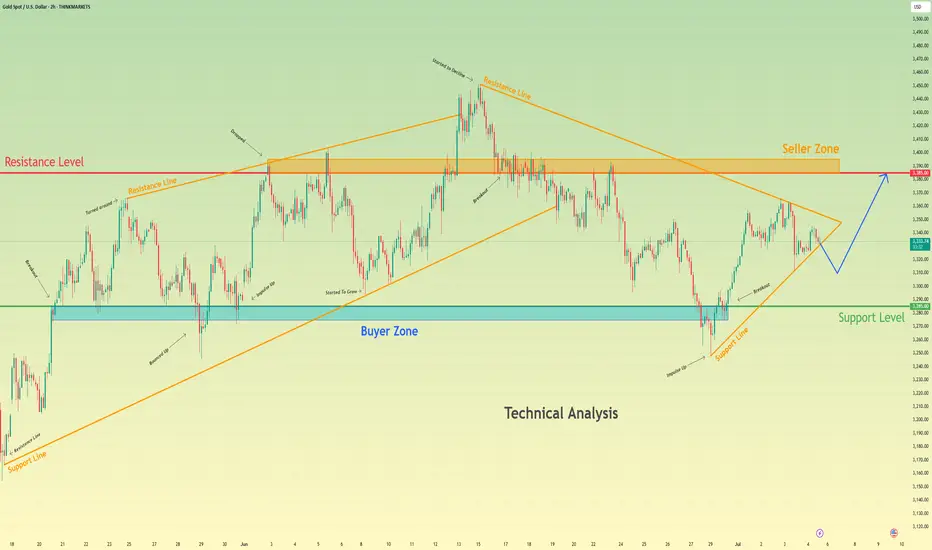
Gold will exit from pennant and then rise to resistance levelHello traders, I want share with you my opinion about Gold. Recently, the price formed a pennant pattern after a sharp bullish impulse from the buyer zone (3275–3285 points). That upward movement started after the price bounced off the strong support level (3285) and broke out from the wedge structure formed earlier. This bullish momentum indicated strong demand near the lower boundary, reinforcing the current market structure. Now, the price is consolidating inside the pennant formation, slowly approaching its apex. At the same time, we are still above the support trendline and close to the upper border of the pattern. This suggests a possible breakout to the upside. I expect that gold will soon exit the pennant and start rising again toward the resistance level at 3385, which also matches the seller zone (3385–3395 points). This area previously acted as a major reversal zone, so if price reaches it, I will consider locking profits at that point. Given the breakout structure, recent bounce from the buyer zone, and current bullish consolidation, I remain bullish and expect GOLD to continue growing toward TP 1 at 3385. Please share this idea with your friends and click Boost 🚀
Disclaimer: As part of ThinkMarkets’ Influencer Program, I am sponsored to share and publish their charts in my analysis.
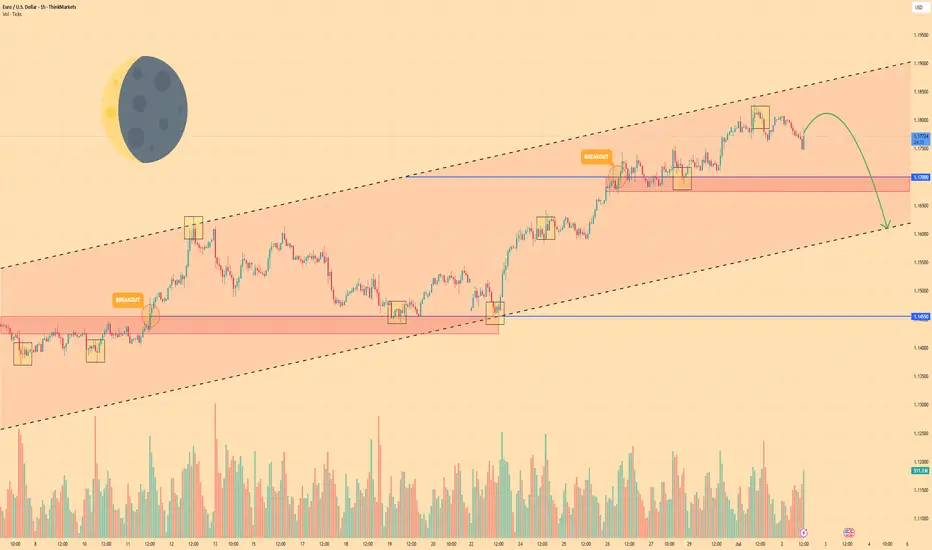
EURO - After movement up, price will drop to support lineHi guys, this is my overview for EURUSD, feel free to check it and write your feedback in comments👊
Recently price started to grow inside a rising channel, where it some time traded below the support area and soon bounced up.
Price broke $1.1455 level and rose to the resistance line of the channel, after which it turned around and made correction movement.
Next, price some time traded near $1.1455 level and then bounced and continued to move up inside the channel.
In a short time Euro rose to $1.1700 level, which coincided with a support area, and some time trades between this level.
Then the price broke this level and continued to move up, until it almost reached the resistance line of the channel and started to fall.
Now, I think the Euro can rise a little and then continue to fall to $1.1610 support line of the channel, breaking $1.1700 level.
If this post is useful to you, you can support me with like/boost and advice in comments❤️
Disclaimer: As part of ThinkMarkets’ Influencer Program, I am sponsored to share and publish their charts in my analysis.
Fundamental Market Analysis for July 4, 2025 EURUSDEvents to pay attention to today:
12:00 EET. EUR - Producer Price Index
EURUSD:
On Friday, during the Asian session, the EUR/USD pair is trading in a narrow range around 1.1760. The main currency pair is showing sluggish dynamics amid the US holiday (Independence Day).
The US dollar (USD) is maintaining its recovery, triggered by better-than-expected non-farm payrolls (NFP) data for June. Data released on Thursday showed that the US economy added 147,000 new jobs, exceeding expectations of 110,000.
The better-than-expected NFP data brought some relief to the US dollar, but this is unlikely to continue as the report shows that private sector hiring is losing momentum. Private employers added 74,000 jobs in June, well below the three-month average of 115,000. This scenario is unlikely to ease the position of several Federal Reserve (Fed) officials, including Vice Chair for Supervision Michelle Bowman, who advocated for lower interest rates at a policy meeting later this month, citing potential risks in the labour market.
In the eurozone, the sharp appreciation of the euro (EUR) has raised concerns that inflation could fall below the European Central Bank's (ECB) 2% target. According to a senior ECB official, ‘the ECB may have to make it clear that too strong a euro could be a problem, as it could cause inflation to hover below target,’ reports the Financial Times (FT).
Trading recommendation: SELL 1.17700, SL 1.18000, TP 1.16900
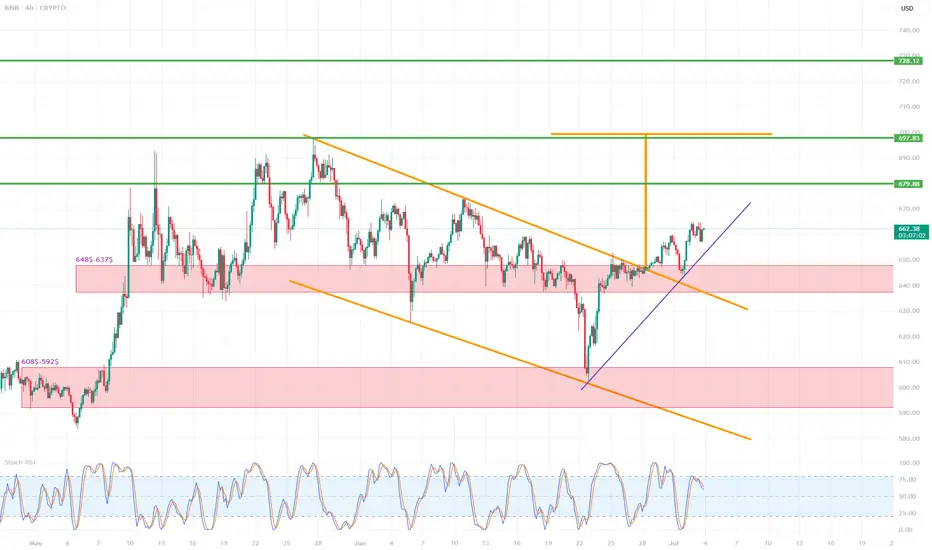
BNB/USD (4h interval)🔍 1. Chart structure
Instrument: Binance Coin / USD (BNB/USD)
Interval: 4 hours
📐 2. Technical formations
🔸 Breakout from the descending wedge formation
The descending wedge (orange lines) is a bullish formation - it suggests a potential breakout upwards.
The breakout occurred dynamically, with a large breakout candle (confirmation of the formation).
The goal of breaking out of the wedge is usually the height of the entire formation - this is marked with an orange arrow.
📈 Breakout range (target): around $697–710
🟢 Potential next targets:
697.83 (local resistance/projection result)
710.73 (main wedge height projection)
728.12 (strong resistance from history)
📊 3. Supports and resistances
🟥 Support zones (red rectangles):
$648.5–637.5 – previous resistance, now tested as support after the breakout.
$608.5–592.5 – strong support from previous lows.
🔼 Currently, the price has tested the upper support zone (648–637), reacted positively and continues to move up.
🟩 Resistance levels (green horizontal lines):
679.88 USD – local resistance, first target after breaking out of the wedge.
697.83 USD – projected range from the formation.
710.73 USD – full technical range of the breakout.
728.12 USD – strong resistance from history, may be a long-term target.
📉 4. Trends and support lines
Purple upward trend line – currently the price is above, which confirms the short-term upward trend.
Its break may lead to a retest of 648–637 USD.
Only below this zone can a larger correction be considered.
📈 5. Stochastic RSI indicator
Currently in the overbought zone (above 80).
Possible temporary cooling – signal for local correction / consolidation.
It is worth waiting for the indicator to go down to around 20 to re-enter the long.
✅ 6. Scenarios
🔼 Bullish (base) scenario:
Staying above 648–637 USD.
Maintaining the uptrend line.
Continuation to 679.88 → 697.83 → 710.73.
🔽 Bearish scenario:
Breaking the purple trend line.
Returning below 648 USD → going down to the 608–592 zone.
Negation of the breakout from the wedge.
📌 Final conclusions
Breaking out from the descending wedge is a strong pro-growth signal.
The price behaves in accordance with technical analysis, testing the previous resistance as support.
Currently, the retest and consolidation phase is underway – maintaining the trend line and the level of $648 will be key.
The medium-term target is $697–710.
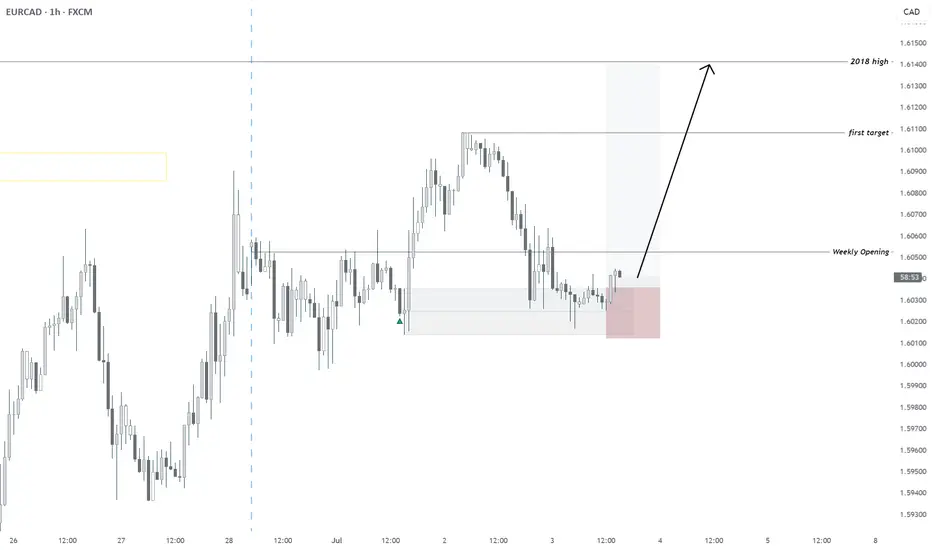
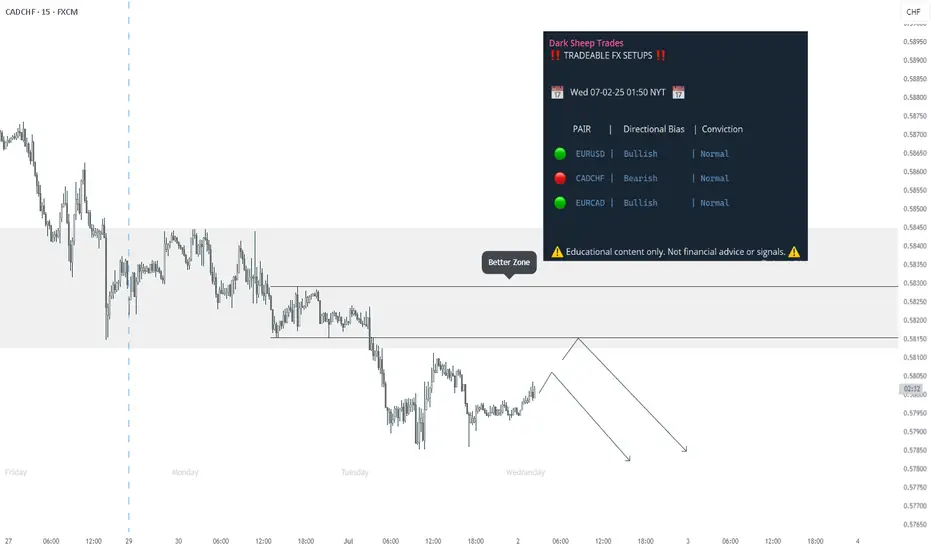
07/02/2025 | EURCAD | BULLISH - REACHING MULTI-YEAR HIGHDaily FX Outlook today:
All timeframes Bullish
Invalidation: 1.60055
First TP: on chart
Second: 2018 High
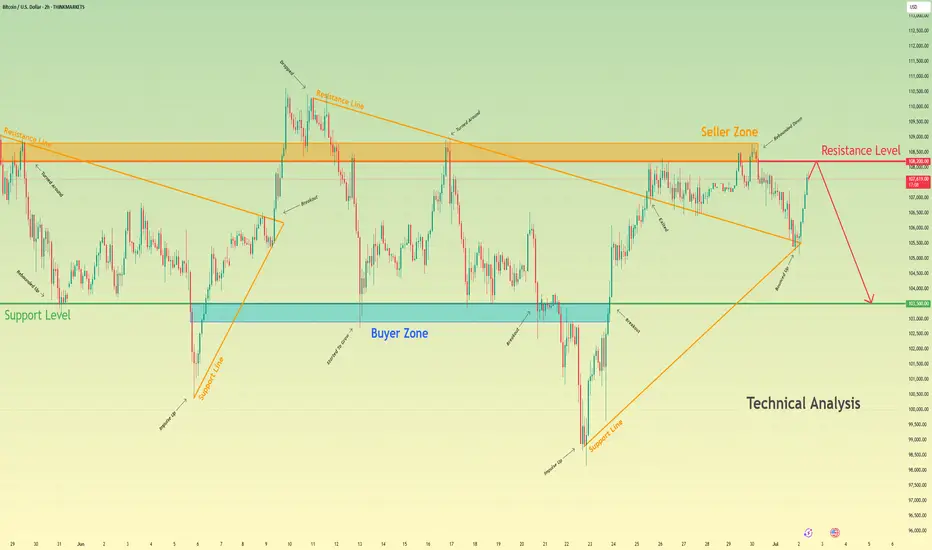
Bitcoin will drop from resistance level and fall to 103500 levelHello traders, I want share with you my opinion about Bitcoin. Some days ago, price entered the pennant, where it turned around from the seller zone, which coincided with the resistance level, and dropped to the 103500 support level. Then it bounced and tried to grow, but soon failed and dropped below the 103500 support level, which coincided with the buyer zone and reached the support line of the pennant. Following this movement, BTC experienced an upward impulse, breaking the 103,500 support level and subsequently exiting the pennant pattern, before rising to the resistance level. Price broke this level and then started to decline inside another pennant pattern. In this pattern, the price dropped top 103500 support level again and then tried to bounce back, but failed and continued to decline. In a short time, it fell to the support level, broke it, and then fell to the support line of the pennant. Next, BTC turned around and repeated an impulse up to the resistance line of the pennant and exited from this pattern. Then it rose to the seller zone, where it rebounded from it and fell, but recently it rebounded and started to grow. Now, I expect that price will reach the resistance level and then drop to the 103500 support level. For this case, this level is my TP. Please share this idea with your friends and click Boost 🚀
Disclaimer: As part of ThinkMarkets’ Influencer Program, I am sponsored to share and publish their charts in my analysis.
Gold Ready to Explode Ahead of NFP and Trump’s “Super Bill”?Gold Ready to Explode Ahead of NFP and Trump’s “Super Bill”? | Global Macro Focus
🌍 MACRO UPDATE – What the World is Watching:
Gold continues its bullish trajectory as the USD weakens sharply following last night’s disappointing ADP jobs report (-33K vs expected +99K). This soft labour data has fueled further speculation that the Fed could begin rate cuts as early as September, with a 90% probability now being priced in.
In the political arena, Donald Trump’s recent statement that House Republicans are aligned to push forward a so-called “Super Bill” has triggered fresh uncertainty around US fiscal policy. This could elevate safe-haven demand for gold, especially if it leads to increased tensions over debt ceilings or government spending.
With the US Non-Farm Payrolls (NFP) due later today and the UK and US markets heading into a long weekend, traders should brace for heightened volatility and liquidity gaps.
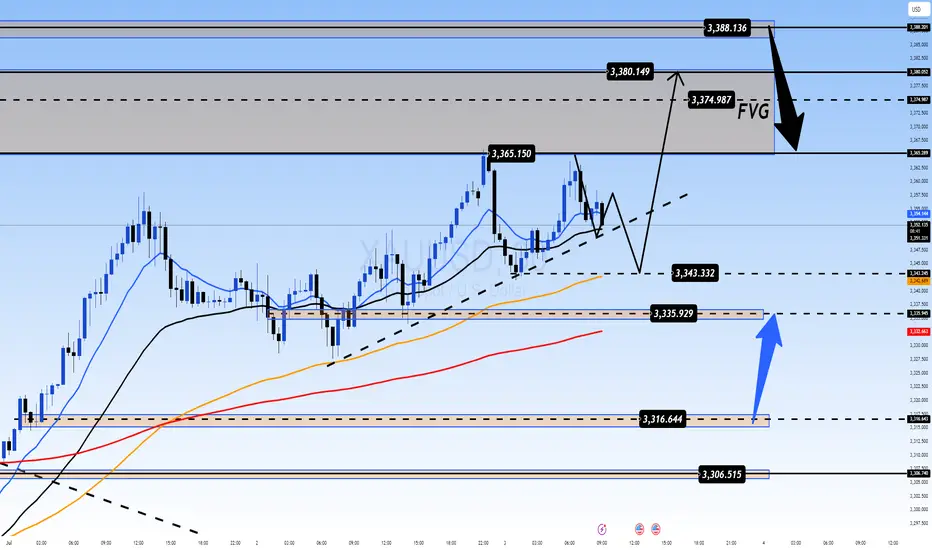
📈 TECHNICAL OUTLOOK – What the Charts Are Saying:
Overall Trend: Bullish structure remains intact as gold breaks and holds above 3365.
EMA Setup: Price trades above EMA 13/34/89/200 – signaling strong upside momentum.
Fair Value Gap (FVG): 3374 – 3388 area remains an unfilled FVG zone; possible magnet for short-term price action.
Key Resistance Levels: 3365, 3374, 3380, 3388, 3393
Key Support Levels: 3343, 3335, 3325, 3316, 3304
Trendline & Structure: The ascending trendline from 3316 remains unbroken, providing a potential bounce point if price corrects.
🎯 TRADE SETUPS – Strategic Zones to Watch:
🔵 Buy (Short-Term Scalp):
Entry: 3335 – 3333
SL: 3329
TP: 3340 → 3350 → 3360 → 3370
🟢 Buy Zone (Swing Perspective):
Entry: 3316 – 3314
SL: 3310
TP: 3320 → 3336 → 3350 → 3360
🔴 Sell Scalp (Reversal Zone)
Entry: 3374 – 3376
SL: 3380
TP: 3370 → 3360 → 3350
⚠️ Sell Zone (High-Risk Rejection):
Entry: 3388 – 3390
SL: 3394
TP: 3380 → 3370 → 3360
🔎 NOTE FOR GLOBAL TRADERS:
With UK markets partially closed and US session shortened ahead of the Independence Day holiday, liquidity may be thin and volatility could spike unexpectedly. Always place stop-loss and avoid emotional entries near key resistance.
💬 Do you believe gold can break and close above the FVG zone (3388) before the weekend volatility hits full throttle? Let’s discuss.
Nearing the Top: A Final Push or Smart Money Liquidity Trap?EUR/USD – Nearing the Top: A Final Push or Smart Money Liquidity Trap?
🌍 MACRO OUTLOOK – EURO CLIMBS WHILE USD TREADS ON UNCERTAIN POLITICAL GROUND:
EUR/USD is trading just below the 1.1700 mark as investors remain cautious about the US dollar's long-term credibility. Growing concerns over the Federal Reserve’s independence — should the “Trump 2.0” scenario unfold — have weighed heavily on USD sentiment across global markets.
Meanwhile, the Euro is gaining support thanks to a relatively hawkish tone from the European Central Bank (ECB). Policymakers appear reluctant to ease policy prematurely, which supports the Euro through expectations of prolonged higher interest rates.
However, with no major catalyst in play yet, traders are watching closely for mid-tier US data and any upcoming statements from ECB officials that might set the tone for the next directional breakout.
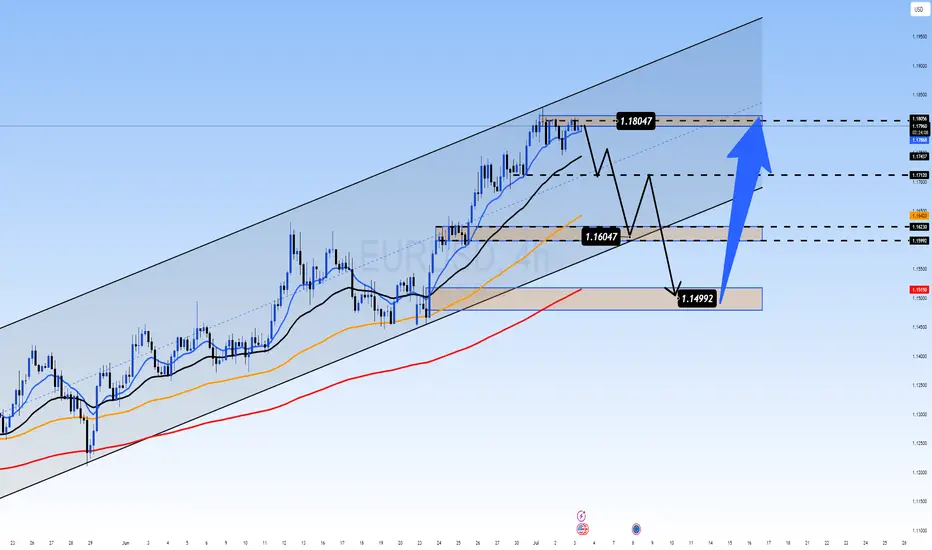
📊 TECHNICAL ANALYSIS – H4 TIMEFRAME:
Market Structure: EUR/USD remains in a well-defined ascending price channel. However, the pair is now testing the upper band near the 1.1804 resistance, a key liquidity zone where sellers previously stepped in.
EMA Alignment: Price is trading above the EMA 13/34/89/200 cluster — a strong sign of sustained bullish momentum.
Momentum Indicators:
RSI is hovering near 70 — potential overbought territory.
ADX remains above 25 — confirming trend strength but signaling caution at extended highs.
FVG (Fair Value Gap): A visible unfilled gap between 1.1600 and 1.1640 could act as a magnetic zone for price to revisit before the next impulse move.
🔹 Key Resistance: 1.1804 – 1.1835
🔹 Key Support: 1.1640 – 1.1600 (gap zone)
🔹 Major Demand Zone: 1.1499 – 1.1515
🎯 TRADE PLAN:
Scenario 1 – Buy the Dip (Primary Bias):
Entry: 1.1600 – 1.1640
Stop Loss: 1.1550
Targets: 1.1750 → 1.1800 → 1.1850
Scenario 2 – Buy Deep Pullback:
Entry: 1.1499 – 1.1515
Stop Loss: 1.1450
Targets: 1.1640 → 1.1700
Scenario 3 – Countertrend Sell at Key Resistance (High Risk):
Entry: 1.1804 – 1.1830
Stop Loss: 1.1860
Targets: 1.1720 → 1.1650
📌 Strategic Insight:
EUR/USD may be setting up for either a breakout continuation above 1.1800 or a temporary reversal to sweep liquidity from the lower zones. Momentum favors bulls, but chasing highs without confirmation is risky. Focus on clean retracements and volume-supported entries.
💬 If EUR/USD drops back into the 1.1600 zone, will you load up for another leg higher — or wait for confirmation of trend strength? Share your view in the comments!
Exact Entry Levels & Profit Potential (July 3, 2025)🎯 Market Structure Breakdown – Exact Entry Levels & Profit Potential (July 3, 2025)
📊 In today’s session, I revisit the market for the second time – and you’ll see why I’m ruling out some setups altogether. There’s value in looking twice. What did I miss earlier? It's all in the structure.
I break down price action step by step, highlight precise entry zones, and show where the real potential for movement lies. Clean levels, no guessing.
⚠️ Note: I don’t trade the first 10 seconds – all orders are placed after 9:30:10 and I'm looking for entries only until 11:30:00.
👉 Check out the full breakdown and stay ahead of the game.
NASDAQ:AMZN
NYSE:ANET
NASDAQ:AVGO
NYSE:BA
NASDAQ:COIN
NASDAQ:CZR
NYSE:DELL
NASDAQ:GOOG
NASDAQ:MSFT
NASDAQ:AMD
NASDAQ:RKLB
NASDAQ:SBUX
NASDAQ:SMCI
NYSE:VRT
NASDAQ:NVDA

Fundamental Market Analysis for July 3, 2025 USDJPYEvent to pay attention to today:
15:30 EET. USD - Non-Farm Employment Change
15:30 EET. USD - Unemployment Rate
15:30 EET. USD - Unemployment Claims
17:00 EET. USD - ISM Services PMI
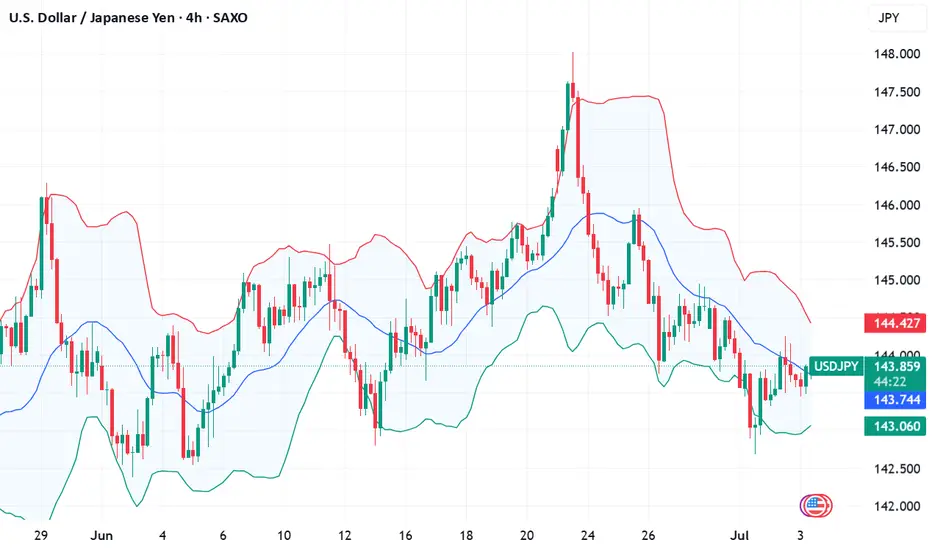
The Japanese Yen (JPY) traded with a slight positive bias against the bearish US Dollar (USD) during the Asian session on Thursday and remains near the near one-month peak reached earlier this week. Despite the Bank of Japan's (BoJ) hesitation to hike rates, investors seem convinced that the central bank will remain on the path of normalizing monetary policy amid rising inflation in Japan. This is a significant divergence from the stance of other major central banks (including the U.S. Federal Reserve (Fed)), which are leaning towards a softer approach, and is favorable for lower JPY yields.
Meanwhile, US President Donald Trump hinted at a possible end to trade talks with Japan, and also threatened new tariffs against Japan over its perceived reluctance to buy American-grown rice. This, along with the overall positive tone towards risk, is a headwind for the safe-haven yen. In addition, traders seem reluctant and prefer to take a wait-and-see approach ahead of today's release of the closely watched US Non-Farm Payrolls (NFP) report. The crucial data will play a key role in influencing the US Dollar (USD) and will give a significant boost to the USD/JPY pair.
Trade recommendation: BUY 144.00, SL 143.00, TP 145.40
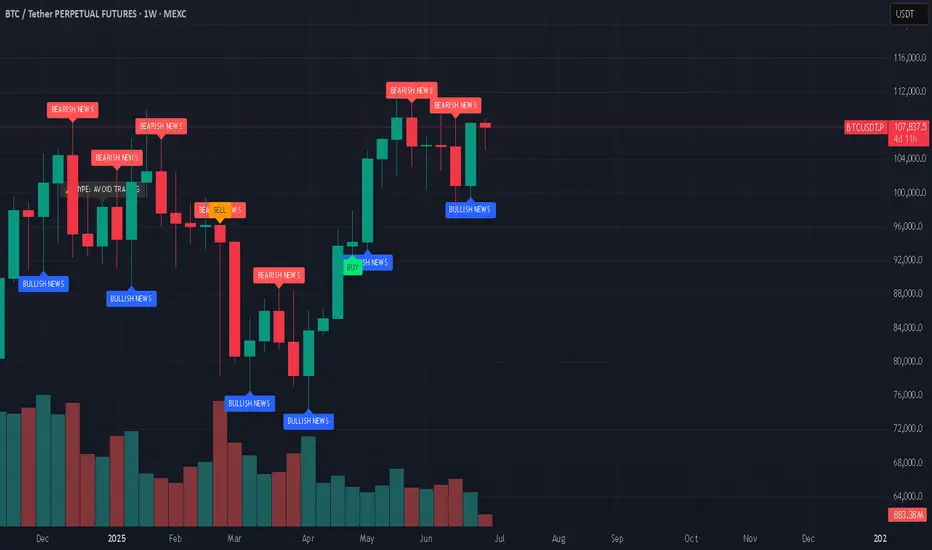
Bitcoin Set to Break All-Time High: Market Consensus Is BullishAs we enter the second half of 2025, Bitcoin (BTC) is on the verge of breaking its all-time high (ATH), with analysts, institutional investors, and market data all pointing toward an imminent surge. The convergence of technical strength, robust institutional inflows, and favorable macro trends is fueling widespread optimism that BTC will soon surpass its previous records.
Key Drivers Behind Bitcoin’s Imminent ATH Breakout
Institutional Investment & ETF Approvals:
The surge in institutional interest, highlighted by record inflows into Bitcoin ETFs and major asset managers ramping up exposure, is a pivotal force behind BTC’s upward momentum. Recent ETF approvals and growing allocations by corporate treasuries are reshaping the liquidity landscape and boosting confidence in Bitcoin as a mainstream asset.
Technical Indicators & Market Structure:
Bitcoin’s price action is consolidating near critical resistance levels ($107,000–$109,000), with technical analysts identifying bullish formations such as the inverted head-and-shoulders pattern. A decisive move above $109,000 is expected to trigger a rapid ascent to new highs, with targets ranging from $112,000 in the short term to as high as $135,000–$200,000 by year-end, according to leading forecasters.
Historical Cycles & Macro Trends:
Unlike previous halving cycles, where corrections followed price spikes, this cycle is marked by sustained demand from ETFs and corporate buyers. Standard Chartered and other major institutions now project BTC to reach $135,000 in Q3 and potentially $200,000 by late 2025, citing a fundamental shift in market dynamics
BUT...A drop to 90k is considered possible before the rally.
#crypto #bitcoin #portfolio #analysis
HelenP. I Gold will make small correction and then continue growHi folks today I'm prepared for you Euro analytics. In this chart, we can see how the price declined to the 3245 support level, which coincided with the support zone, and then started to grow. In a short time, it reached the 3395 resistance level, which coincided with the resistance zone, and then dropped to the trend line, breaking two levels, and made a gap. After this movement, the price started to grow in a wedge and soon reached the support level, which broke it and continued to rise next. Later, it made a correction to the 3245 level and then continued to move up and reached the resistance level. Price bounced from this level and corrected, after which it turned around and rose to the resistance line of the wedge pattern, breaking the 3395 resistance level. But soon, it turned around and corrected to the trend line. Not a long time ago, price exited from the wedge, fell to the support level, and then started to grow. For this case, I expect that XAUUSD will make a small correction. Then I think it can continue to grow and reach the 3395 resistance level, which is my current goal. If you like my analytics you may support me with your like/comment.❤️
Disclaimer: As part of ThinkMarkets’ Influencer Program, I am sponsored to share and publish their charts in my analysis.
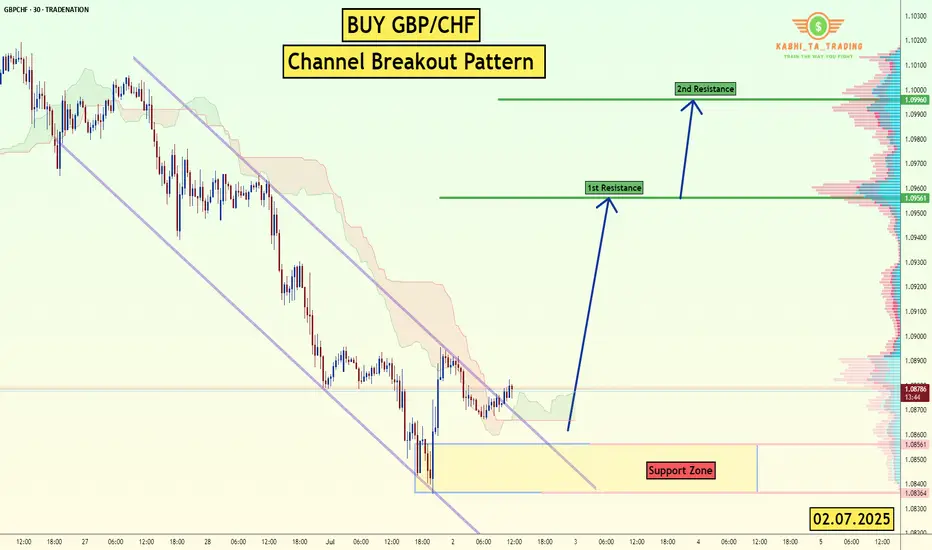
GBP/CHF - Channel Breakout (02.07.2025)The GBP/CHF pair on the M30 timeframe presents a Potential Buying Opportunity due to a recent Formation of a Breakout Pattern. This suggests a shift in momentum towards the upside and a higher likelihood of further advances in the coming hours.
Possible Long Trade:
Entry: Consider Entering A Long Position around Trendline Of The Pattern.
Target Levels:
1st Resistance – 1.0956
2nd Resistance – 1.0996
🎁 Please hit the like button and
🎁 Leave a comment to support for My Post !
Your likes and comments are incredibly motivating and will encourage me to share more analysis with you.
Best Regards, KABHI_TA_TRADING
Thank you.
Disclosure: I am part of Trade Nation's Influencer program and receive a monthly fee for using their TradingView charts in my analysis.
CADCHF - BEARISH - QUANT-LEVEL FX LISTDaily: Downtrend
H4: Downtrend
H1: Downtrend
m15: Downtrend
Risk of Entering Now: Better Zone a little higher
Target at least previous day low
tg@darksheeptrades
CAD/JPYSince my ascending triangle formation has violated its characteristics it is no longer valid. I took this opportunity to revisit this pair and start again. I still believe price is operating from the Double Bottom Formation so I'm still looking for price to go up. Here we have 4 touches on our Trendline & A Expanding Flat Formation (highlighted in blue letters). I have entered a position after the 4hr close but im still looking for a retrace for a better position.

Fundamental Market Analysis for July 2, 2025 GBPUSDOn Wednesday, during the Asian trading session, the GBP/USD pair is trading unchanged at around 1.37450. However, dovish statements by US Federal Reserve Chairman Jerome Powell and growing concerns about the budget may put pressure on the dollar in the near term. Investors are awaiting the ADP report on US employment for June, which will be released later on Wednesday, in the hope of new momentum.
Powell said on Tuesday that the US central bank would be patient about further interest rate cuts, but did not rule out a rate cut at its July meeting, although the decision would depend on incoming data. According to the CME FedWatch tool, short-term interest rate futures now price in the probability of a rate cut in July at almost 1 in 4, up from less than 1 in 5 previously.
Investors are concerned about US President Donald Trump's massive tax and spending bill, which could increase the national debt by $3.3 trillion. The bill will return to the House of Representatives for final approval. Fiscal concerns could dampen optimism and contribute to a decline in the US dollar.
As for the pound sterling, Bank of England (BoE) Governor Andrew Bailey said last week that there are currently signs of a weakening UK labor market and stressed that interest rates are likely to continue to fall. The UK central bank is expected to cut interest rates three times by the end of 2025, bringing them to 3.5% to combat sluggish economic growth and a weakening labor market. Rate cuts are expected in August, September, and November 2025, with possible quarterly reductions.
Trading recommendation: SELL 1.37450, SL 1.37900, TP 1.36750

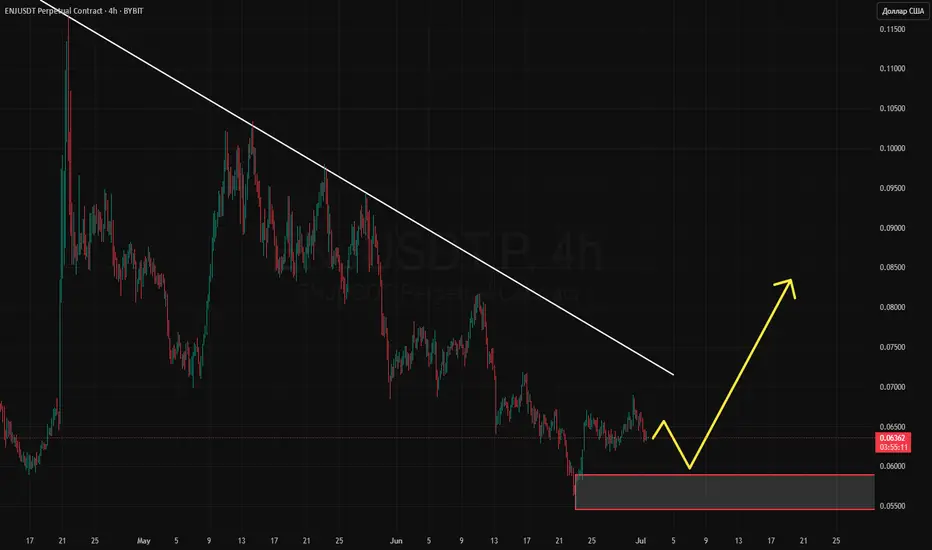
ENJ - 4H Uptrend, after expected correctionHere is a short analysis based on the chart's elements:
Trendline Breakout: The price has decisively broken out of a long-term descending white trendline, which previously acted as resistance. This is a strong bullish signal, suggesting the end of the downtrend.
Market Structure Shift: The chart shows multiple "ChoCH" (Change of Character) and "BOS" (Break of Structure) to the upside, indicating a shift from a bearish market structure (Lower Lows and Lower Highs) to a bullish one.
Predicted Path: The large yellow arrow drawn on the chart illustrates the forecast. It predicts a potential small dip or consolidation to retest the broken trendline as new support, followed by a significant upward move.
Target: The arrow points towards the upper red resistance/supply zones, suggesting a potential target price around the 0.07200 level.
EURO - Price can start to decline from resistance line of wedgeHi guys, this is my overview for EURUSD, feel free to check it and write your feedback in comments👊
Some days ago price grew to $1.1500 level and even broke it, after which started to decline in wedge.
Price declined to support line, breaking two levels, after which it turned around and started to move up.
Soon, EUR broke $1.1215 level and then rose more, after which made a correction to support line.
Then price in a short time rose to $1.1500 level, broke it one more time, and tried to grow more, but failed.
But recently it turned around and quickly rose to resistance line of wedge and now trades near.
In my mind, Euro can bounce from resistance line and fall to $1.1520 support line of wedge pattern.
If this post is useful to you, you can support me with like/boost and advice in comments❤️
Disclaimer: As part of ThinkMarkets’ Influencer Program, I am sponsored to share and publish their charts in my analysis.
