#PENGUUSDT confirms a bearish impulse📉 SHORT BYBIT:PENGUUSDT.P from $0.034625
⚡ Stop loss $0.035646
🕒 Timeframe: 4H
⚡ Overview:
➡️ A Double Top pattern BYBIT:PENGUUSDT.P has formed, signaling a bearish reversal.
➡️ The price broke the $0.0355 support and is consolidating below, confirming seller strength.
➡️ Increasing sell volume confirms bearish control.
➡️ Main focus on targets in the $0.034–0.033 zone.
➡️ The POC at $0.03113 remains the ultimate bearish objective.
🎯 TP Targets:
💎 TP 1: $0.033947
💎 TP 2: $0.033369
💎 TP 3: $0.032948
BYBIT:PENGUUSDT.P Trade Recommendations:
📢 Hold short towards the TP zones.
📢 Watch for reaction around $0.0339 — partial profit-taking possible.
📢 Invalidation if price reclaims above $0.0356.
⚠️ As long as bearish pressure holds, the price is likely to continue towards TP2–TP3.
⚠️ A recovery above $0.0356 would invalidate this setup.
🚀 The signal confirms a bearish impulse — expecting further downside!
Analysischart

HelenP. I Gold may retest resistance before dropping to $3230Hi folks today I'm prepared for you Gold analytics. If we look at the chart, we can see that after a period of sideways consolidation, gold started to form lower highs under a descending trend line. Each time the price approached this trend line, it was rejected, confirming strong bearish pressure. Most recently, XAUUSD broke below the support-turned-resistance level around 3295, entering the lower resistance zone. Now, the price is trading just under this area, which has acted as a strong supply zone in the past. Given the current technical setup, I expect that gold may show a minor upward move to retest the resistance zone between 3285 - 3295. However, this retest is likely to act as a trigger for sellers to step back in. The prevailing downtrend and repeated failures to break the trend line suggest further weakness ahead. That’s why I’ve placed my target at 3230 points - a level that aligns with the next major support on the chart. This area could provide the next bounce opportunity, but for now, the bearish structure remains dominant. If you like my analytics you may support me with your like/comment ❤️
Disclaimer: As part of ThinkMarkets’ Influencer Program, I am sponsored to share and publish their charts in my analysis.

A temporary drop in gold is logical for an upward moveGold is in an upward trend in higher timeframes, and to form this trend, we need to reach a position where buyers step in. At this moment, a slight pullback in the 15-minute timeframe seems logical, as we are in a small descending channel. OANDA:XAUUSD

Waiting for a short-term BTC buy — easy setup, clean trade.No need for words — just follow the arrow and check the risk/reward.
I'm starting a signal room soon, but for now, it's all free. Watch and decide for yourself.

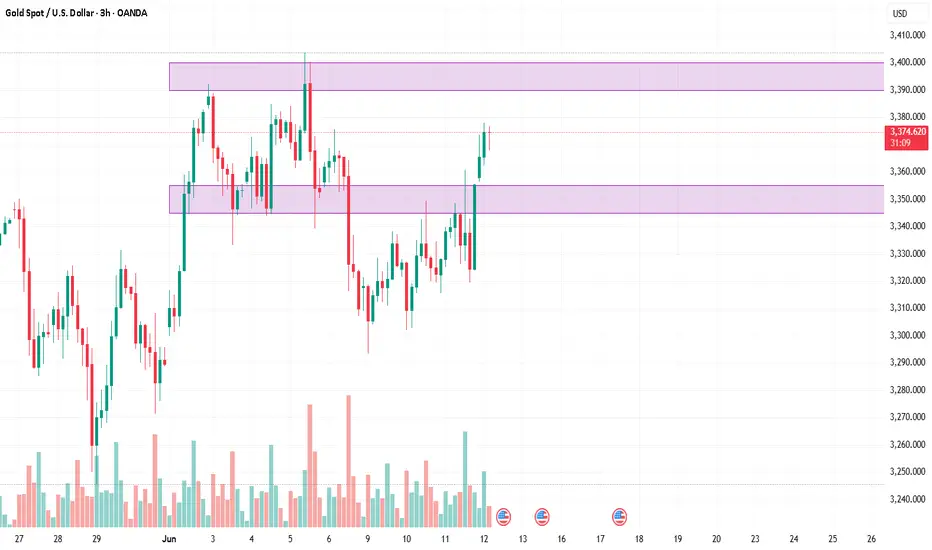
Gold (XAU/USD) Intraday Outlook – 12 June 2025Current Price: ~$3,373 (intraday) –
Gold is holding near recent highs after a sharp rally. Bullish momentum has improved markedly, fueled in part by favorable fundamentals (soft US CPI and geopolitical tensions lifting safe-haven demand)
On the charts, the short-term trend is upward, with buyers firmly in control following a breakout above prior resistance.
4H Trend & Key Levels
4H chart highlighting break of structure, demand (green) and supply (red) zones, and key intraday levels. Note the major demand zone that held around 3,214 (green) and the supply zone near 3,284 (red) which was a focal resistance. The 50% retracement of the prior day’s range (blue line near 3,274) acted as intraday resistance in that earlier session
Such annotations show where institutional activity likely set support (demand) and resistance (supply) areas. On the 4-hour chart, gold’s momentum is strongly bullish. The recent surge to 3375 pushed price above its 10-day moving average and widened the upper Bollinger Bands on both H1 and H4 – signs of a powerful uptrend. This came after gold cleared a major resistance around the $3,350 zone, which had capped prices earlier. With that barrier broken, the next upside target on the higher time frame is the $3,400 level (a notable psychological and technical hurdle)
In fact, it can be projected that a clean breakout above the ~3,380/3,390 zone could open the path toward $3,403 and even $3,430 in extension
Reflecting the next supply areas or Fibonacci extension targets above. Support levels on the 4H are stepping up as the trend rises. Previously, $3,320 (the last day’s high in late May) turned from resistance into support after the breakout. Now, immediate support is seen around $3,345–3,350, which corresponds to the top of the recent consolidation and roughly the 38.2% Fibonacci retracement of this week’s rally
Below that, the $3,330–3,335 zone (around the 61.8% retracement of the rally) is a secondary intraday support area
These levels also align with prior demand zones and the previous day’s lows, making them likely zones where buyers might step in on dips. Overall, as long as gold holds above the mid-$3,300s, the 4H bias remains bullish. The 4H structure shows higher highs and higher lows, and technical signals (price above short-term EMAs and an improving RSI) reinforce the short-term bullish outlook
Educational Note: In an uptrend, old resistance often becomes new support. Here $3,350 was a major resistance in the past and could serve as support if prices pull back. Traders also watch Fibonacci retracement levels within the up-move for potential bounce points – for gold, the 35-50% retracement zone of the latest swing (approximately $3,350 down to $3,330) is viewed as an attractive “buy-the-dip” area intraday.
On the 1-hour chart, gold has been oscillating upward within a rising channel. After each push higher, it has formed brief consolidations or bull flags that resolved to the upside.
For example, after the strong push to ~3375, price coiled in a classic bull flag pattern, hinting at momentum building for another breakout. This pattern of consolidation after a rally shows healthy bullish behavior – buyers pausing before continuing the move. Higher lows (HL) and higher highs (HH) are clearly present, indicating a steady uptrend structure on the 1H
In fact, gold’s price action has been “taking out liquidity then taking out highs and creating new highs,” leaving no sign of bear control so far. This means each time the price dips and grabs some stop-loss liquidity from weak longs, it quickly reverses and surges to a fresh peak – a hallmark of a strong trend supported by larger players. From an SMC perspective, we can spot where institutional traders may be active. Recently, gold retested a major demand zone in the low $3,300s and rocketed higher. Specifically, price dipped to about $3,297 (just below a prior support), which appears to have been a liquidity grab (fake-out) below the obvious support level
Smart money often drives price briefly below such a level to trigger stop-losses, then buys into that liquidity. Indeed, a strong bullish rejection off $3,297-3,300 occurred, indicating aggressive buying (accumulation) by big players at that historical support
This confirmed a solid demand zone, and bulls defended it vigorously – a clear sign that institutional demand underpins that area. After the fake-out and bounce, gold quickly resumed making higher lows, confirming the uptrend’s resumption. Now, the focus shifts to the overhead supply zone. Gold is trading just below $3,380–3,390, a zone that previously acted as major intraday resistance.
In past attempts, price sharply sold off from this area, suggesting it’s a pocket of supply (sell orders) or profit-taking for institutions. This makes $3,380-$3,390 a key decision point: if bullish momentum is strong enough to drive a clean break through this supply, we could see a swift move higher (as mentioned, targets in the low $3,400s become viable)
However, if gold struggles and prints bearish signals (e.g. aggressive wick rejections or a change in character to lower lows on 15m/1H) near 3380-3390, it may indicate that sellers are defending this zone again, potentially causing a pullback. Traders are watching closely to see if smart money will cap the price here or let it run. It’s worth noting that intraday liquidity has built up around certain levels. Minor equal highs around $3,375-3,377 were taken out earlier (as gold hit a weekly high of ~$3,377) ,and now liquidity might reside just above $3,390 (at buy stops of breakout traders) and below $3,340 (sell stops of longs). The path of least resistance intraday appears upward unless those lower support levels start breaking. As long as gold remains inside this rising structure, the bias is to buy dips rather than sell rallies. Only a clear break below the $3,337–3,340 support (recent range floor) would hint at a short-term trend shift down. Until then, bulls are in charge. Educational Note: Order blocks and supply/demand zones are areas where price saw a sharp move, indicating institutional orders. In gold’s case, an H1 demand block near $3,300 (origin of the recent rally) is such an area – price dipped into it and then launched higher
Conversely, the $3,380-$3,390 area is a supply zone from which price fell previously.
Watching price behavior at these zones (e.g. strong rejection vs. breakthrough) gives clues: a heavy rejection implies continued range or reversal, while a breakthrough suggests a new leg of trend.
Trade Setups
Buy on Dip (Bullish Setup):
If gold retraces into the $3,345–3,355 support zone, consider a long entry near ~$3,350 (a key Fibonacci support & prior breakout level)
A suggested stop-loss is just below $3,335 (to stay under the 61.8% retracement and recent swing low). Target the $3,375 area for partial profits, and $3,385–3,390 if momentum continues. This buy-on-dips approach aligns with the prevailing uptrend – as one analyst noted, “Gold below 3350 is an opportunity to buy on dips”
(Rationale: You’re buying at support in an uptrend, aiming for a retest of the highs.)
Sell Near Resistance (Bearish Setup):
If gold rallies toward the $3,390–3,400 zone but shows rejection (stalling candles or a bearish reversal pattern) at that resistance, one can consider a short entry around ~$3,395. Place a tight stop-loss above $3,405 (just beyond the major resistance). Target a pullback to about $3,370 first, and $3,350 on an extended drop. This trade fades a possible near-term top in case the supply zone holds. For instance, a suggested plan from another analyst was to “sell around 3397–3400” with stops above 3409, looking for a move back to the mid-$3,300s
(Rationale: You’re selling at an identified supply zone, expecting a short-term correction.)
Breakout Scenario:
For traders who prefer momentum plays, watch $3,380 on the upside and $3,340 on the downside. A 1H candle close beyond $3,380 with strong volume would confirm a breakout – you could then target ~$3,405 and above (trail stops as it goes)
Conversely, a drop below $3,340 might signal a bearish intraday reversal, opening downside targets near $3,315 and $3,300
If trading the breakout, ensure confirmation (no fake-outs) – wait for a retest if possible, and then ride the move. (This scenario is only for when price definitively exits the current range.)
Remember: The intraday trend is bullish, so lean toward long setups unless key supports break. Keep it simple – trade the price action you see. Gold can be volatile, so it's wise to use stop losses and not over-leverage. Happy trading! 📈✨
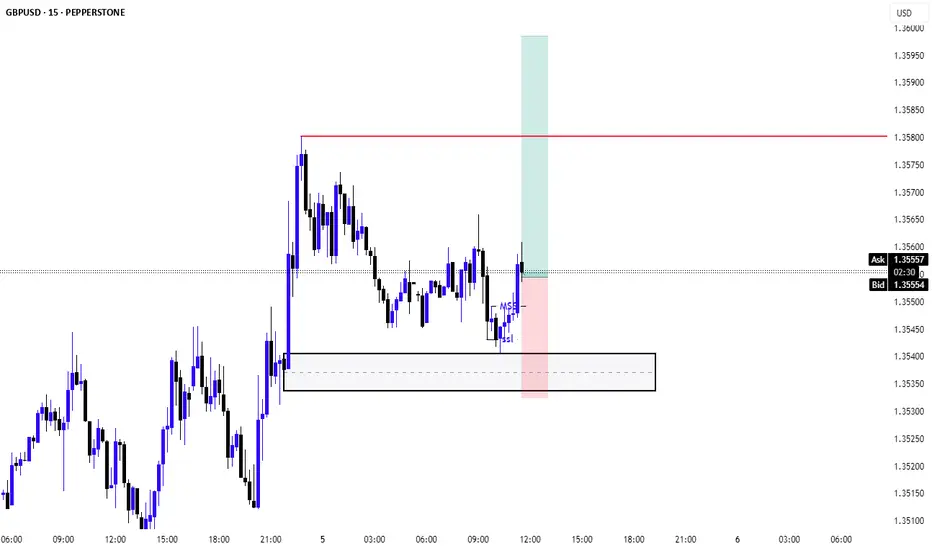
GBPUSD buy As i can see on 15m chart i'm looking for buy setup. entry base on 3 minit chart liquidity grab & market structure shift with in 15m FVG.
Senario:
1. 15m fvg
2. 3m liquidity grab
3;. 3m market structure shift
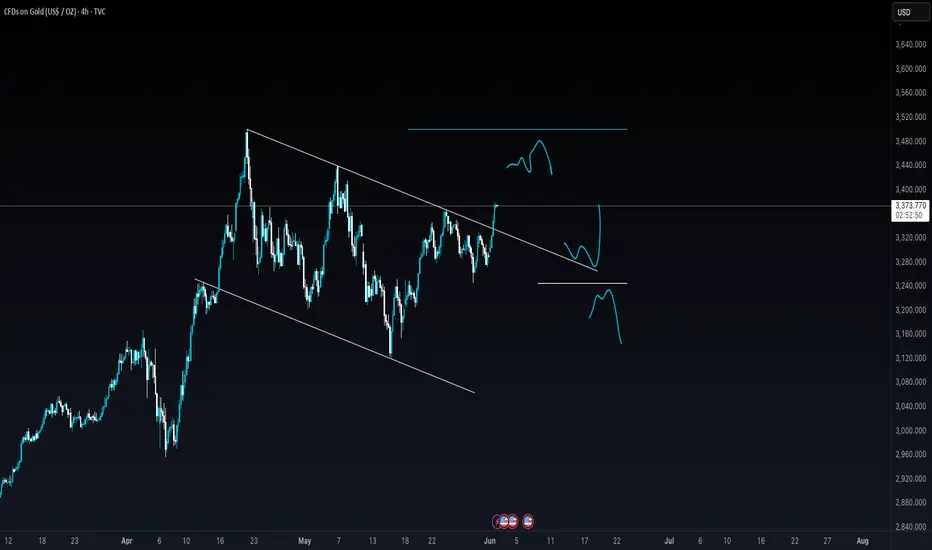
Gold breakout? My opinionGold in short time frame was in bearish trend which it broke out of, however price action is still bearish. Generally trendlines are powerful enough to change price section. Turning points are marked on the chart, I will look for trades in these areas.
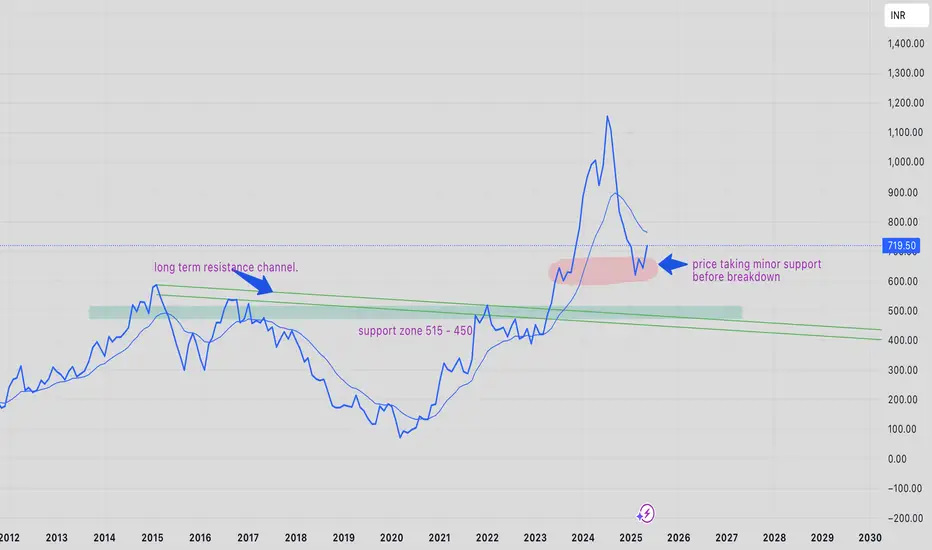
price analysis of TATAMOTORS-EQ for long term goalsTATAMOTORS-EQ price trend is in downtrend this is because price is trying to retest its previous all time high resistance zone ~550 - 425.
people of wish to add and have a long term goal it is better to add at those lvls because the current bounce might be used as selling opportunity by traders/speculators because of minor support.
as always people are advised to trade as per their risk capacity.
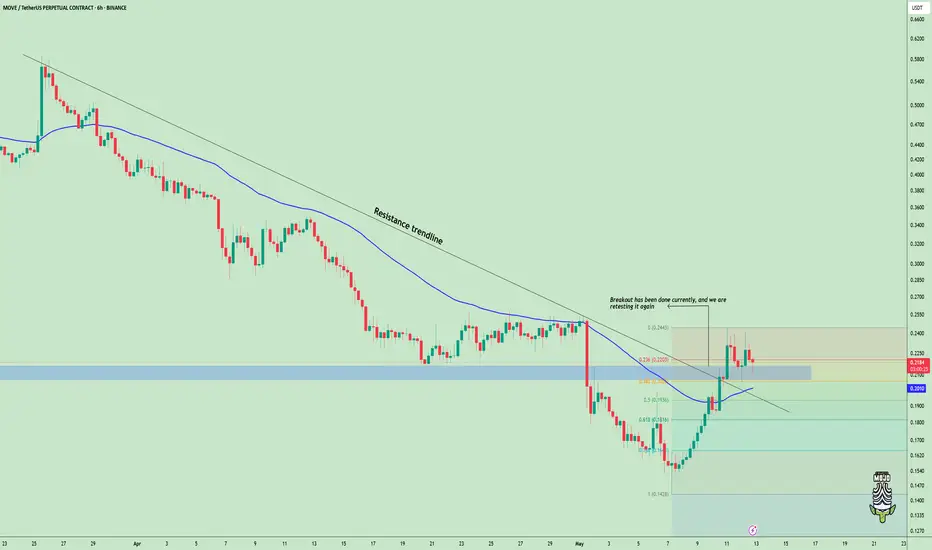
$MOVE Setup Looks Clean – Support Holding Strong!!TVC:MOVE busted out of the downtrend and is currently testing the resistance trendline as a support line✅
Price is remaining at the level of the 0.236 Fib and resting on a pivotal area the retest has the potential to prepare the ground for the next leg up to $0.24+.
DYOR, NFA
Game-changing analysis technique that will elevate your strategyAs many of my loyal followers know, my analysis toolkit goes beyond just the standard fare of CME options data and COT reports. I dive deeper, utilizing additional filters like the average long and short positions of retail traders. These insights are publicly available, and while I won’t name specific sources to avoid any hint of hidden promotion, I’ll give you a clue: look for a website with the word "book" in its title. 📚
For years, I’ve relied on this data, and it has proven to be both reliable and insightful. The average positions of market participants serve as both filters and indicators. But what do I mean by indicators?
Let’s break it down. When the price interacts with these levels, it reveals the market sentiment. For instance, if the price is below the average long position and breaks through easily, it’s a bullish sentiment. Conversely, if it hovers below the level and struggles to break through, that’s still bullish, as it indicates buyers are being drawn into profitable territory.
Now, let’s flip the script for the bears: if the price breaks down from above or struggles below the average short position, that’s a bearish sentiment. The price isn’t responding to sellers, dragging them into a profit land.
There’s more. Often, you’ll notice different behaviors near these key levels, allowing you to enter positions with an incredible risk/reward ratio of 3:1, 5:1, or even better! This clarity gives you insight into the current market mood—who’s being punished and who’s favored at that moment.
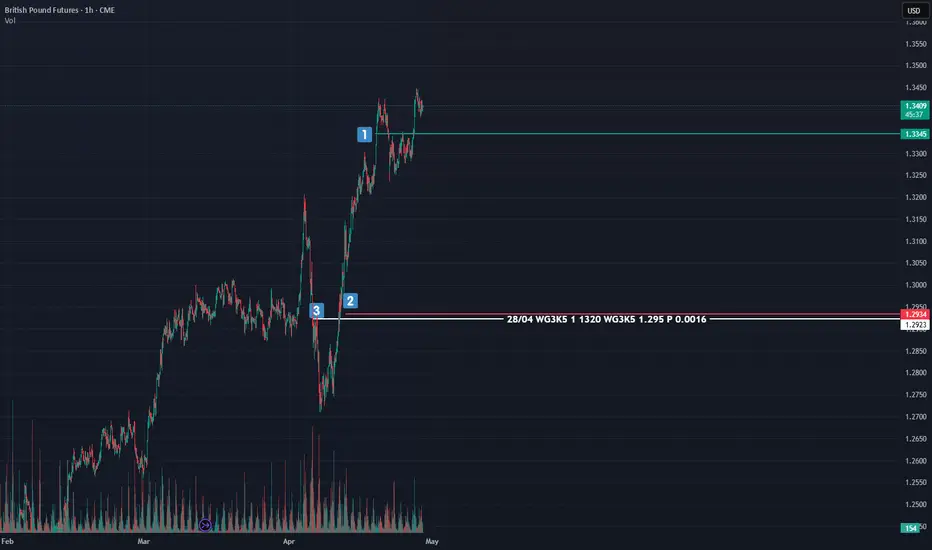
Now, let’s take a look at the screenshot of the British Pound futures chart. Here’s what you’ll see:
- A green line representing the average long position of retail traders.
- A red line for the average short position.
- The breakeven point of a put option contract for the June futures expiring on May 22, with 1,320 contracts at a strike of 1.295.
Take a moment to study the chart. What do you observe? 🤓
Ok, breathe in, breathe out. Tomorrow, we’ll dive deeper into this analysis. Don’t forget to subscribe so you won’t miss the continuation of this story! The insights I’ll share are definitely worth your time, as I aim to shift your perspective on the market by demonstrating a clear methodology without relying on indicators or technical patterns.
Stay tuned; it’s going to be incredibly valuable! 🚀✨
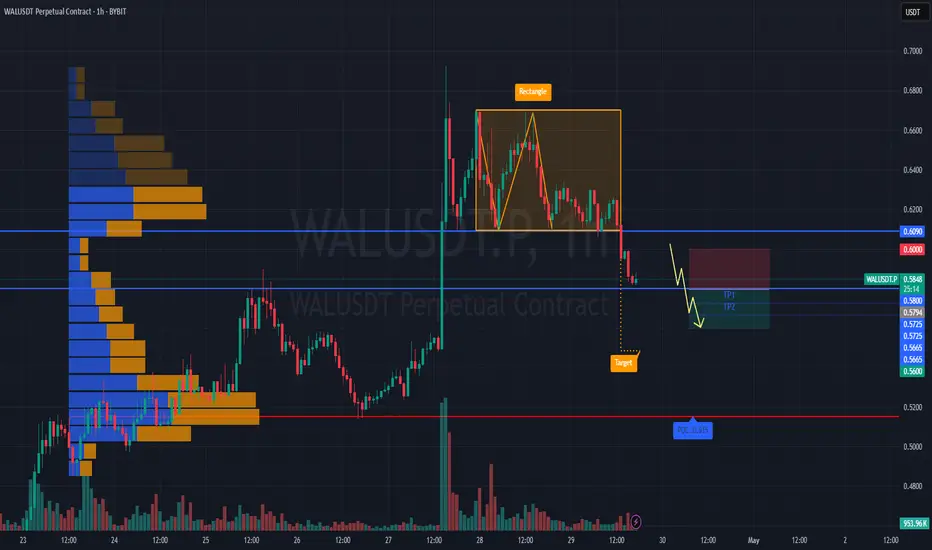
#WALUSDT continues its bearish momentum 📢 As long as the price stays under $0.6000 — short BYBIT:WALUSDT.P bias remains valid.
📢 Watch for further weakness!
📉 SHORT BYBIT:WALUSDT.P from $0.5794
🛡 Stop loss: $0.6000
🕒 Timeframe: 1H
✅ Overview:
➡️ The chart shows a clearly formed and broken Bearish Rectangle, confirming a short setup after price exited the range to the downside.
➡️ The $0.6090 support level has turned into strong resistance.
➡️ Entry at $0.5794 follows a textbook breakdown and retest structure.
➡️ Target area aligns with the volume-based support near POC $0.515, offering solid R:R.
🎯 TP Targets:
💎 TP 1: $0.5725
💎 TP 2: $0.5665
💎 TP 3: $0.5600
📢 Bearish structure confirmed with increased volume.
🚀 BYBIT:WALUSDT.P continues its bearish momentum — downside potential remains active!
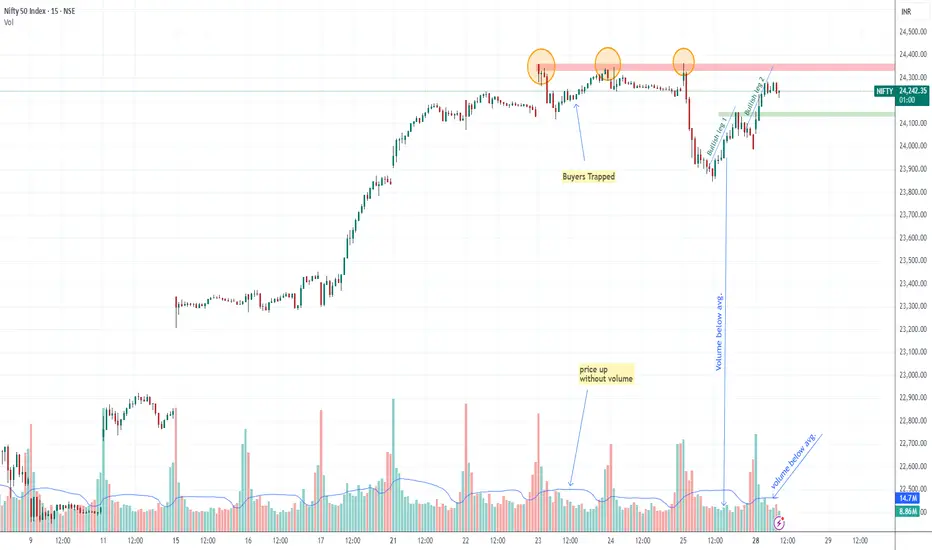
let it be cross & sustained above 24350 leveltoday 28 April market showing strengths after little correction on Friday, yeah ofc market mode is still bullish but see BULLISH LEG 1 mention on chart below avg. traded volume not supporting price same Today BULLISH LEG 2 also have below avg. volume noticed, same you can noticed on 23 April when market was going up below avg. volume before falling , so if nifty really bullish pls let it be cross and sustained above 24350 level
Watch for a breakout from the #BANKUSDT📍 The price of MEXC:BANKUSDT.P is approaching the apex of the pattern — a breakout from consolidation is expected soon. The main scenario favors a downward breakout, with a short opportunity if confirmed.
📍 Important note: ➡️ Don’t rush the entry! Wait for a clear breakout from the pennant and confirmation of the direction.
📍 Beware of fakeouts — the key to success lies in confirmation with candle closes and volume.
📉 SHORT MEXC:BANKUSDT.P from $0.04118
🛡 Stop loss: $0.04284
🕒 Timeframe: 1H
📢 Overview:
➡️ The main structure of MEXC:BANKUSDT.P remains bearish, showing consolidation after a drop.
➡️ A break below the $0.04118 support will trigger the Bearish Pennant pattern.
➡️ Volume increase on the breakout will confirm sellers' dominance.
🎯 TP Targets for SHORT:
💎 TP 1: $0.04010
💎 TP 2: $0.03900
💎 TP 3: $0.03815
📢 Entry conditions for MEXC:BANKUSDT.P :
Enter only after a clear breakdown and candle close below $0.04118, ideally with volume confirmation.
📢 If the price holds above $0.04588, the structure may be invalidated, and the short scenario should be reconsidered.
📈 LONG MEXC:BANKUSDT.P from $0.04652
🛡 Stop loss: $0.04501
🕒 Timeframe: 1H
📢 Overview:
➡️ Price is compressing inside a Bearish Pennant, but there is still potential for a fake breakout upward.
➡️ A breakout above the pennant on strong volume may lead to a bullish impulse.
➡️ The $0.04652 level is key for a long entry after confirmation.
🎯 TP Targets for LONG:
💎 TP 1: $0.04760
💎 TP 2: $0.04870
💎 TP 3: $0.04970
📢 Entry conditions:
Enter only after a confident breakout above $0.04652 and a solid candle close (preferably with high volume).
🚀 Watch for a breakout from the MEXC:BANKUSDT.P structure and trade only in the confirmed direction. Either way — there is good movement potential and the R/R ratio is solid in both directions!

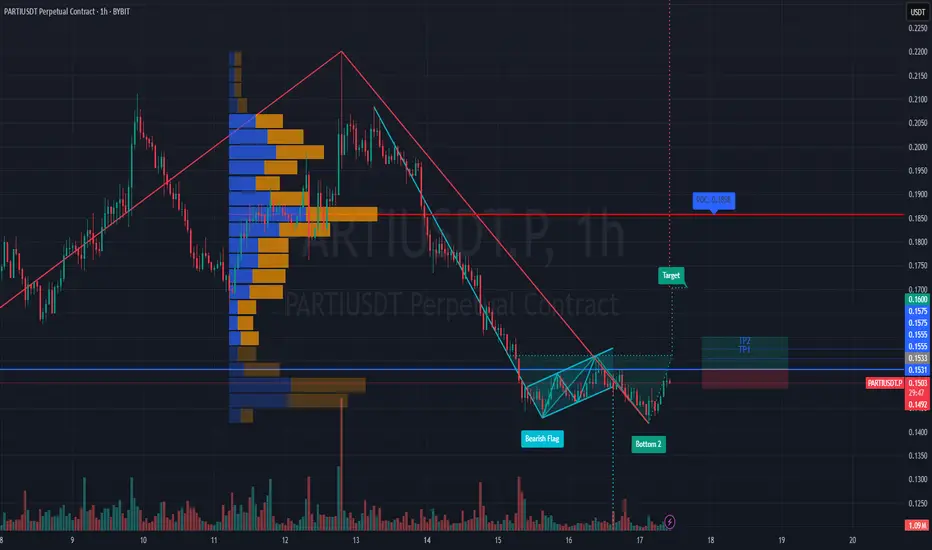
#PARTIUSDT is showing signs of a reversal🚀 The price BYBIT:PARTIUSDT.P is showing signs of a reversal after a prolonged downtrend.
🚀 The scenario becomes more likely if the price holds above $0.1520 with increasing volume.
🚀 Watch for a breakout and confirmation above the $0.1500–$0.1520 zone — this would strengthen the bullish setup.
🚀 If volume picks up during the continuation of the move, a quick push toward $0.18 is possible.
📈 LONG BYBIT:PARTIUSDT.P from $0.1533
🛡 Stop loss: $0.1492
🕒 Timeframe: 1H
✅ Overview:
➡️ The price has broken out above the Bearish Flag, confirming a break in the downtrend structure.
➡️ The Double Bottom formation increases the likelihood of an upward move.
➡️ Entry at $0.1533 is just above the resistance zone and confirms the breakout.
➡️ The upward potential remains toward $0.1600 and beyond, aiming for the POC volume area.
🎯 TP Targets:
💎 TP 1: $0.1555
💎 TP 2: $0.1575
💎 TP 3: $0.1600
📢 Support zone: $0.1500–$0.1510 — must hold to maintain the bullish structure.
📢 If price consolidates above $0.1555, expect a potential acceleration toward $0.1600.
📢 A drop below $0.1492 invalidates the scenario — stop is mandatory.
🚀 BYBIT:PARTIUSDT.P breaks key level — bullish signal confirmed! Watch for continuation!
#Bitcoin is bouncing again!#Bitcoin is bouncing again!
The weekly 50 EMA is holding strong as support.
Every time this happens, a big move follows.
Are we about to see a new rally? 👀
Retweet if you're bullish
#BTC #Crypto

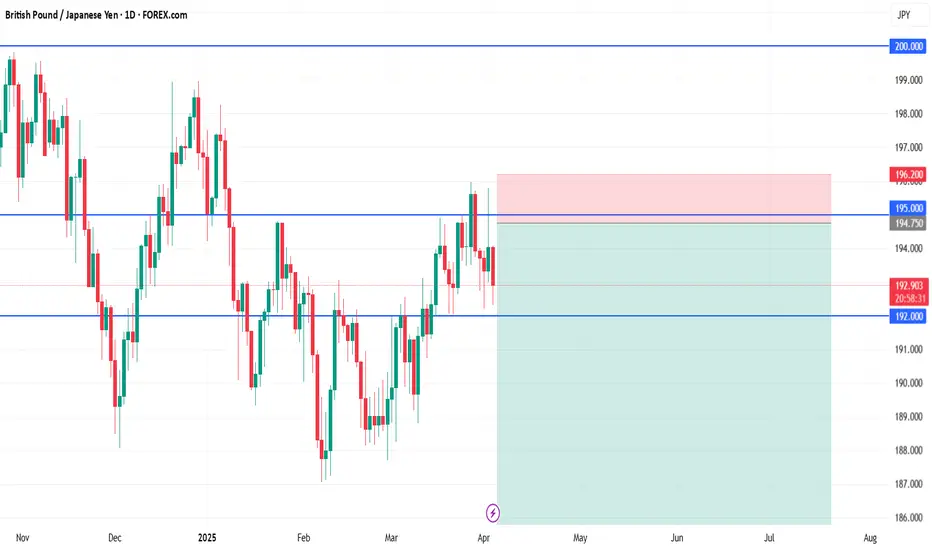
GBP/JPY short🧩 GBP/JPY Swing Short Setup
📍 Entry:
Sell Limit: 194.75
🛡️ Stop Loss (Above Resistance Wick):
SL: 196.20
→ Covers minor breakout/fakeout above 195 zone while protecting against invalidation
🎯 Take Profits:
TP1: 190.00
(Structure floor + first major reaction zone)
TP2: 185.00
(Clean horizontal support and demand zone)
TP3 (Swing Target): 180.00
(Large macro target — monthly structure retest)
🧠 Rationale Recap:
Price is consolidating just under multi-year resistance (195–200)
Fundamentals align: GBP weakening, JPY strengthening in risk-off environment
Strong R:R, clean rejection zone, and macro pressure potential
#NEIROETHUSDT maintains bearish momentum❗️Keep an eye on the BYBIT:NEIROETHUSDT.P — the structure suggests a possible local rebound or a breakout of the wedge to the upside. Opening a short here goes against the structure and lacks confirmation
📉 SHORT BYBIT:NEIROETHUSDT.P from $0.01612
🛡 Stop loss $0.01693
🕒 Timeframe: 1H
✅ Overview:
➡️ The chart shows BYBIT:NEIROETHUSDT.P forming a bearish continuation move after breaking out of a consolidation range.
➡️ Entry at $0.01612 corresponds to a retest of former support turned resistance.
➡️ Selling volume is increasing, supporting bearish pressure.
➡️ The POC level at $0.02084 remains far above the current price, highlighting downward imbalance.
🎯 TP Targets:
💎 TP 1: $0.01586
💎 TP 2: $0.01535
💎 TP 3: $0.01500
📢 Additional scenario notes:
📢 A false breakout above the entry zone is possible — wait for confirmation of the $0.01620 break.
📢 Watch for volume spikes near TP1 and TP2 — could signal partial take profits.
📢 If price reclaims $0.01693, the setup becomes invalid.
🚀 BYBIT:NEIROETHUSDT.P maintains bearish momentum — downside move expected!

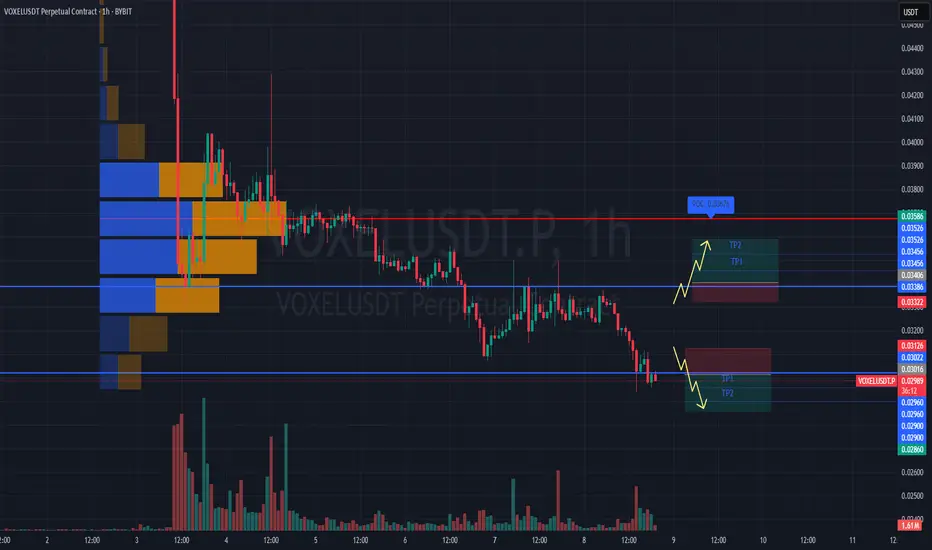
#VOXELUSDT is in an uncertain zone📊 BYBIT:VOXELUSDT.P Scenario – Potential for Movement in Both Directions!
🚀 BYBIT:VOXELUSDT.P is forming a bullish Falling Wedge pattern — a breakout to the upside could provide a great risk/reward long opportunity!
At the current stage, the BYBIT:VOXELUSDT.P market is shaping a scenario where both directions — long or short — are possible, depending on the reaction to key levels.
✅ Overview
➡️ The chart shows two key formations:
🔻 Bearish Pennant – a bearish continuation pattern, which has already played out to the downside.
🔻 Falling Wedge – a potentially bullish pattern, and price is now near the lower boundary of the wedge.
➡️ A weak bounce on volume is visible, and price is approaching a key resistance zone — a potential target if the wedge breaks out upward.
➡️ If the wedge plays out, a bullish impulse is expected.
Timeframe: 1H
📈 LONG BYBIT:VOXELUSDT.P from $0.03406
🛡 Stop loss: $0.03322
🎯 TP Targets:
💎 TP 1: $0.03456
💎 TP 2: $0.03526
💎 TP 3: $0.03586
➡️ This scenario becomes viable if price breaks and consolidates above the $0.03126–$0.03200 zone, opening the path toward the POC zone at $0.03676.
➡️ Volume should increase on the breakout to confirm momentum.
📉 SHORT #VOXELUSDT from $0.03016
🛡 Stop loss: $0.03126
🎯 TP Targets:
💎 TP 1: $0.02960
💎 TP 2: $0.02900
💎 TP 3: $0.02860
➡️ This scenario activates if the price fails to rise and pulls back below $0.03000.
➡️ Volume should confirm seller pressure.
➡️ The chart shows lower highs — risk of further decline remains.
📍 The price is currently in a critical decision zone , between the short entry level and the potential breakout zone for a long.
📍 The support below is strong — it has held the price several times already. No clean breakdown has occurred yet, which increases the chances of the wedge breaking upward.
📍 Avoid rushing into a position — wait for a clear confirmation in either direction (e.g., strong impulse on volume and consolidation above/below key levels).
📢 General advice on this asset:
📢 Wait for direction confirmation — both long and short setups are valid.
📢 Stay flexible and adjust to the move.
📢 Manage your risk carefully — do not enter without a signal.
🚀 BYBIT:VOXELUSDT.P is in an uncertain zone — the signal could play out in either direction. Watch the key levels and enter only after confirmation!
#TRUMPUSDT — Breakdown or Reversal Confirmation🚀 BYBIT:TRUMPUSDT.P — Breakdown or Reversal Confirmation? Full Breakdown on 1H & 4H!
Let’s start by analyzing the charts on different timeframes:
✅ On the 1H chart , we clearly see a reversal pattern — Inverted Head & Shoulders — and the neckline breakout has already occurred. The volume on the breakout is high, which confirms the strength of the signal.
➡️ The target for this pattern is around $10.75–$10.80, which also aligns with the upper VPOC level from the previous range.
➡️ The POC level for BYBIT:TRUMPUSDT.P is $10.159, which may now act as support — this can be a potential entry zone.
➡️ Nearest resistance is at $10.40. A breakout above this level could trigger an impulse move towards $10.75–$10.80.
✅ On the 4H chart , a bearish flag is forming, which could potentially push the price lower — but this scenario hasn't played out yet.
➡️ There's also a local double bottom, confirmed by a price bounce. A retest of the flag’s lower boundary will be a key moment.
Let’s break down the patterns:
✅ 1. Inverted Head & Shoulders (1H) – A classic bottom reversal formation.
➡️ The neckline breakout occurred on increased volume — a key confirmation for a long setup.
✅ 2. Volume (Volume Profile & Bars) – Strong volume spike during the breakout confirms buyer interest.
✅ 3. Price broke out of consolidation – We’ve seen an impulsive breakout and the price is holding above the neckline.
✅ 4. Local Market Structure Break (MSB) – A shift from local downtrend to an emerging uptrend.
📍 Key Point: If the price holds above $10.40, this confirms a breakout from the descending channel, increasing the chance of reaching $10.75–$11.00.
📍 Price must also stay above $10.15 and not fall back into the previous range. A retest and bounce from this level would serve as further confirmation.
📢 If the price drops back below $10.15 and breaks $9.87, the “Inverted Head & Shoulders” pattern will be invalidated. In that case, a bearish trend will likely resume and a short toward $9.50–$9.00 could be considered.
📢 On the 4H chart, the risk of the bearish flag playing out still remains. We are monitoring the structure closely — a sharp pullback is possible.
📢 The volume zone around $10.15–$10.20 is key. As long as the price stays above it — the long scenario remains dominant.
🚀 As of now, BYBIT:TRUMPUSDT.P has strong technical reasons to support a long bias, especially if it holds above $10.40 — that would open the door to $10.75–$11.00.
Risks remain — particularly around the 4H bearish flag — but for now, bullish momentum prevails.
🚀 BYBIT:TRUMPUSDT.P still holds upside reversal potential — LONG scenario remains the priority!

#GPSUSDT is forming a bearish structure📉 Short BYBIT:GPSUSDT.P from $0.02888
🛡 Stop loss $0.02952
🕒 1H Timeframe
⚡️ Overview:
➡️ The main POC (Point of Control) is at 0.03326, marking the highest volume zone and a major resistance above the current price.
➡️ The 0.02952 level acts as local resistance and an ideal stop placement.
➡️ Price BYBIT:GPSUSDT.P has already tested the $0.02888 support — a confirmed breakdown could trigger stronger downward momentum.
➡️ Volume is increasing on the decline, supporting the sellers' pressure.
🎯 TP Targets:
💎 TP 1: $0.02850
💎 TP 2: $0.02810
💎 TP 3: $0.02787
📢 Watch for a clean break of the $0.02888 level — it could be the entry trigger for this short setup.
📢 If price pulls back above $0.02952, the short scenario becomes invalid.
BYBIT:GPSUSDT.P is forming a bearish structure — continuation to the downside is expected if support fails.

Nvidia Update New levels to the downside Longs and shortsIn this video I discuss the market structure shift in Nvidia and highlight new levels to be aware of to the downside . Potential here for longs and shorts .
Tools used Fibs, Gann Square , Speed Fan , Order blocks .
Please Like and comment if you have any questions . Have a great Day and thanks for your support

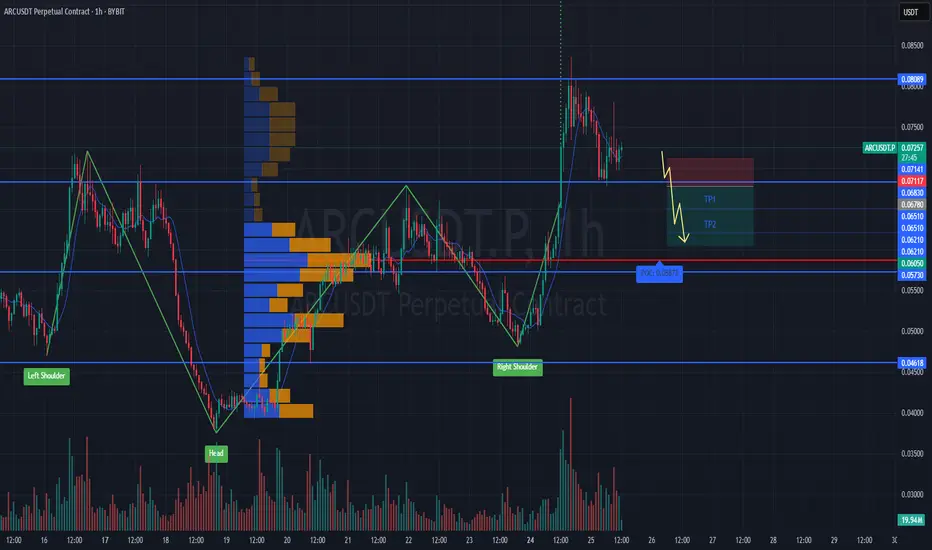
#ARCUSDT is showing signs of reversal📉 Short BYBIT:ARCUSDT.P from $0.06780
🛡 Stop loss $0.07117
🕒 1H Timeframe
⚡️ Overview:
➡️ The main POC (Point of Control) is at 0.05873, indicating the area with the highest trading volume.
➡️ The 0.07117 level acts as strong resistance where the price previously reversed.
➡️ The chart shows a potential topping structure followed by a decline.
➡️ Volume concentration between $0.065 and $0.06210 suggests key zones for potential profit-taking.
🎯 TP Targets:
💎 TP 1: $0.06510
💎 TP 2: $0.06210
💎 TP 3: $0.06050
📢 Watch the key levels and enter after confirmation!
📢 The price has already started to move down — downside momentum remains strong.
📢 The TP levels are near a previous consolidation zone, allowing quick target execution.
BYBIT:ARCUSDT.P is showing signs of reversal — considering shorts with clear downside targets!
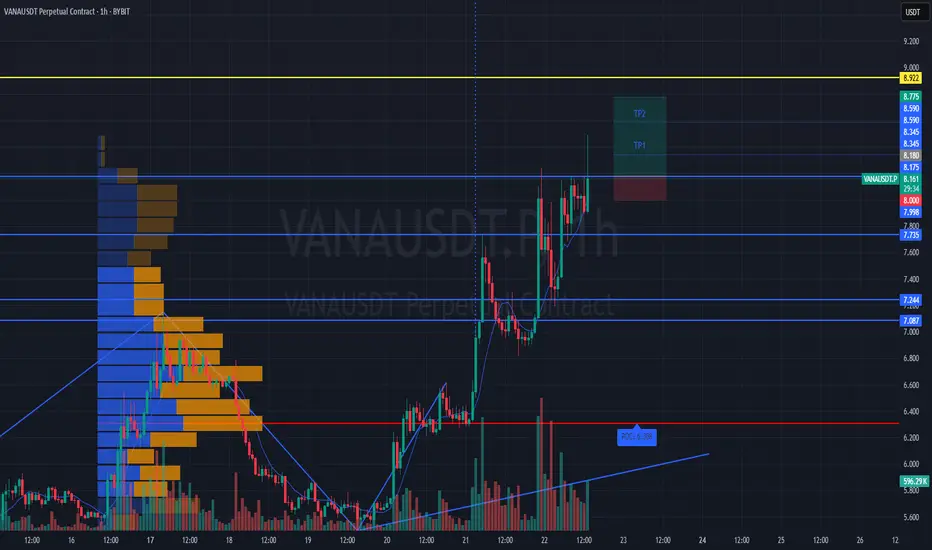
#VANAUSDT is forming a confident bounce from key levels📉 LONG BYBIT:VANAUSDT.P from $8.180
🛡 Stop loss $8.000
1H timeframe
❗️Before entering the trade, closely monitor the levels. If the price consolidates above $8.180 with volume, this confirms the entry signal.
✅ Overview BYBIT:VANAUSDT.P :
➡️ On the chart, we can see that after a downward movement, the price formed a local bottom around $8.000, followed by an upward impulse.
➡️ A structure resembling a reversal pattern has appeared: the price broke through a slanted resistance (blue line) and consolidated above $8.180, indicating weakening sellers.
➡️ The price is now moving toward a resistance zone marked as POC (Point of Control) at $8.353, which could be the first target.
➡️ The entry is set at $8.180, aligning with the breakout level, supported by increasing volume and a short-term uptrend.
The volume profile on the left shows a low-liquidity zone above the current price (between $8.345 and $8.590), which may allow the price to quickly reach the TP levels.
🎯 TP Targets:
💎 TP 1: $8.345
💎 TP 2: $8.590
💎 TP 3: $8.775
⚡️ Plan:
➡️ Monitor the price reaction at TP1 ($8.345) — a pullback is possible. It’s recommended to close part of the position.
➡️ Wait for confirmation of the breakout above $8.180 (already happened, price is above).
➡️ Enter LONG after a retest (with volume) — in this case, the retest has already occurred, and the price is moving up.
➡️ Place the stop below the last low — at $8.000.
BYBIT:VANAUSDT.P is forming a confident bounce from key levels, and if it holds above the entry zone, we expect an upward movement!