DOGE Dogecoin Price Targets and Stop LossDOGE/USDT
Entry Range: $0.130 - 0.145
Take Profit 1: $0.166
Take Profit 2: $0.190
Take Profit 3: $0.215
Stop Loss: $0.121
AND

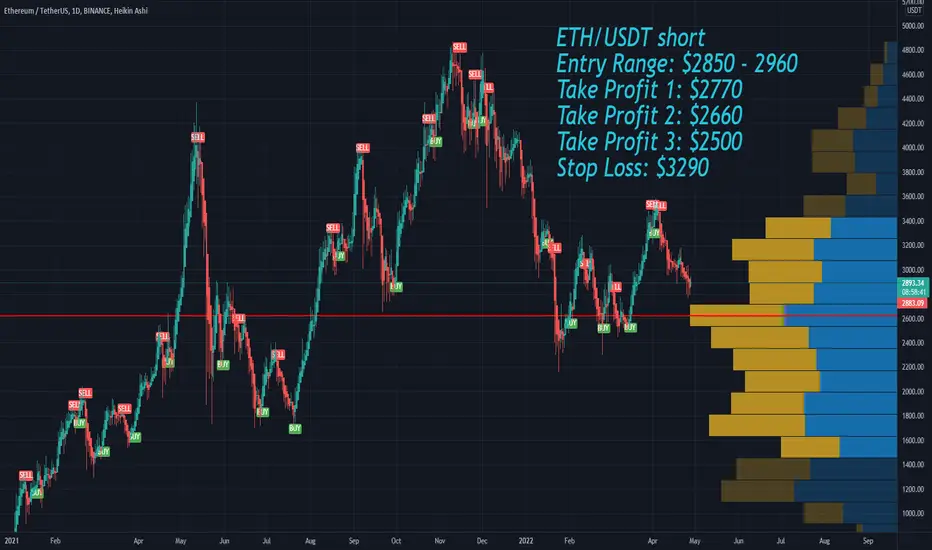
ETH Ethereum short Price Targets and Stop LossETH/USDT short
Entry Range: $2850 - 2960
Take Profit 1: $2770
Take Profit 2: $2660
Take Profit 3: $2500
Stop Loss: $3290
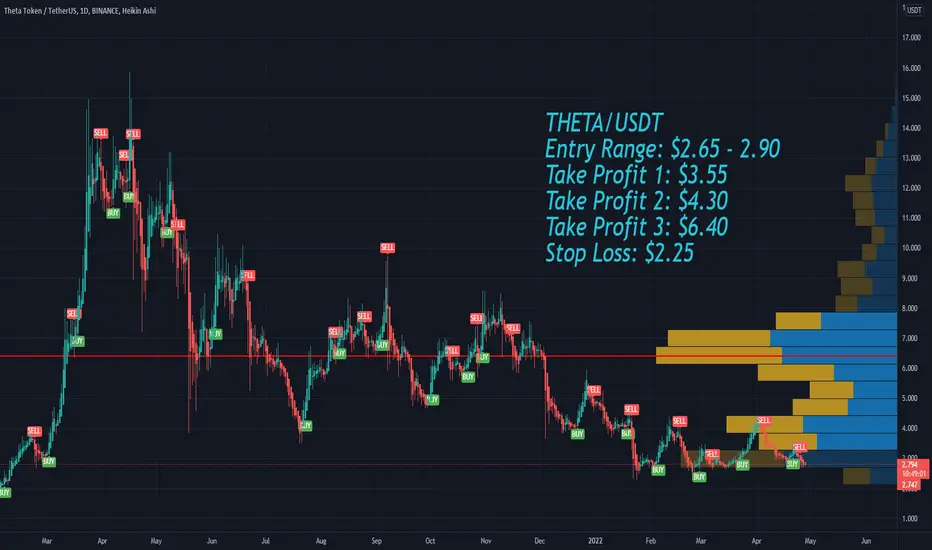
THETA Price Targets and Stop LossTHETA/USDT
Entry Range: $2.65 - 2.90
Take Profit 1: $3.55
Take Profit 2: $4.30
Take Profit 3: $6.40
Stop Loss: $2.25
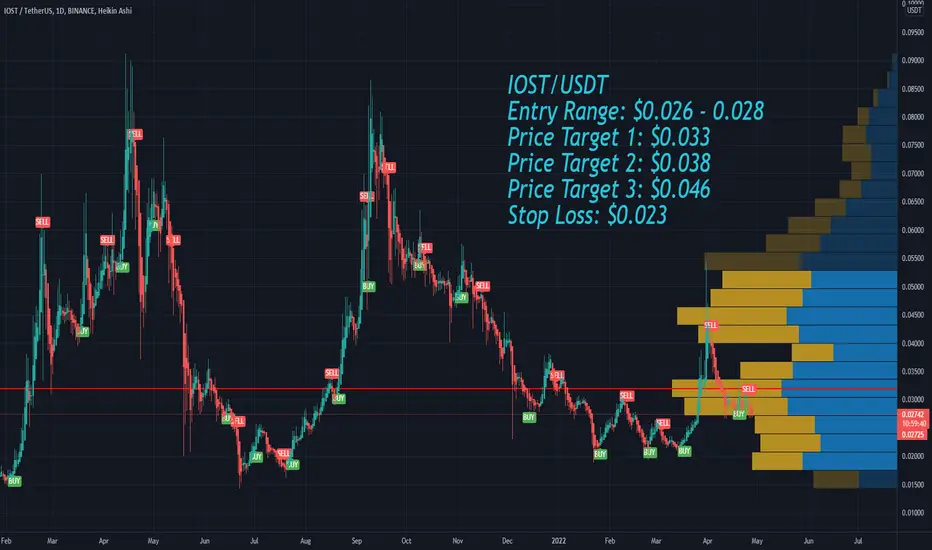
IOST Price Targets and Stop LossIOST/USDT
Entry Range: $0.026 - 0.028
Price Target 1: $0.033
Price Target 2: $0.038
Price Target 3: $0.046
Stop Loss: $0.023
all targets reached previously
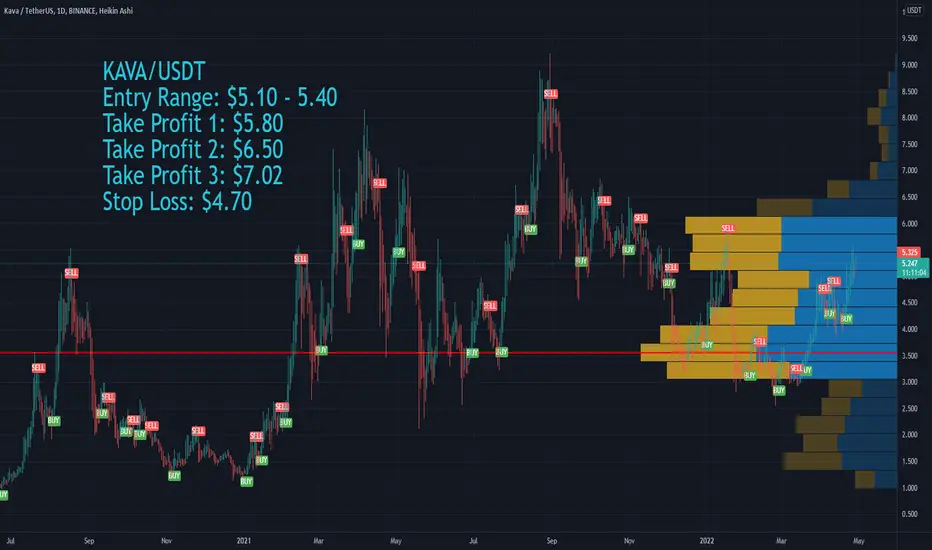
KAVA Price Targets and Stop LossKAVA/USDT
Entry Range: $5.10 - 5.40
Take Profit 1: $5.80
Take Profit 2: $6.50
Take Profit 3: $7.02
Stop Loss: $4.70
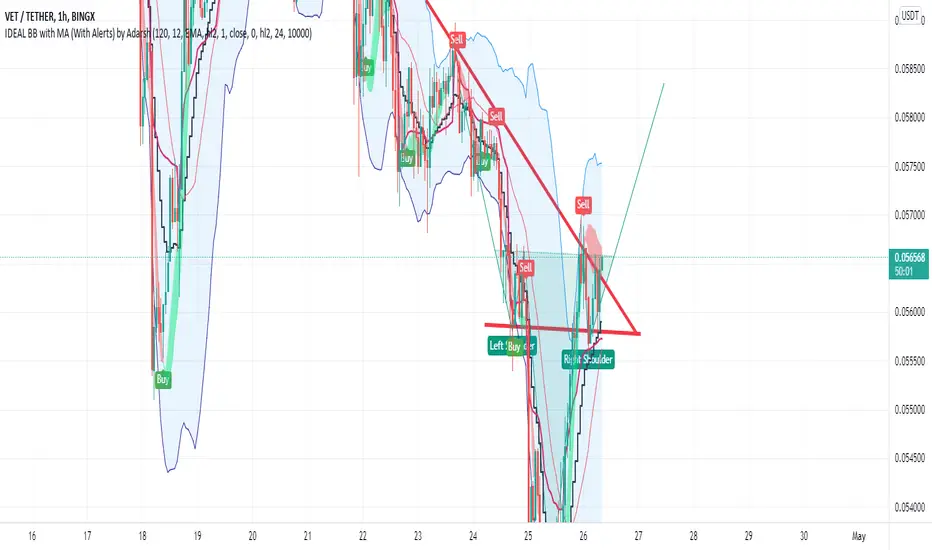
VET can be hugeVET already broke 20 days resistance and we can seee outbreak also there is inverted head and shoulders pattern on 15m chart and the reversal candlestick on 1 day chart
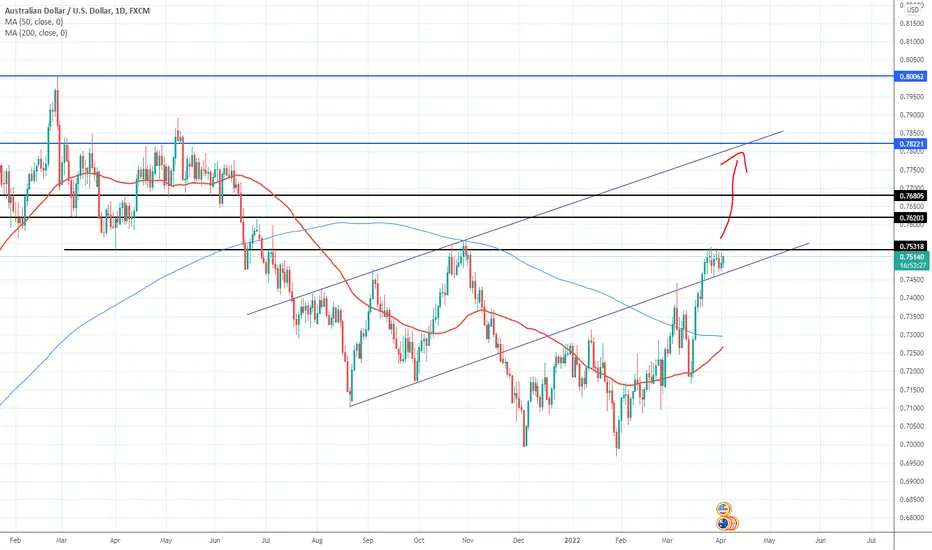
AUDUSD Long or ShortIt is inside a new channel. Wait till it to confirm its inside the new channel. Then go long. If it is a false breakout it will go back down to where it was. So be patient until it shows the correct direction. GL.
Head and Sholders on Ethereum 4 hour
Head and Shoulders on Ethereum 4-hour chart breakout to go long.
Neckline at $3160.00
I mean me may self and I.
Not a financial advice!

BITCOIN SOON TILL MOONHello budies,unlike other markets predictability and so called bitcoin relation to s&p 500 or others i belive bitcoin is not technically and specially on low tf s predictable but fundamentally.the large market cap of btc almost creates limitations for manipulation of whales but exchanges smart platforms are designed so perfectly that can benefit most of traders s/l ,liquids and so on.the reason that pesuades me to belive that most TA are not reliable is that cryptocurency traders mostly are observing the same price movements on their screens and mostly share the same knowledge of TA.a good strategy considering all probalality and avoiding emotional trading leads owners to have a good plan and benefit most of price movements.
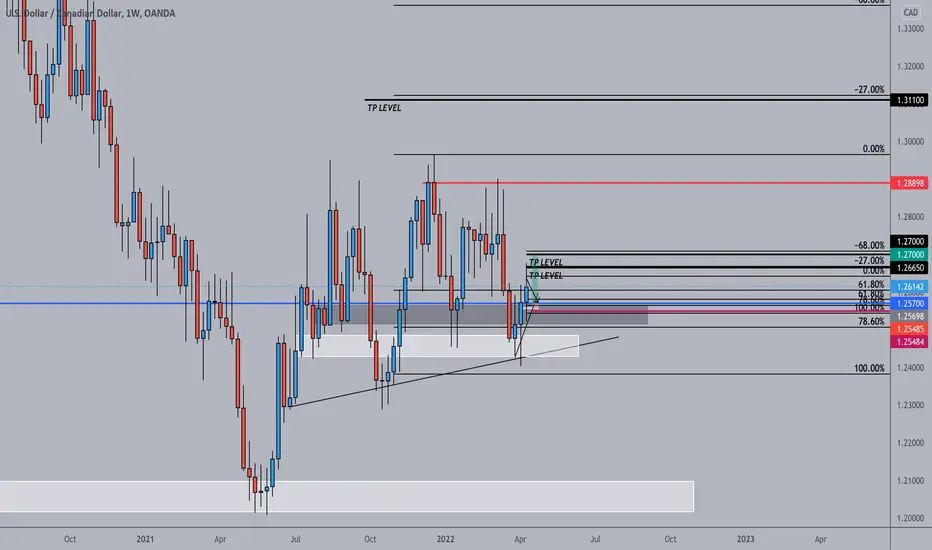
USDCAD LONG 16/04/22
4H INV H+S PATTERN
I.C CANDLE
-68 FIB COMPLETION
PREVIOUS BULLISH P.A FROM THIS REGION
1D:
BULLISH M CONTINUATION PATTERN
FALSE BREAK OF THE DAILY LOW
DAILY BULLISH CANDLE
1W:
-68 FIB COMPLETION
BULLISH CLOSE
INV H+S
1M:
/ES FUTURES blast off from here ??Looking like a bullish symetrical triangle ready to break out to me .. lets see.

How do you spot your support and resistance?I have seen a lot of traders designing their chart with so much lines even at the lowest time frame all in the name of support and resistance.
It’s quite funny but really not so.
For me I only look for key zones or I call it strong zones. When plotting my S&R, I k my look for those zones that pushes market high to about 50pips and above as support or deep as low as 50pips and above as resistance.
And I find them at H4 or H1 TF
In this case my I have a clean chart on M15 TF where I easily fine my entries.
Dose this make sense to you?
Tell me, How do you plot your own S&R?

Make Some Quick Money On AUD/USD make some quick money on AUD/USD, trade the potential double bottom structure here, which is forming in the supply zone, apply your own risk management and trade.

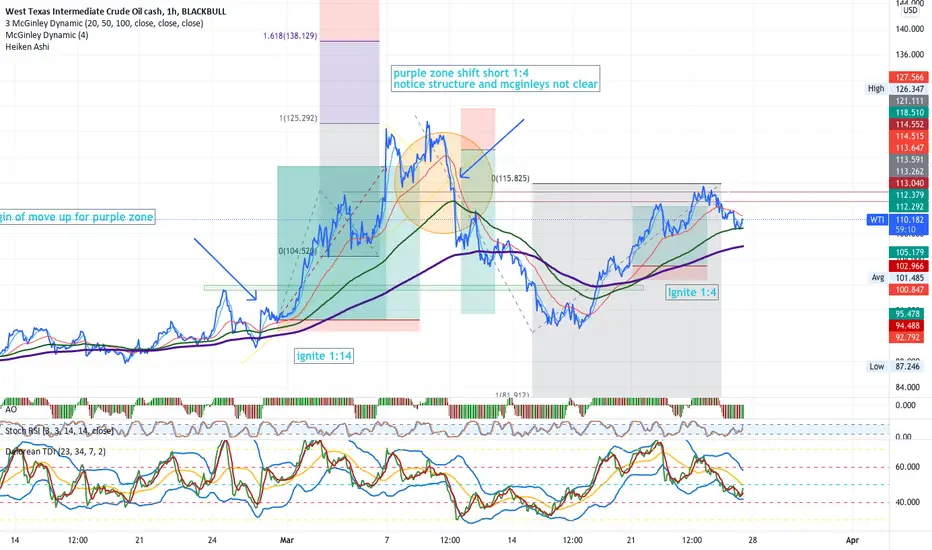
back test look at what trades were avail on Crude oilMarking up OIL as to what trades were available.
Its a good look at what we should have seen for opportunity. how the indicators and fibs measured. entries are 2 different strategies. Ignite and delorean shadow
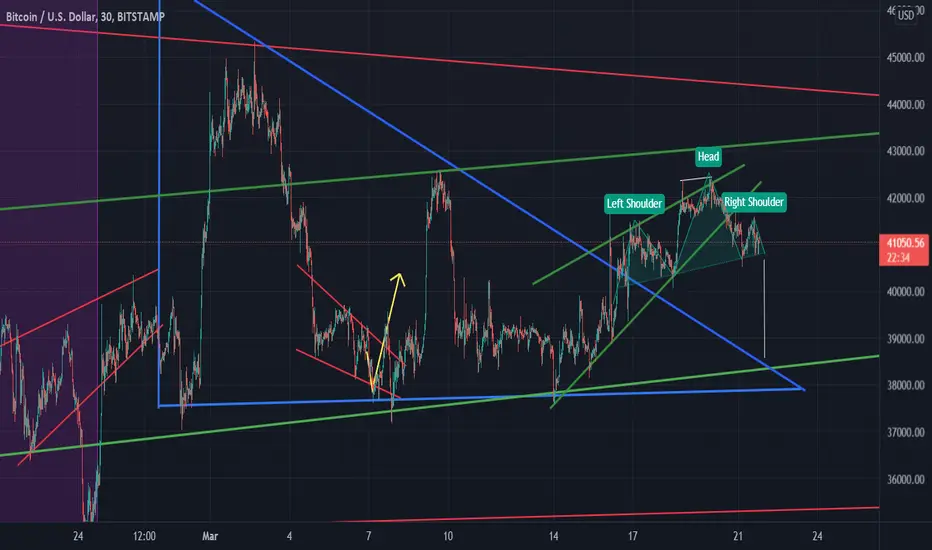
BTC 38.5k within 36 hours? Head and shoulders..Which is exactly on top of the descending wedge support. I dont think we will see 40k again after this for a long period of time
ETHBTC Weekly Chart- Current patteenHead and shoulders pattern with retests of major trend line. This happened multiple times recently on bitcoin daily-weekly showing distribution which I would post as an example but I can’t on mobile.
Apologies on the complicated drawing but the test of the major trend line are the key points. Almost every time I’ve seen this distributive pattern in results in a bearish move like it is taught.

GAP TO FINISH FILLING on MONDAY?? $SPYPossible gap to finish filling tomorrow 4 point possible short, hm?? lets see hopefully some consolidation during pm so we could possibly catch the move on puts ? #15min

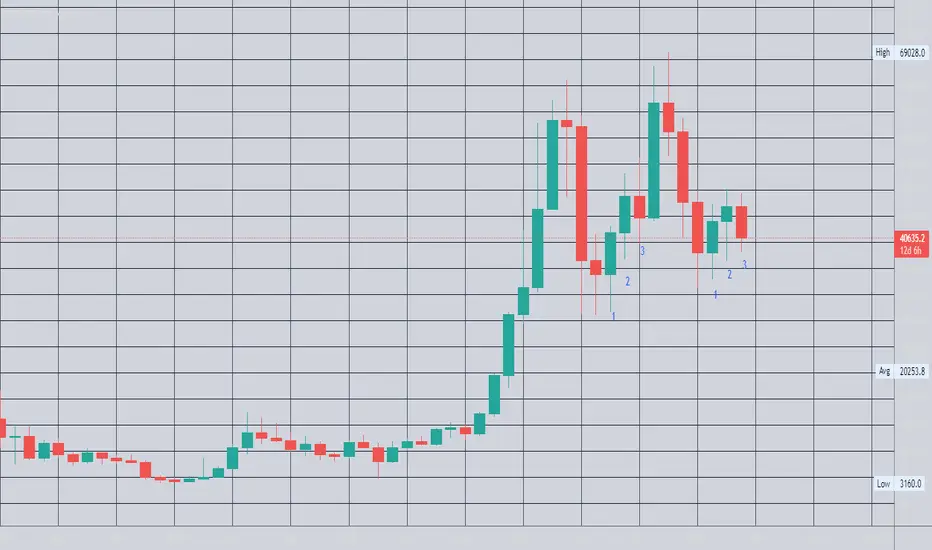
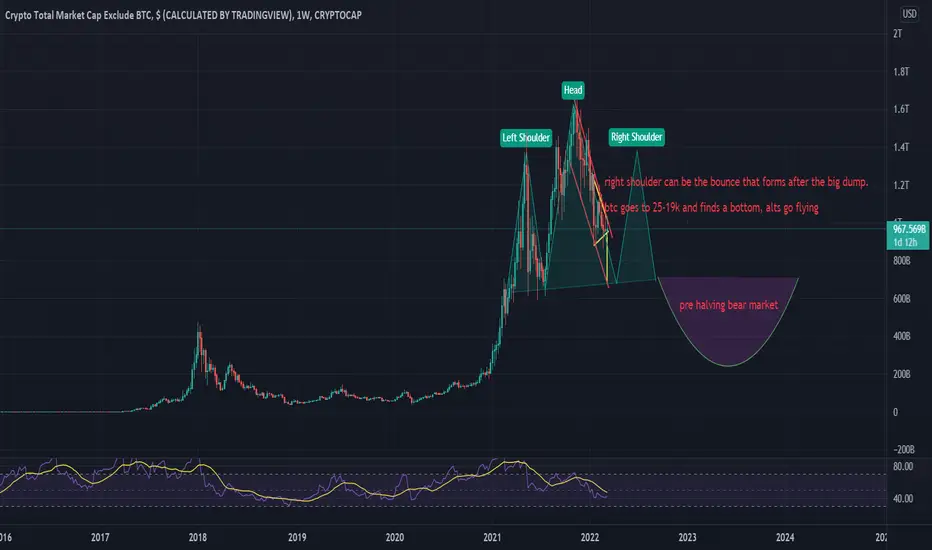
2 year prediction of total2, by Dia. big dump incoming.Seems like in a week or so we get the big answer. Market looks extremely bearish , I personally dont believe we can break the resistance
Pattern looks incredibly bearish.
We always dump before halving
the cup is drawn too big, it should not break the previous support of 462b
btc 19k bottom, maybe scam wick to 13k
expect 2020 highs of every altcoins, and some altcoins to completely be destroyed
GBPAUD Buy setupPrice currently downtrend but right now it the weekly trend line and make higher high and high low. WAIT FOR BREAK & Retest and Buy GL!!!

NEARUSDT is creating an inverse head and shouldersThe price bounced on the monthly support on 8$ after a false breakout from the weekly dynamic support.
On the daily timeframe, the price had a breakout from the dynamic resistance and from the weekly resistance, and now the price is testing the 0.618 Fibonacci level as resistance
On 5h timeframe, the price is creating an inverse head and shoulders above the weekly resistance
How to approach?
If the price is going to have a breakout from its neckline and retest as new support, we can apply our rules for a new long position.
Be aware of the weekly structure on 13$
According to Plancton's strategy , we can set a nice order
–––––
Keep in mind.
🟣 Purple structure -> Monthly structure.
🔴 Red structure -> Weekly structure.
🔵 Blue structure -> Daily structure.
🟡 Yellow structure -> 4h structure.
–––––
Follow the Shrimp 🦐

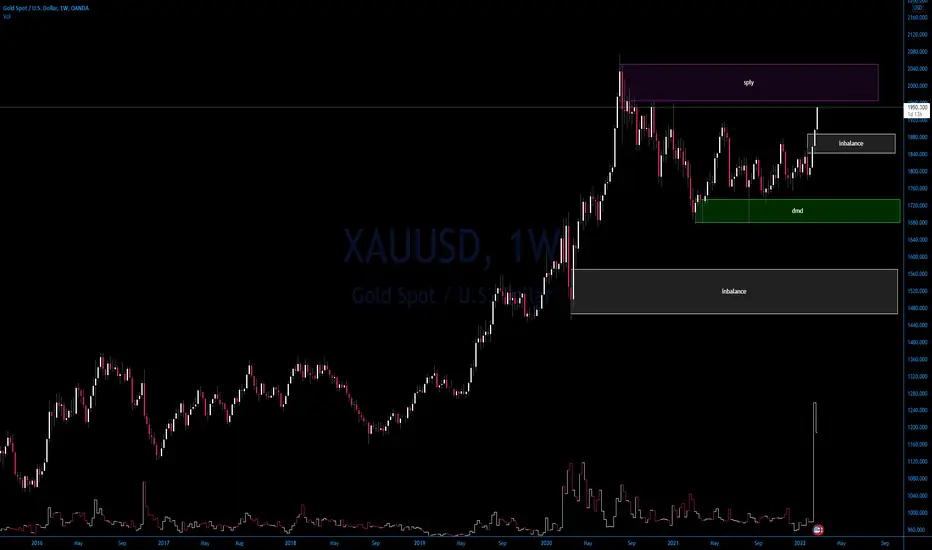
gold ......safe haven?hi guys so gold saw a huge upsurge through the night uk time. this all seems to be due to the ongoing russia and ukraine crisis. people always seem to rush to gold as a safe place to hedge there money but this surge has brought gold to a major supply zone so could be looking for heavy rejection around this zone i will be watching closely and trading accordingly
BTCUSDT is creating an inverse head and shouldersBTCUSDT: The price got a rejection from the weekly resistance on the 46k as I said on the previous analysis. On the daily timeframe (the upper one) the price is creating an inverse head and shoulders and its neckline is the 46k key level.
On the 4h timeframe (the lower one) we can see a Pennant pattern, and the price is testing the static support on 0.5 - 0.618 Fibonacci level.
Usually, when the price is in the accumulation phase below an important structure we will see a new breakout.
How to approach?
We are monitoring the market and will wait for a reaction on the 0.618 Fibonacci level (43k). we could see a deep retracement until the lower trendline. If the price is going to lose the dynamic support the next valid support is 40k.
IF the price is going to have a breakout from the pennant and a CLEAR breakout from 46k, According to Plancton's strategy , we can set a nice order
–––––
Keep in mind.
🟣 Purple structure -> Monthly structure.
🔴 Red structure -> Weekly structure.
🔵 Blue structure -> Daily structure.
🟡 Yellow structure -> 4h structure.
–––––
Follow the Shrimp 🦐

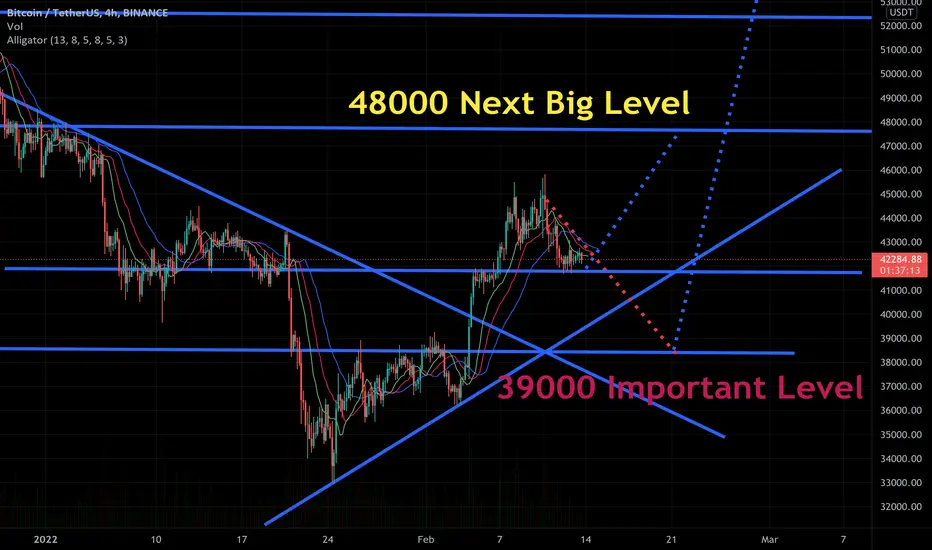
Bitcoin short term bearish, need to send it above 48k Now Bitcoin playing sideways, but we can see it on 39k if 41200 level break. But am sure btc hit 48k asap