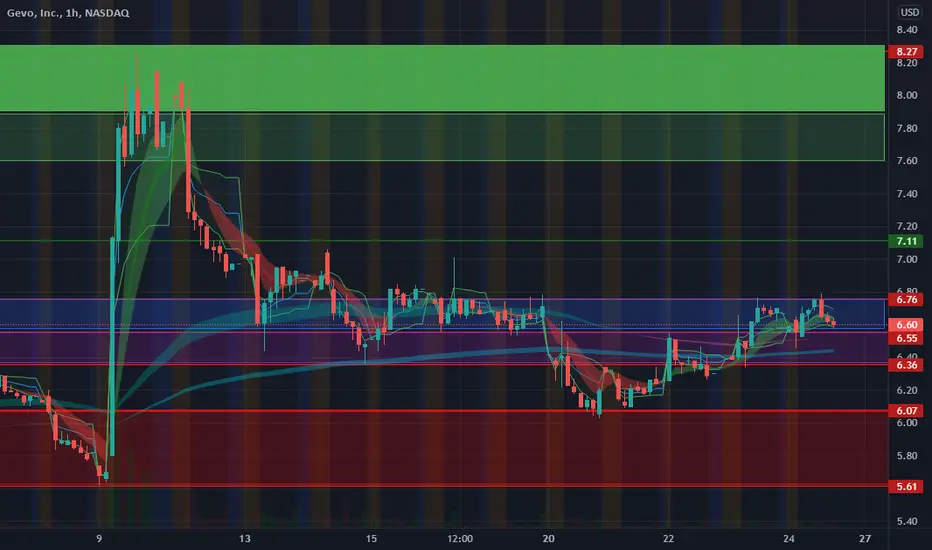
BIG CUM AND HANDJOB PATTERN BEARISHCorrect me if I am wrong...
I see hear that we go to 43 ish and heavly we are going to be beaten by HFuks
yeah?
But... triangle show fully tanked rockets!
AND

AMZN 2hr cup and handle played out beautifully ..2nd 2hr cup and handle played out perfectly maybe get in on a re entry?? hmm lets see....
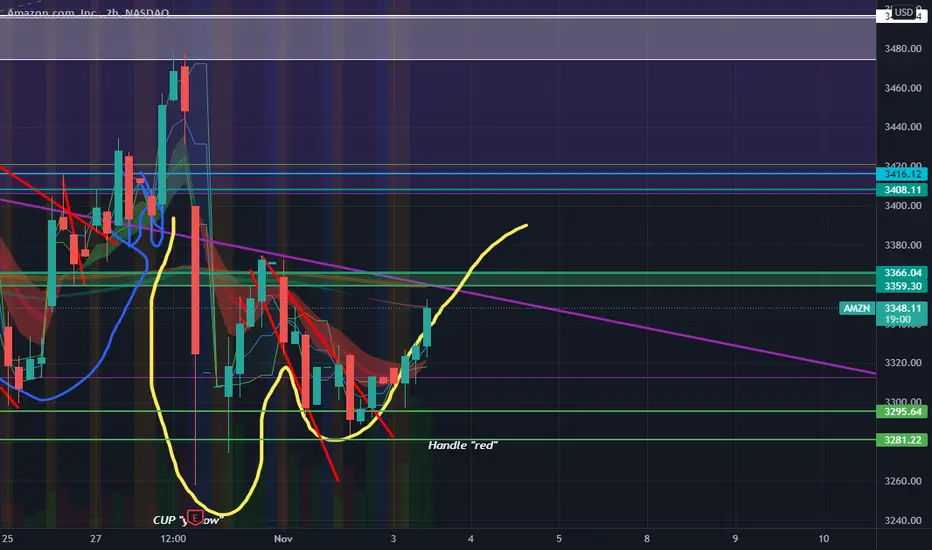
AMZN double cup and handle ?? 2hr chartWell would you look at that ... too me it looks like we have a mini cup and handle ripe and ready to break out the handle on the 2 hr, right after the first one pulled back a bit. what yall think?

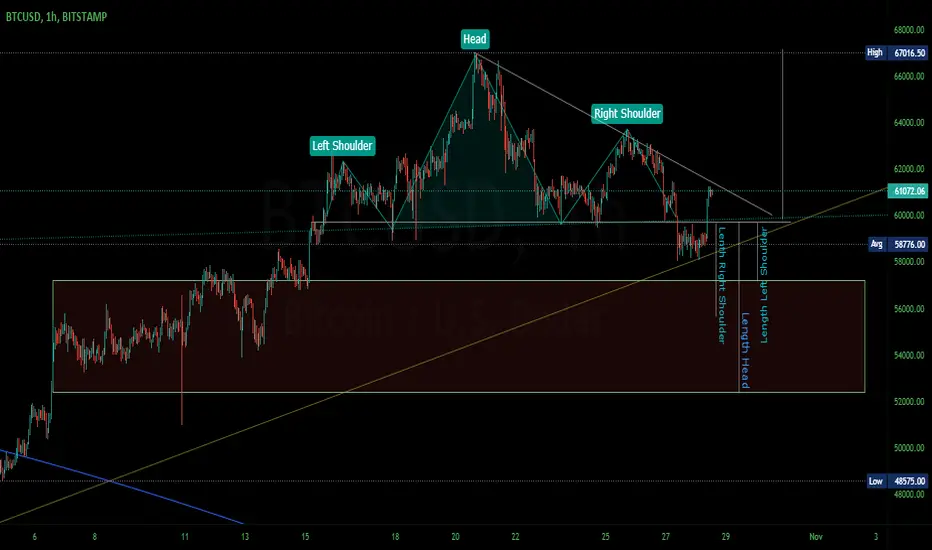
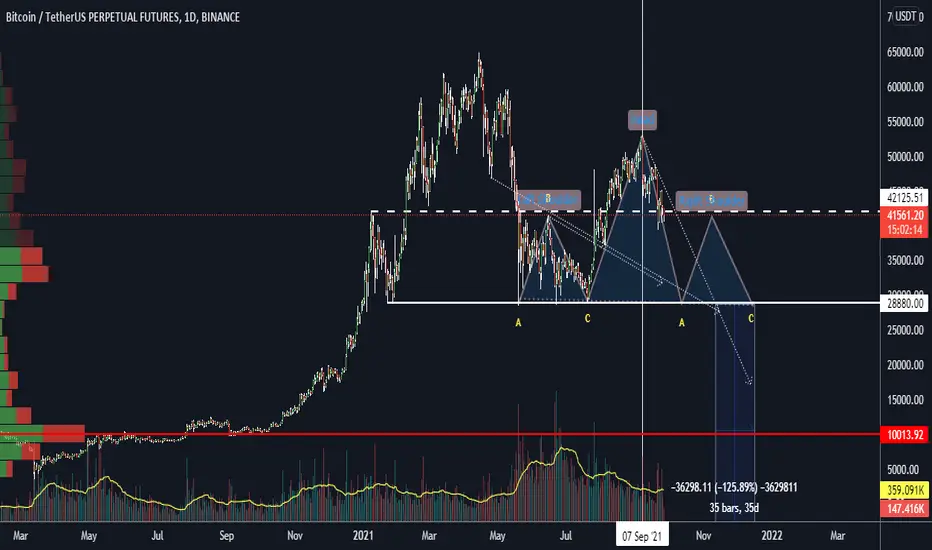
HEAD & SHOULDERS PATTERN FOR BITCOIN!!In this chart There is a Head and Shoulders pattern that looks to be invalidated but could still find its way back down.
With volume in Meme coins
like Shiba Inu recently, it makes me think a correction is coming. However this is not to tell you to sell, it is just to tell you where you should
possibly to your holdings/positions if the opportunity arises.
Anticipating a retest of the 56k area possibly all the way down to 52k for a buy.
Either way I'm not going to be selling my current holdings.
Hope this helps with perspective.
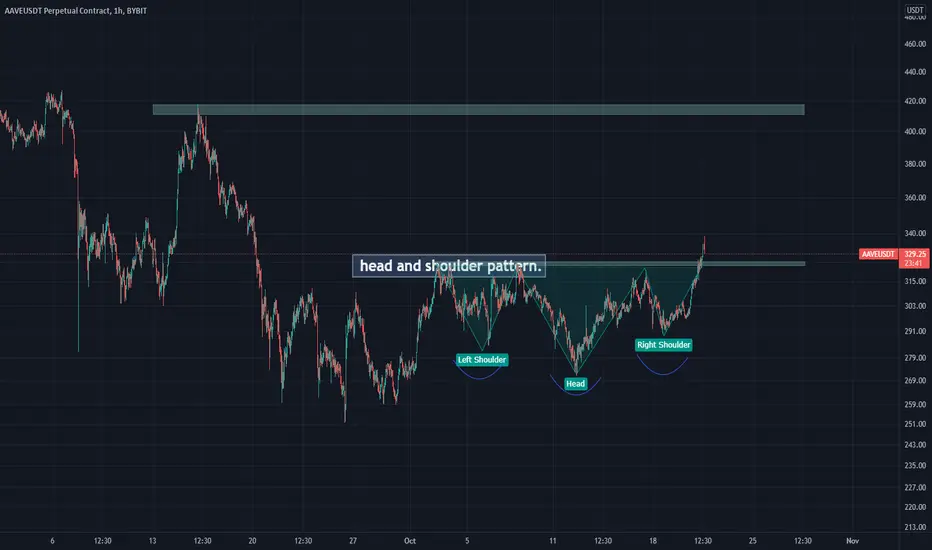
AAVE head and shouldersHI everyone AAVE is forming a head and shoulder pattern.
It can move up to $ 410 resistance.
Note : this is not a financial ADVICE
Please share your likes and comments with me.
AMAZON cup and handle on 2hr..AMZN cup and handle on 2 hour.... to bull flag confirmation breakout on 15m???


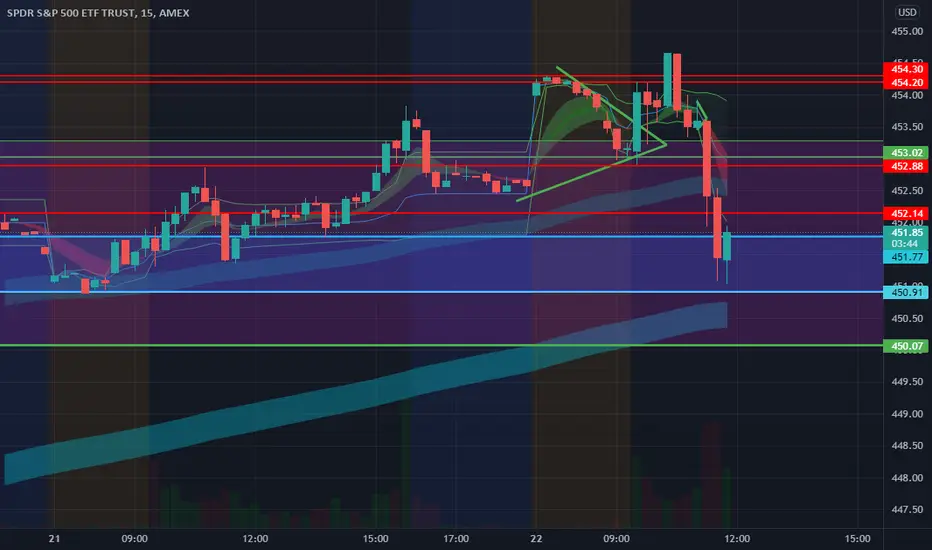
450.90 a good support for $SPY?zones a bit wacky up here but i like the 450.90 hold lets see where this goes futures been beat up vix up, needs to hold under 16.50 for bulls lets get it...
BUY ORDERS///// BUY EVERY DIP & TARGETs for open orders BUY ORDERS///// BUY EVERY DIP & TARGETs for open orders BUY ORDERS///// BUY EVERY DIP & TARGETs for open orders

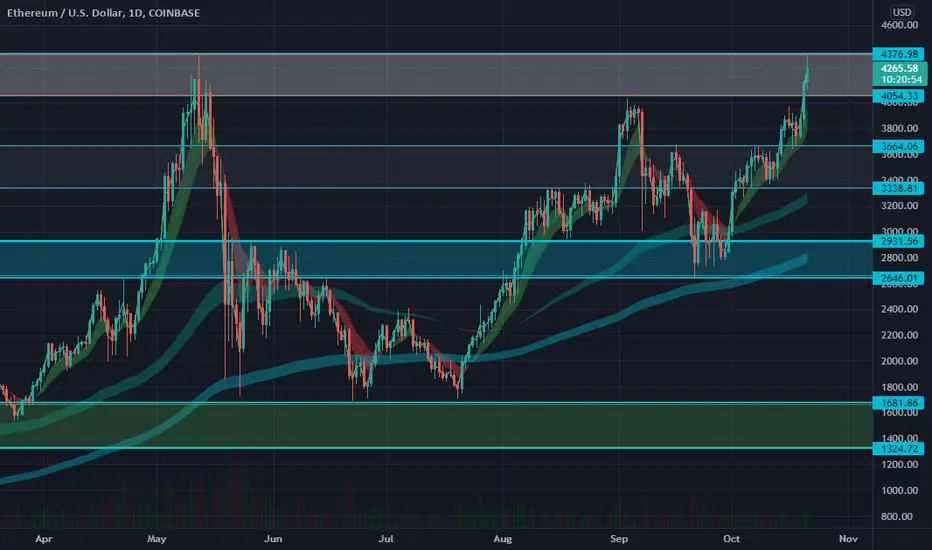
$ETH DAILY wow wicked last ath ZONE RIDERZONER RIDER SQUEEZE EM back at it again with supply and demand zones for u On $ETH //<3+
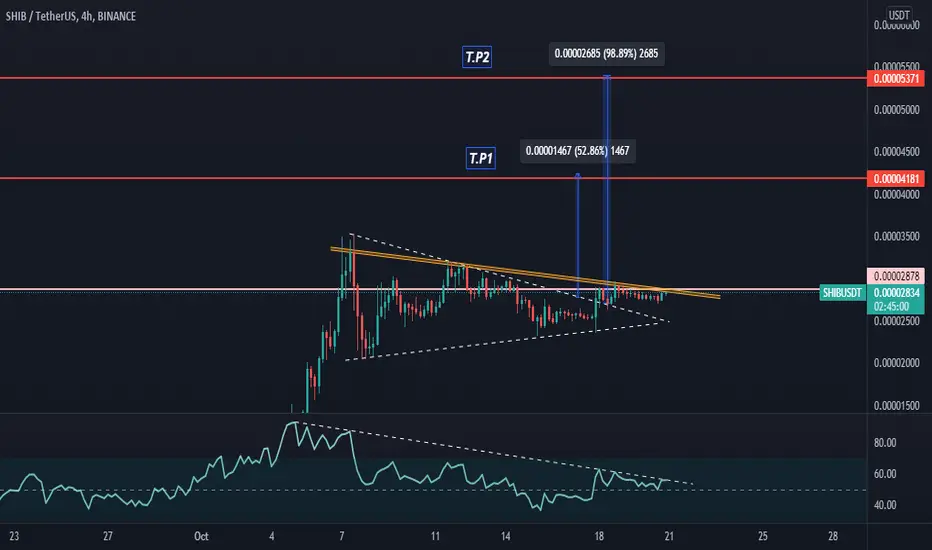
SHIBUSDT-Long Position-4HHi Crypto traders;
On this pair; price is getting ready for sharp impulse so after breakout we can enter to long for T.P1 and T.P2.
Do not forget to follow me and like guys.
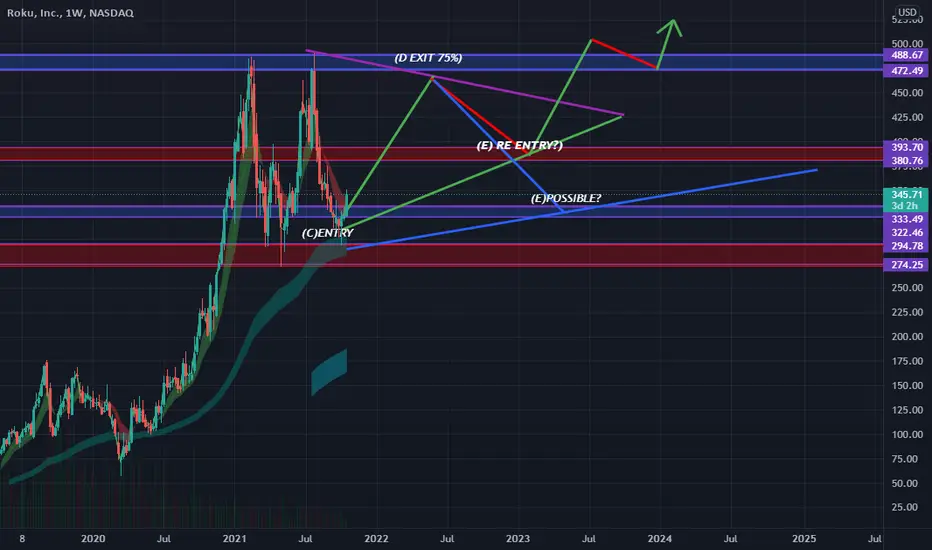
ROKU WEEKLY idea Supply & Demand zones.ROooKU SUPPLY & DEMAND + POSSIBLE WEEKLY Swing idea???? S/O PUPZ
EURAUD head and shouldersclear head and shoulder pattern on daily time frame
prices now at neck line
prices are also on trand line at the same time
waiting daily candle to close below the neck to confirm entry it should be below 1.5900
waiting daily candle to close is a must to confirm the pattern
please not going above 1.5930 this idea will be cancelled to reach the shoulders level again @ 1.6230
you can also place a buy stop at 1.5930
and sell stop at 1.5885

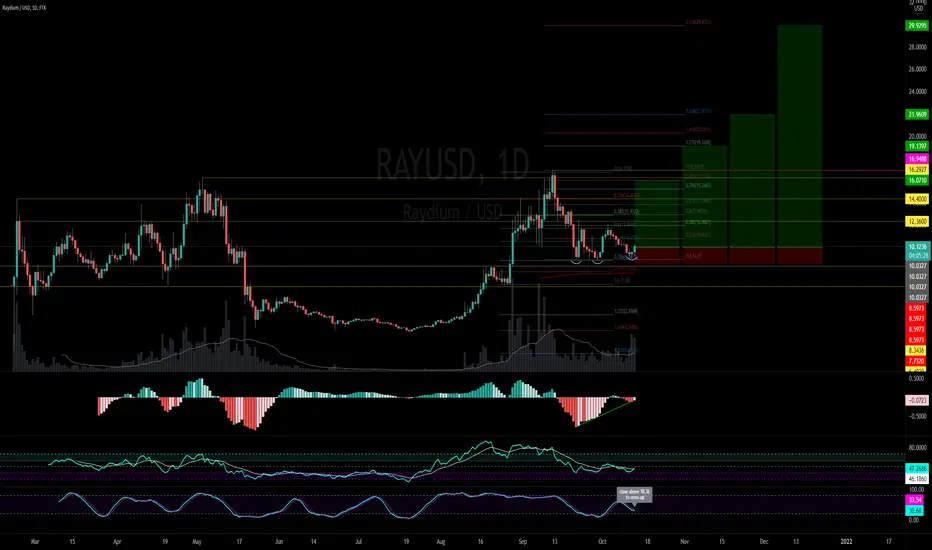
RAYDIUM could go nuclear!!!Raydium showin couple nice things on the Daily chart. Also on higher timeframes but i only focus on the daily in this setup.
Potential Cup and Handle (yeah it's in the room with us rn), with a higher low doulbe/triple bottom at a .786 retrace, class C bullish divergence on the MACD Histogramm, RSI and Stochastic at very favorable levels and the day will most likely close with a bullish engulfing candle.
For a trade the stop loss is placed below the previous low even tho the 200sma and major support levels are right below it, but this setup only works with a local higher low.
lets see :)

#TRU/USDT 📗 TLT (Trendline Touch) + S/R Break Confirmation 📈#TRU/USDT 📗 TLT (Trendline Touch) + S/R Break Confirmation 📈
4H Technical Analysis
⚪️ RSI: 56.20
⚪️ Stoch: 72.78
⚪️ MFI: 53.03
⚪️ CCI: 11.93
⚪️ WR%: -51.72
10 25 50 100 200
EMA: ❇️ ❇️ ❇️ ❇️ ❇️
SMA: ❇️ ❇️ ❇️ ❇️ ❇️
⚪️ ADX: 45.17
❇️ ADX Signal: +DI > -DI (Bullish)
❇️ MACD Bullish Crossover ON
❇️ Parabolic SAR: Bullish

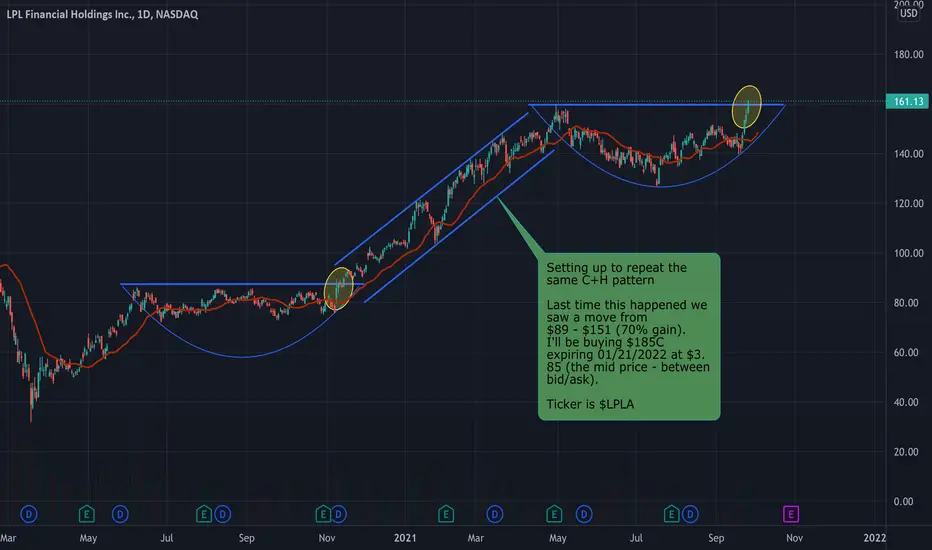
$LPLA - Cup & Handle BreakoutLPLA Analysis for potential C+H breakout.
Going long with January calls strike $185 looking for PT1: $200 PT2: $230
This could be a potential 1000% play.
bitcoin inverted cup with handle and head and shoulder scenario 1st: bitcoin inverted cup with handle
if holds the white line, high probability will form:
2nd: head and shoulder scenario if and when the white line of support holds and causes a 'right shoulder' from short covering.
stay tune to this 3 month play.
follow for more ideas and updates for invalidations and more
ready to big short term BTC i think really means that big short senario and get to drop down .
so i`m ready to short position and give great gane
share your ieade , i see and share comment with all
good luck

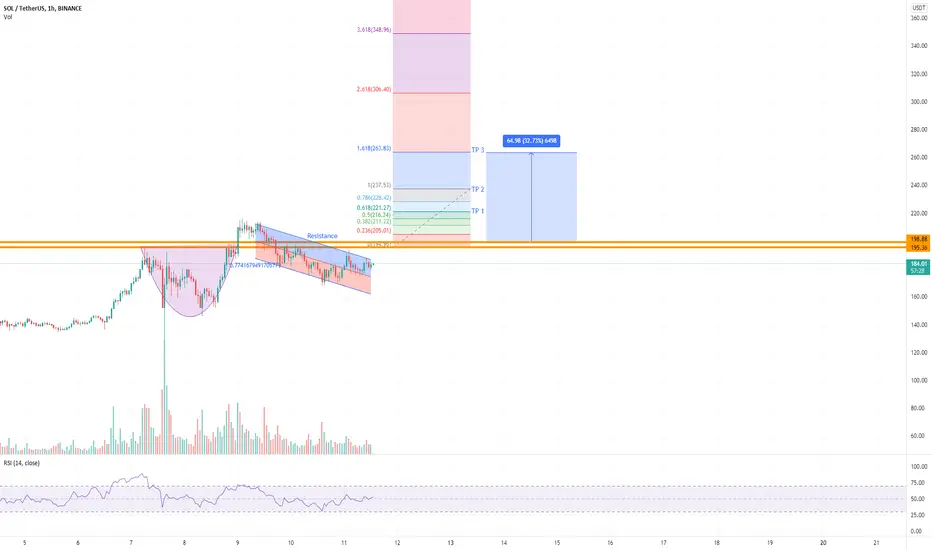
SOLANA CUP & Handle hourly timeframeCUP & handle solusdt spotted hourly timeframe. After resistance broken breakout to new ATH possibly.