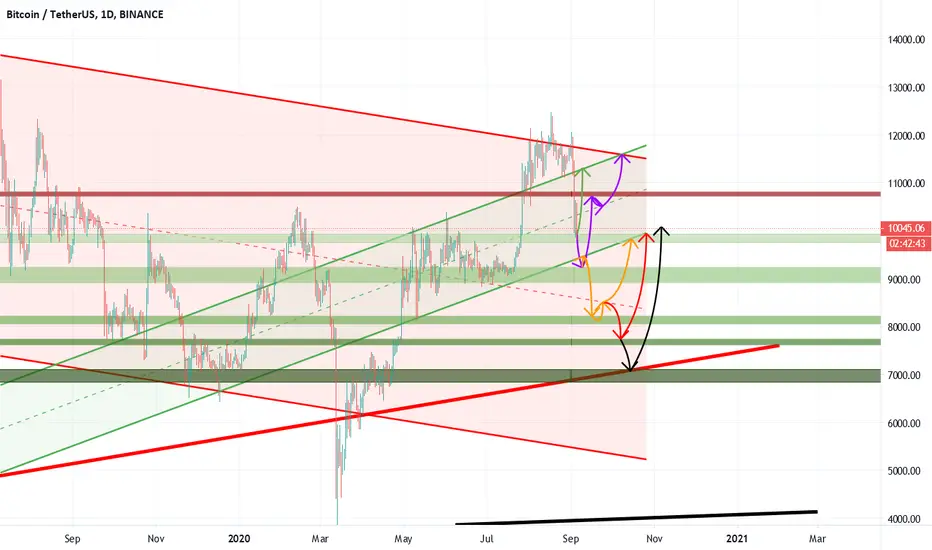
can BTC touch 7100$ ? maybe the worst senario!I try to use Fibonacci Retracement to find Support and Resistance then use Trend Lines and now i have 5 Scenario in different color!
I think the RED and BLACK is going to happen means 7700$ and 7100$ !!!
By the way if BTC go upward
First target can be 11300$
but if BTC go downward one of the 4 remain scenario can be ture
AND
BTC Head and Shoulders Pattern Opportunity to short!
BTCUSD graph formed a head and shoulders pattern which created opportunity to short.
I indicated the shoulders and head.
The minimum target is the vertical distance from the head to the neckline starting from breaking of the neckline.
Volumes are acting accordingly.
For BTCUSD, this is a good opportunity to short.
If you enjoy my graph, please make sure you like and follow. Your feedback will always be appreciated. Have a great day!

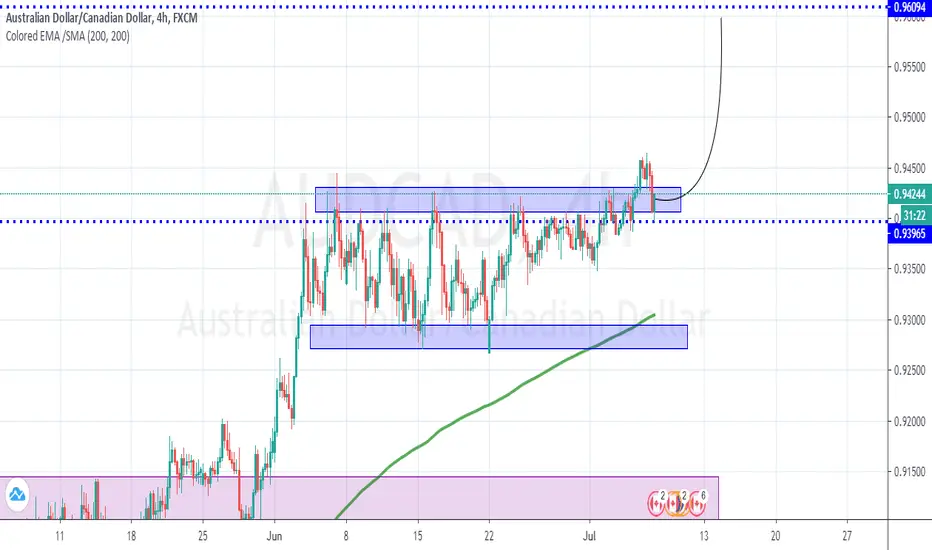
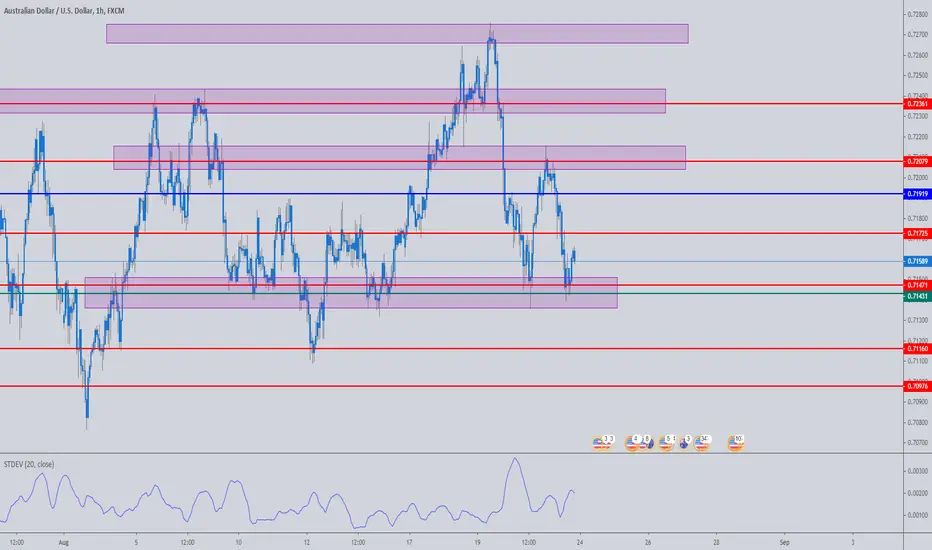
Long AUD/USDWait till price reaches demand zone. Let the price come to you and load on buy and scale to next supply zone.
Enter for the buy .71431
SL. below demand zone.
If anyone has any comments or criticisms-please share.
Thanks!
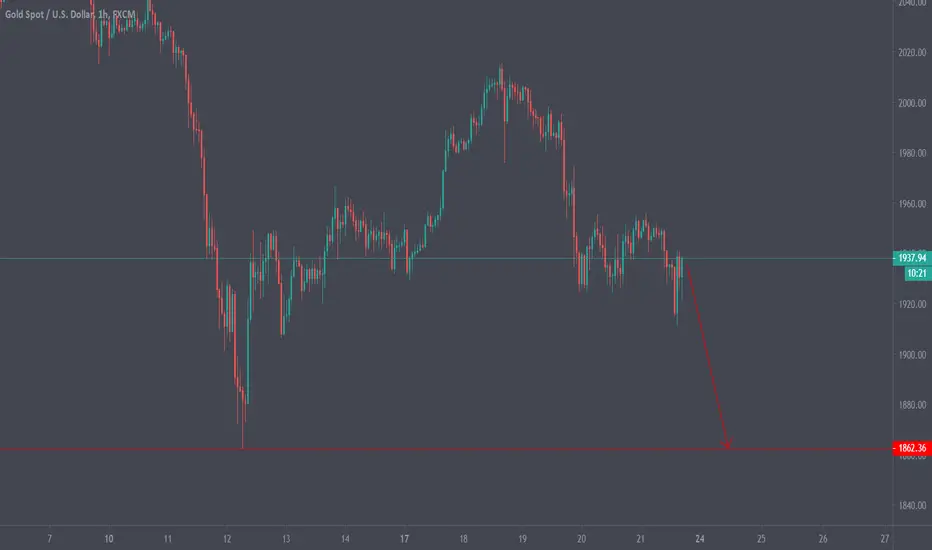
Gold - Easy head and shouldersHello everyone, as we can see he have a beautiful head and shoulders pattern that we have broke bellow the neck line. We also see divergence on the weekly and monthly timeframe, so a bigger drop is most likely going to happen, because we had way too steep surge and we needed such pullback. For now we should trade only the head and shoulders with the given take profit, because given the unstabillity of the economy, gold might aswell rise a lot in the near future especially during the elections. We can sell
now and place the stoploss above the right shoulder. Good luck to everyone!
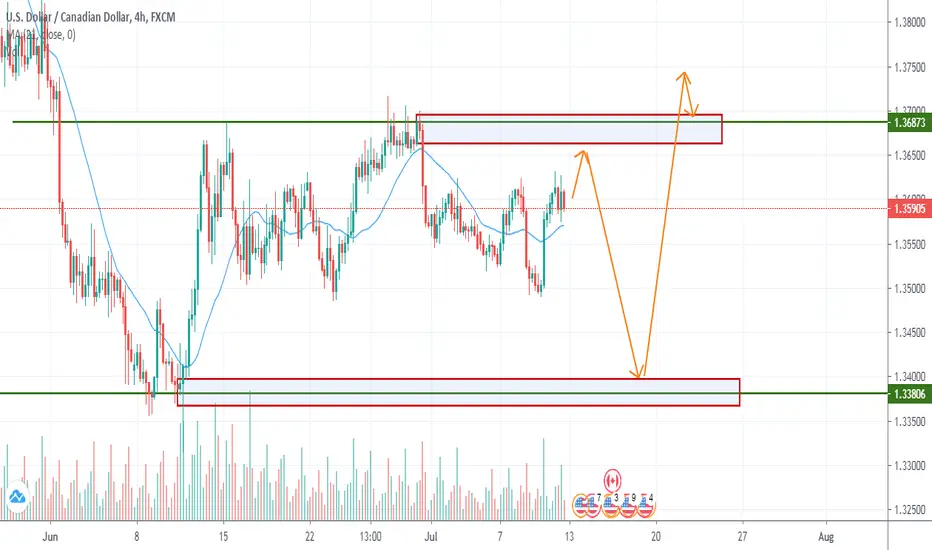
Euro Cad this trade needs the WTI h4 head&shoulder to breakoutIm watching the h4 head and shoulder on wti to breakout and retest to enter the ECAD long
Ecad near h4 support here also

Head and shoulders forming Possible head and shoulders forming in WB. I was expecting WB to rise with the large tech stocks but with the weak performance of most tech stocks other than AAPL recently I am afraid they will resume their downward pattern. They had a strong upward pattern since May but a Head and Shoulders is a bearish reversal pattern.
I'm not sure where to put the neckline could someone help me with that? My understanding is that it starts at the dip before the first shoulder than ends at the dip after the second shoulder (which hasn't formed yet so maybe we can't draw that in yet)
Appreciate any comments! Thanks

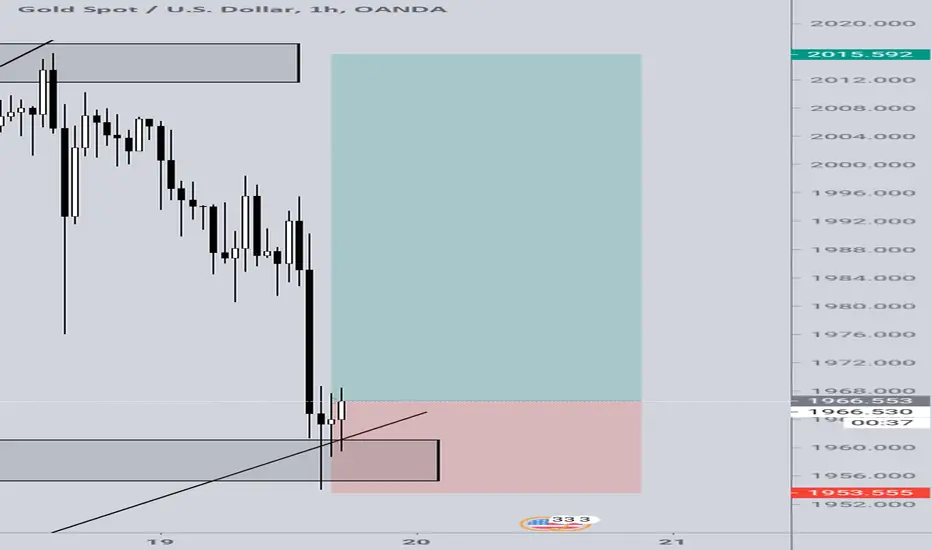
XAUUSD LONG NEW LONG POSITION, with every drop in a bullish market we look for longs.
cheaper price to go to new highs
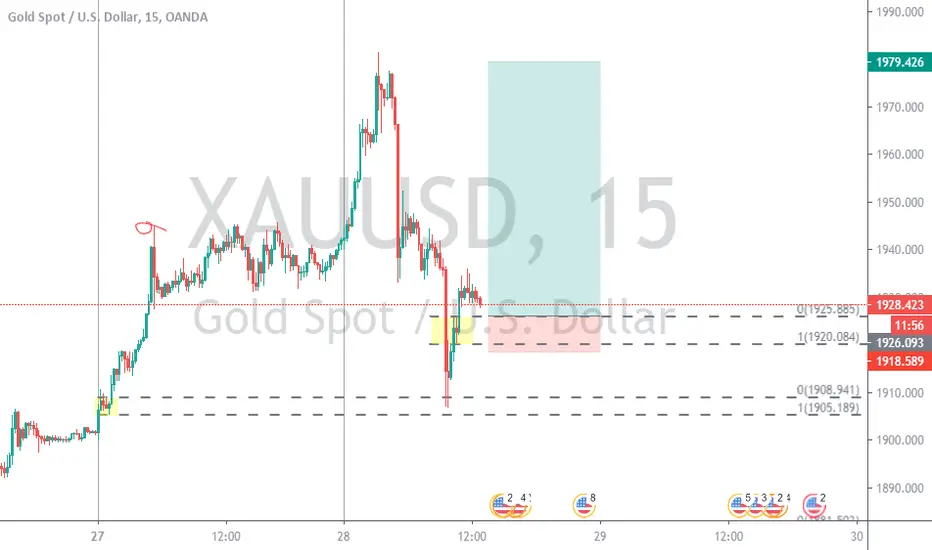
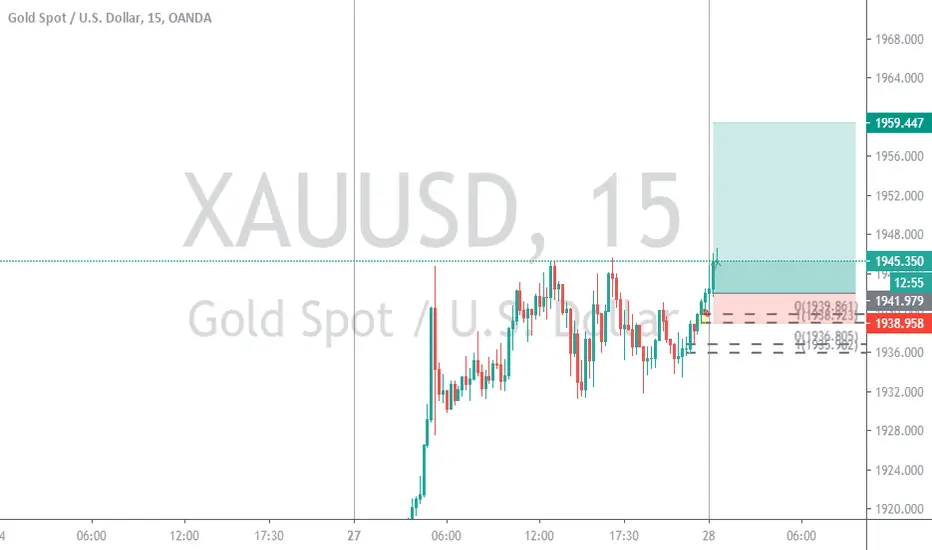
Gold Long continuationcapitalize on the gold rally from liquidity spots, at this point just finding demand and buying is best than continuously shorting a bullish market.
Roku Bullish C&H + Bull Flag patternsRoku Bullish C&H + Bull Flag patterns
Wkly & Dly bullish patterns

Carefully blaance your ability to travel to see loved ones.BEWARE OF LOUD IMPOSIITIONIONING VOICIES SEEKING TO BNKRUPT WHAT LITTLE YOU DO YOU HAVE LEFT. KEP THE FAITH AND STAY IN YOURT TRADIITIONS AND ART THT HAVE BEEN TIME-TESTED, RATHER THAN GOING INTO THE CITIES FOR "WEALTH" WITH NO PURPOSE
Always maintain a clear head. Do not let the mob tyrannize you. this is History being made.
Owens and Minor Long AFThis is a stock with strong fundamentals. There are a few key things about this one.The true bottom should be the 30 week MA at 4.50 and that would be amazing getting in at that price but... I feel like this stock has held up pretty well in the recent whiplashes in the S&P 500 and more importantly the 30 week moving average is pointing it straight up so I believe this will not drop any further. If it does, then capitalizing on the drop by buying it would make sense, assuming the market itself isn't taking a shit. Furthermore, you can see the MACD signaled this a few weeks ago, I love the MACD community indicator by ChrisMoody because it shows you a green or red blob when it crosses over. Then promptly after the MACD signal, the RSI crossed over on it's average and it's now centered. I think this stock has the momentum to push up rapidly in price. It's hard to say but around 13-15$ seems chill for a short term sell goal.

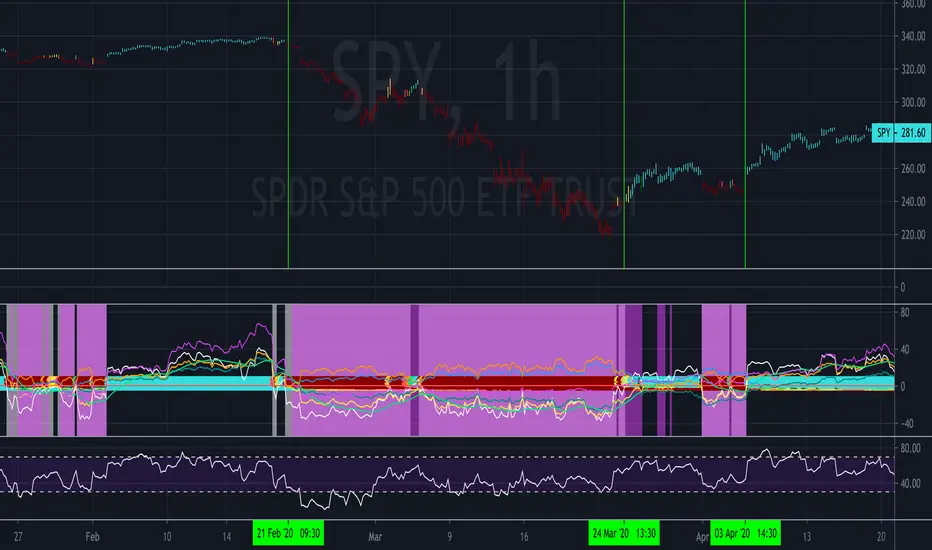
Chop Zone 10kIntroducing the Chop Zone 10k. This is an improved version of the Chop Zone 9000 and includes "RSI-like" lines but this is not RSI-- it's better than RSI. There are 5 lines and as the selling begins, 4 of the 5 split into positive and negative dualities, resulting in very hot "do not touch" look on the chart. If you do touch it while it's hot, you may get electrocuted! Real RSI at the bottom for comparison. This indicator would have gotten people out of the market as early as FEB 20th and back into the game on March 24th. I created this indicator to create trading as easy as possible. There are no special rules on how to use. It is also my belief that the tools made available to average traders are severely lacking because all of them require additional indicators to verify the signal. I am not sure if there is much else I can do with Chop Zone. This is pretty much as good as it gets.

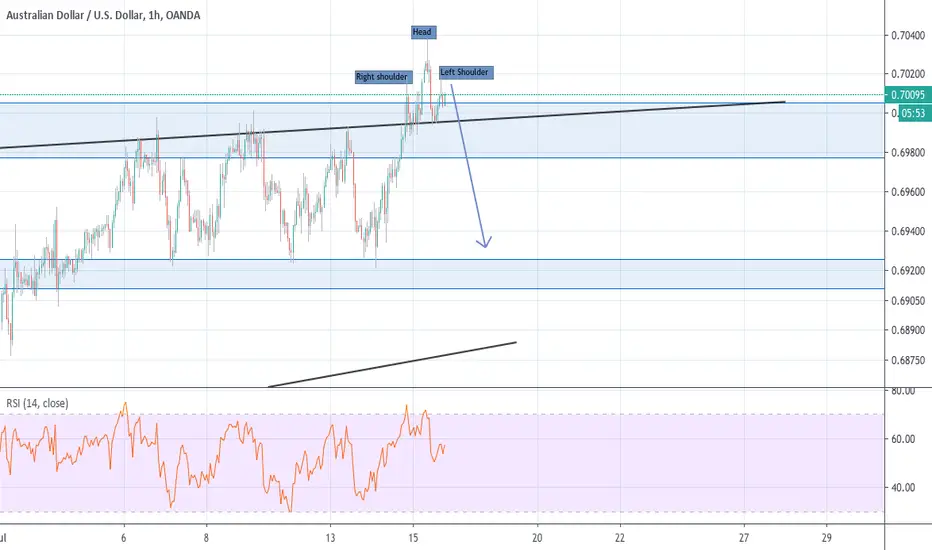
AUDUSDTF: 1 Hr
Possible small H and S forming on the 1 Hr. Could see some downside from here if the formation holds true.
nzdcad,SEll outlook A brakeout of valid trend combined with
an emerging head and shoulder pattern
risk: reward ratio is 2.49.

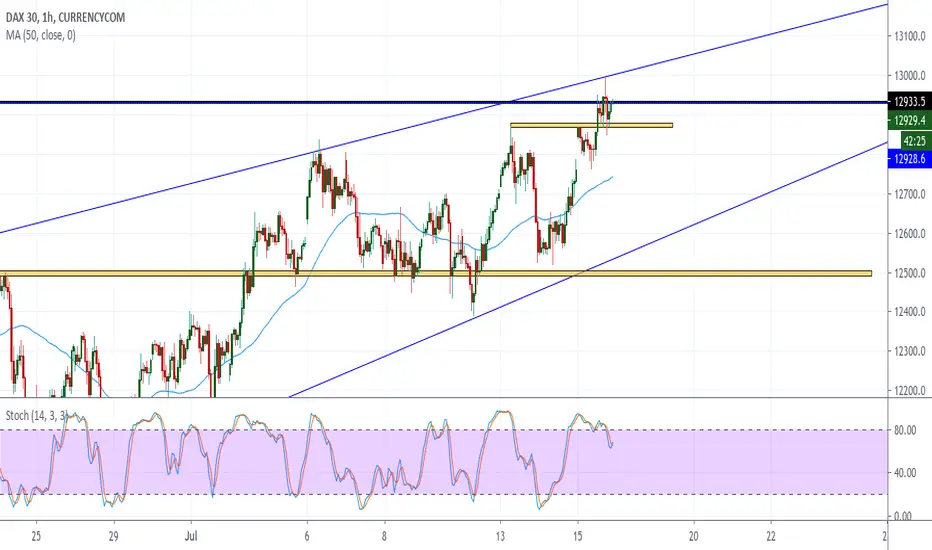
DE30 Index Trade Idea DE30 Trade Idea.
Currently price is bullish. Price has broken above the resistance level which now may slowly turn into a support level. Waiting for a possible retest of this level and a further confirmation before placing a buy trade.
However, price has also met the daily high level and we could see a possible trend reversal should price fail to continue its bullish run. Should such happen I will wait for a retest of the level as resistance as well as a confirmation and place a sell.
I also speculate a possible doji candlestick forming hence the trend reversal.
Minimum R/R - 1:1
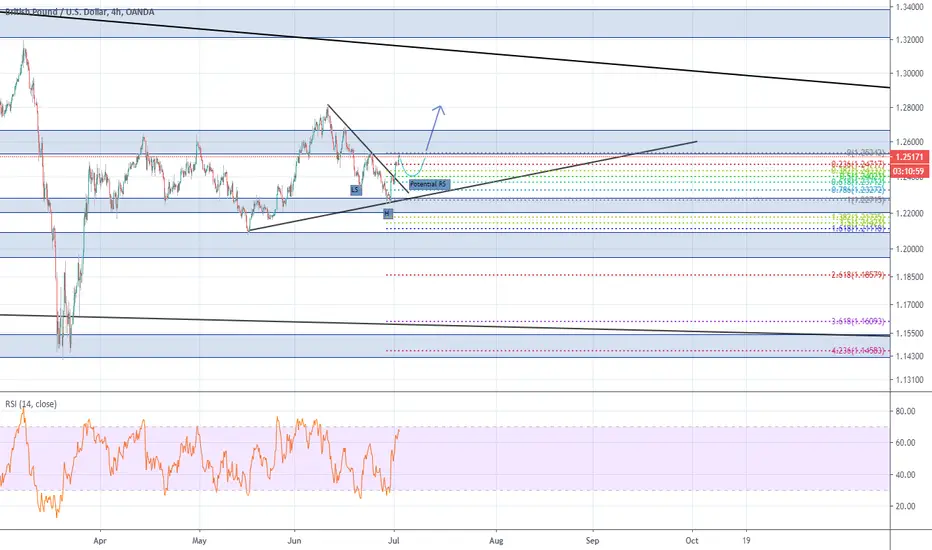
GBPUSDTF: 4 HR
Potential inverse head and shoulders pattern may be forming on the 4-hr TF. The potential retracement to make the right shoulder would align around the 0.382 and 0.50 levels making this a decent trade to the upside.