Cup & Handle Breakout on $TSLA after Gap fill today. $1,050 TGTHuge Mover and this cup from recent record highs had shorts expecting a big crash, but buyers have come in and institutions are buying as Analysts are finally catching on and raising their price targets. The crashed hard this morning with everything else buy buyers came in strong at the gap fill at $860 forming a bullish hammer reversal on the Daily chart. MEASURED MOVE OF THE BREAKOUT HAS $1,050 TARGET.
News broke right at close that the injunction that had been brought against their Giga 4 Berlin had been over ruled and that Tesla could Continue the build out... i'm always amazed how news like this breaks at the exact opportune moment.
Stochastic RSI also got to oversold and crossed bullish into the close.
Even if markets don't recover tomorrow, i still think we see a gap and go on the open squeezing these shorts to the point of the most recent high of $944.78, and then right after that is the all time high at $968.99. Past that and we could see $1,000 test very quickly, as everyone is expecting it to test $1,000 before taking a breather.
AND

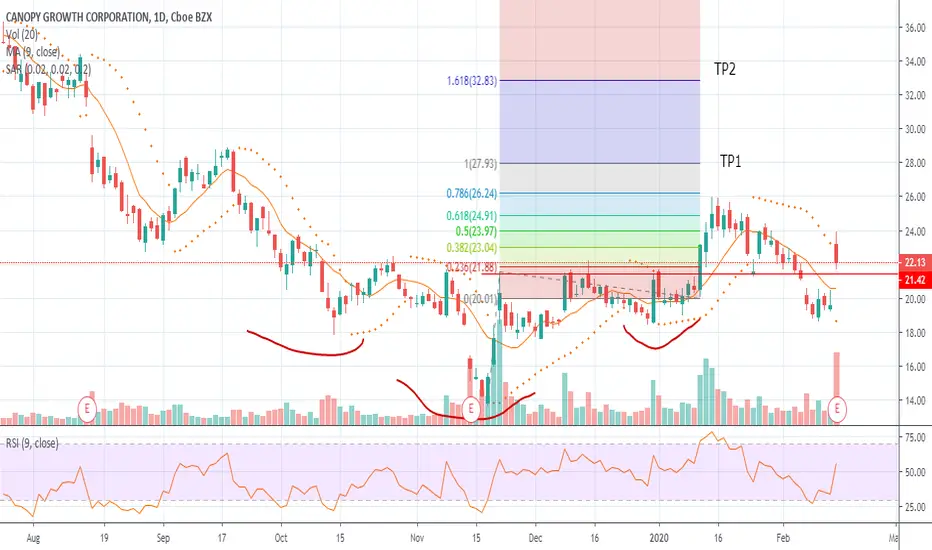
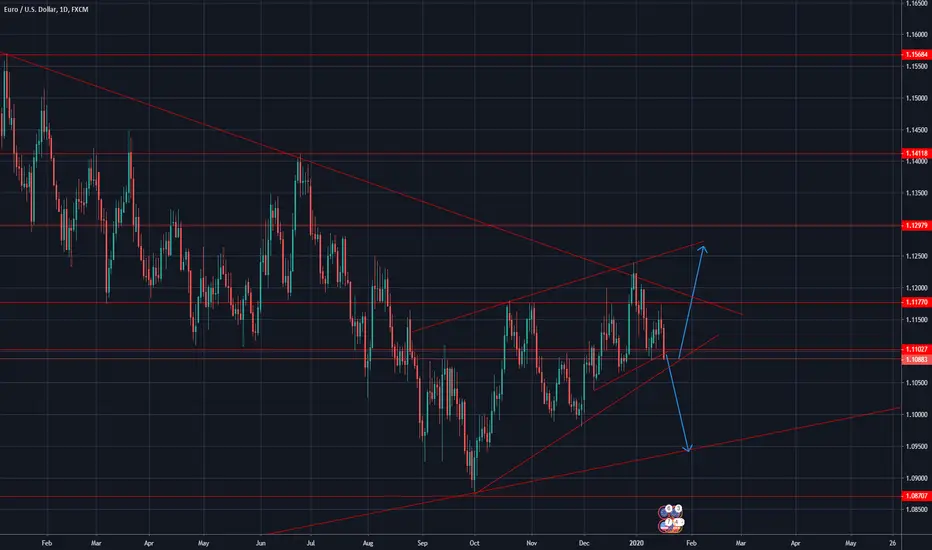
CGC -- INVERSE H & S -- A BUY CALLINVERSE HNS SPOTTED. THE NECKLINE SHALL BE RETESTED AND THE PRICE SHALL FLY TO TP1 (1.0 FIBO) AND NEXT TP2 (1.618 FIBO).
Marico Near Long time SupportMarico Trading Near Long time Support, Wait for Clear breakout Long move after breakout. Bull Don't trade bollow average line. Up Move Possibility high.


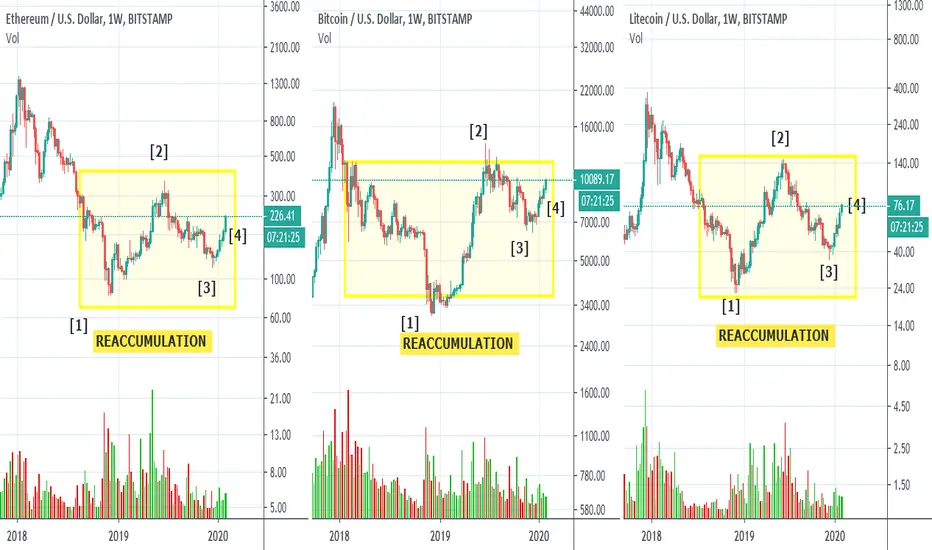
Altseason? Yes. Cryptos are in the beginning of a new bull cycleLong term view . ETHEREUM.BITCOIN. LITECOIN. Three major cap crypto assets: accumulation structures complete.
It’s time to zoom out and focus on the big picture . All the major caps have finally confirmed their accumulation structures.
Let’s review the price history of the last two years in the crypto ecosystem.
The first signs of institutional value buying after the spectacular 2017 bull run came in the second half of 2018 (1) .
Demand is consistent on the aggressive rally at point (2) , suggesting strength.
The reaction (3) is an important clue. The downmove is very laborious, and volume is decreasing.
It’s just take profit after the quick run. The Composite Operator is not actively selling. We have analyzed these structures and
discussed the bullish scenario at the Best of Wyckoff Conference in early September.
However, Wyckoffians do not chase the trend and wait for confirmations.
The confirmation of the reaccumulation structures comes finally in January at point (3 ).
The laborious reaction has produced a higher low on low volume, a very bullish sign.
Supply has been absorbed. Price quickly rises on average demand (Ease of Movement to the upside) (4) .
The double bottom formation on Ethereum and Litecoin is complete.
Highly volatile assets like cryptocurrencies generates huge PnF counts in relatively shorts period of time. A two year
reaccumulation in this asset class is a major event that suggest that we are at the beginning of a major bull run
reminiscent of 2016-2017 . We will post accurate PnF counts for all big , mid and small caps in the next reports.
Full analysis available for free Weekly Crypto Report here www.wyckoffanalytics.com
Weekly Crypto Report:
This week: The big picture. Cryptocurrencies are in the beginning of a new bull market. Long term analysis.
Weekly Review: Bitcoin, Ethereum, Litecoin, Ripple, BSV
Question: Altcoin/Bitcoin outperformance (Alt-season) & PnF Charts.
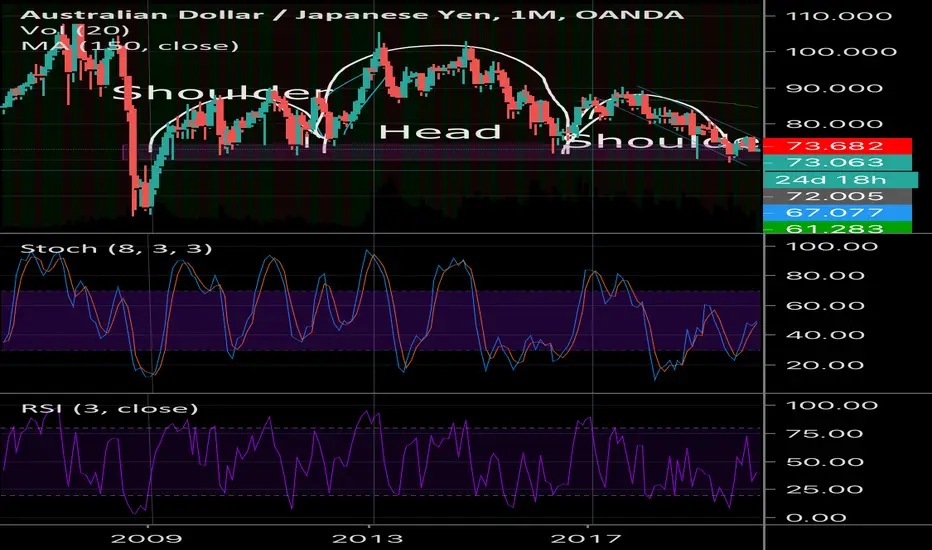
AUDJPY SHORT (LONG TERM TRADE, 1M)Head and shoulders forming. Still a ways away to go for a breakthrough as it is the month view, but a downward channel ending one of the shoulders is a good sign. Do not sell yet unless you believe it’s a good idea

Head & Shoulder Pattern Using Mondays Candles Set UPThis is based on mondays candles which are boxed in the coloured boxes the break out of the zone indicates the head as shown.
Then we had a 100% retrace back to the bottom of that Monday zone creating the neck line.
Then the market moved back towards the opposite creating the right shoulder its right about on the support of the left shoulder i expect this to now be in a buy position and possibly move for a 30 to 50 pip movement

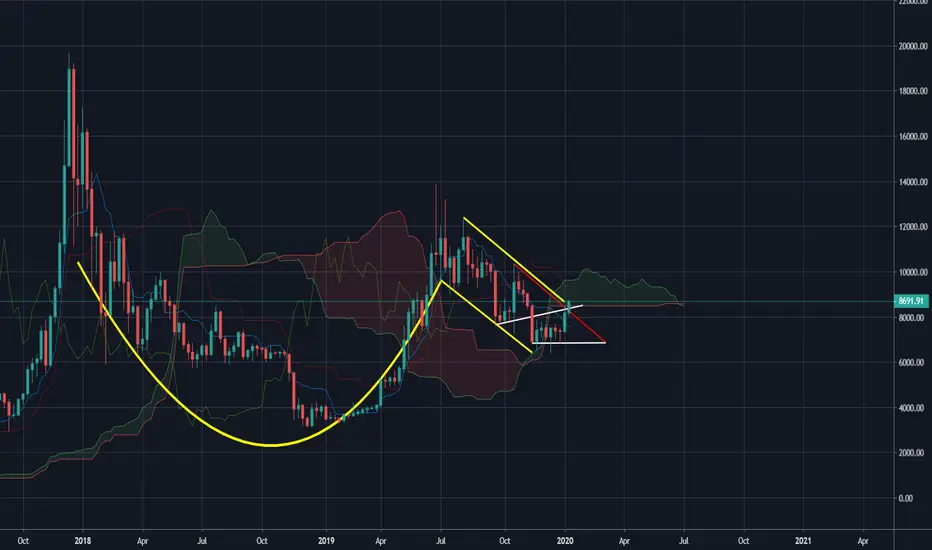
Massive C&H pattern in weekly chart?Hi traders and crypto friends, it´s BohemianCrypto,
I´ve found out very interesting C&H pattern in weekly chart. Before halving I expect uptrend move in ichimoku cloud between lines, but atleast to 10k. Then I expect fall to present price till autumn.. What´s next we will see..
Let me know what do you think about my idea, I´m new in cryptos.
GBPCHF - Big drop ahead!Hey everyone, we should start off first with the fact that we broke major support. This shows a lot of weakness for GBP. We have also formed Head and Shoulders that we broke the neckline of, so the pattern is valid, meaning we will see a drop as big as the distance from the neck to the top of the head. We have a few support levels, that hopefully we will break, but taking profits on each of those won't hurt. Good luck!

AMZN - consolidating and looking for momentum to come backAt this level I'm cautiously long. I see this price action as consolidation for the next leg up. Momentum has faded substantially on the hourly charts, but we still look strong on the daily timeframe.
In my previous update (linked) I mentioned $1917.51 as an important level. Its the first level I'm watching today followed by $1925.56 which is a historic level that price reacted around. Once we break through that, my sights are set on $1942.56.
We've had a good jobs report, which should keep us bullish but we could still easily see a dip at open. The levels I'm watching are $1894.89 (strong) followed by $1884.00. I don't think we get lower than that today, but it's always possible to see an excessive dip, if that happens I'm watching the volume node at $1874.47 level. Below that, and we need to step aside and re-evaluate.

GBPAUD Potential Head and ShouldersEarly entry on this because bearish engulfing candle on weekly chart. I'd like to see GBPAUD close the week below 1.9080, which is about the 50% retracement of that weekly engulfing candle.
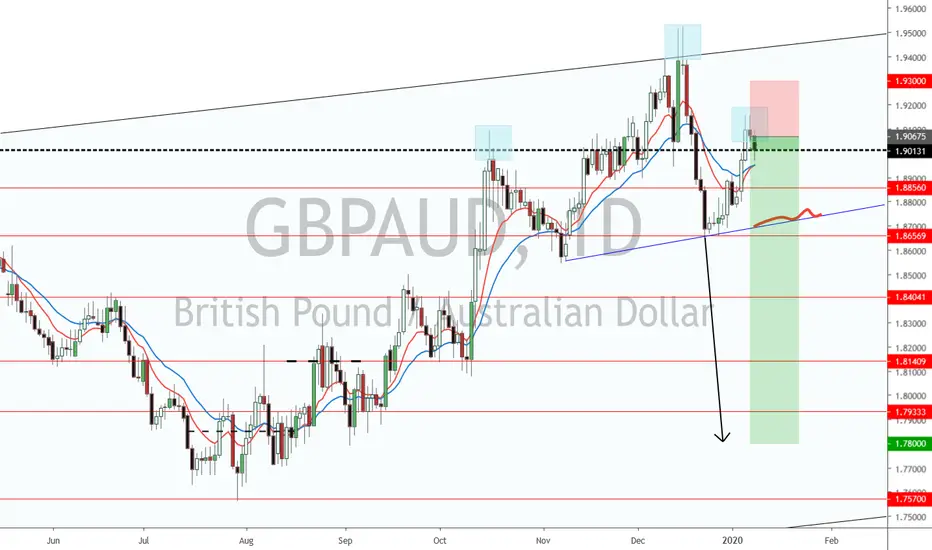
GBPAUD - Great set up for short!As we can see we are at the potential top of the right shoulder and we see huge divergence, so this is a great signal, that we could be seeing the other arm forming. This trade is great, because you can short now with really tight stop loss for a potential risk/reward ratio of 13
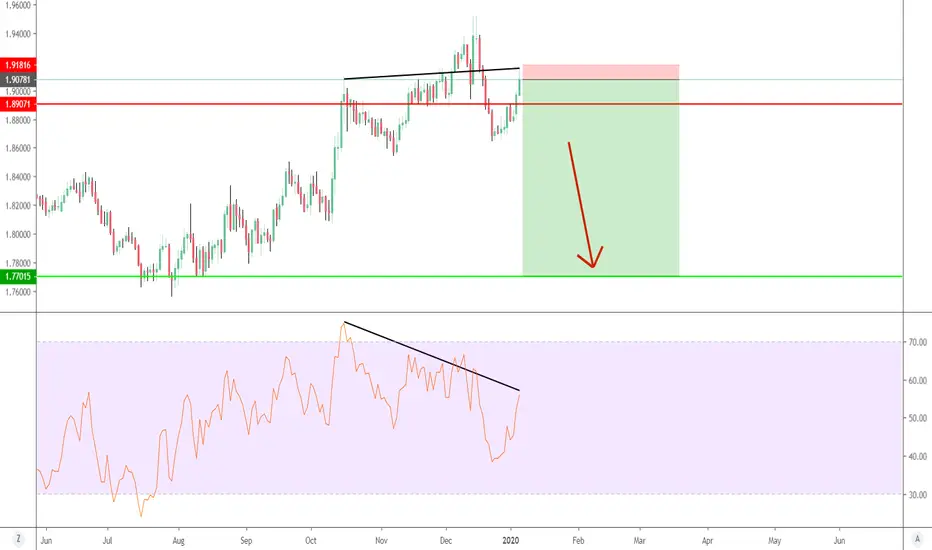
GBPAUD - Learn From Our History!As we can see, we have the same pattern forming up as we had not long time ago and we saw how good it played out! We have another amazing opportunity to execute after the breakage of the neck line of the possible Head and Shoulders. We have a divergence to support the theory, that the Sellers have the upper hand, so get ready for a nice short soon!

NZDJPY - Potential Head and ShouldersAt the end of the week we could potentially be seeing HS pattern which would give us the opportunity to short with great risk-reward ratio. Trade only after the forming of HS and when it breaks bellow the neck as I have shown in the idea.
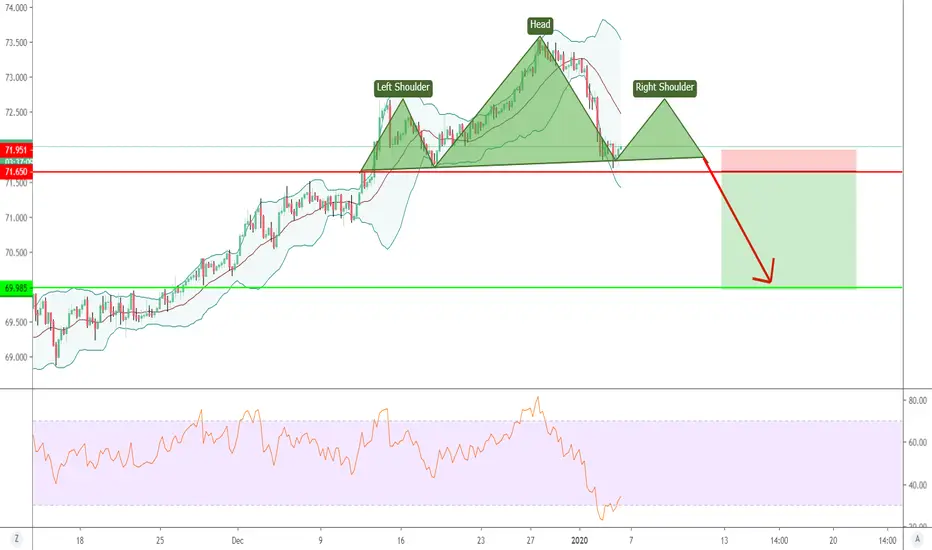
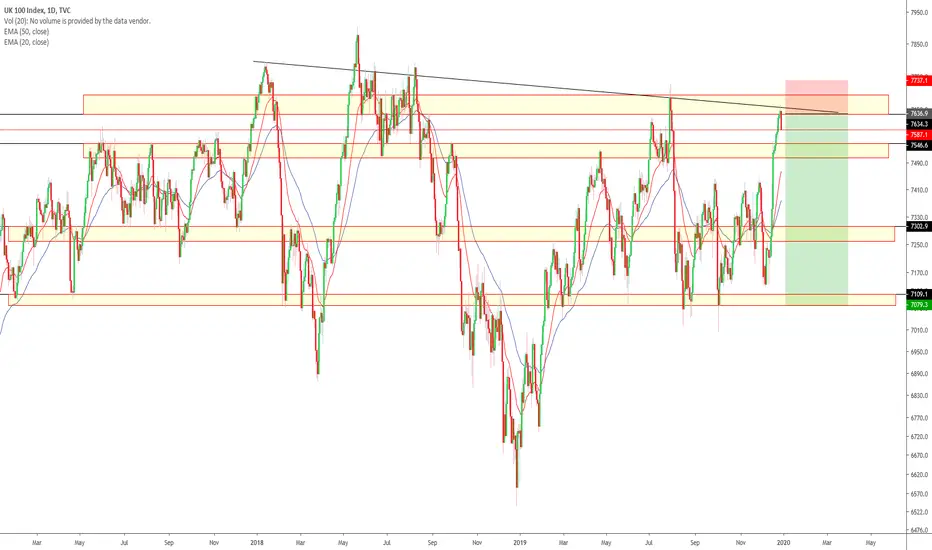
FOOTSIE 100 POTENTIAL SELL!GOOD AFTERNOON TRADERS, ITS GOOD TO BE BACK! HERE WE HAVE A POTENTIAL SELLING OPPORTUNITY ON THE UK STOCKS. THE CURRENT DAILY PRICE ACTION IS A BEARISH ENGULFING AND IF FINISHES THIS WAY WILL CONFIRM ENTRY BUT I'D STILL LIKE MORE FROM CANDLES FOR A STRONGER CONFIRMATION. IT HAS MULTIPLE CONFLUENCES FROM A TECHNICAL STANDPOINT TO BACK UP THE SELL AND ACCOMPANIED WITH A GREAT RR. FROM A FUNDAMENTAL STANDPOINT UK STOCKS HAVE BEEN RALLYING AND HAS HAD A LOT OF BULLISH MOMENTUM PARTICULARLY IN THIS STOCK. SUCH AN IMPULSIVE MOVE UPWARDS IMPLIES A LOT OF VOLUME AND BULLISH STRENGTH SO TAKE IT EASY WITH THIS ONE AND USE UNDER 1% RISK AS COULD STILL CONTINUE TO RISE.
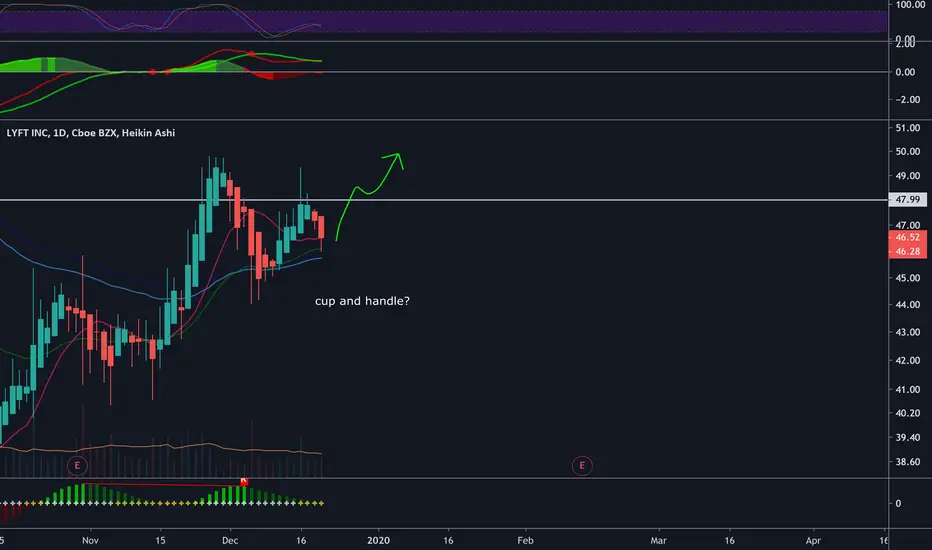

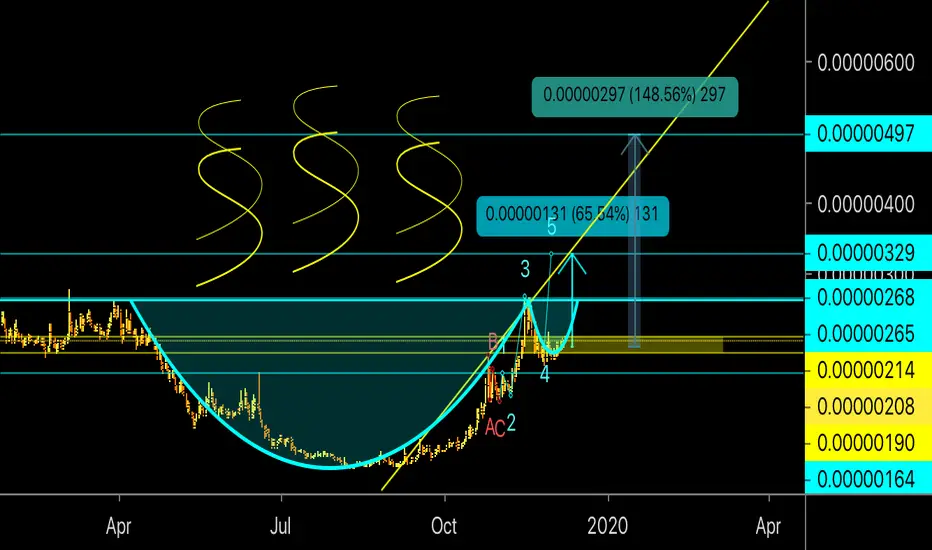
First post - Cup&Handle pattern? Hi traders and crypto friends, it´s BohemianCrypto,
after months watching and learning i decided to publish my fist idea. It´s not trading advice, I´m still waiting for market to decide, but I see obvious Cup and Handle pattern which i have not seen published by anyone else here...
So my question is what do you thing? Do you see the same in short or am I basically outside the bowl?
Marry Christmas and may the force be with us next year.
Cheers

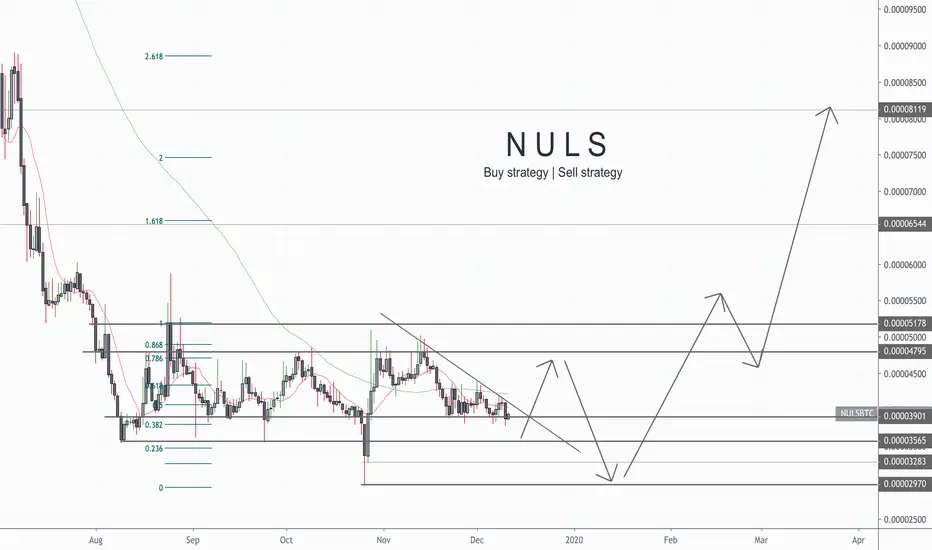
NULS / Bitcoin | Buy and Sell StrategyPrice going in Sideways channel. We can follow up prices and buy near supports, which I will use as buy strategy
minor support 3900 (15% of position size)
major support 3500 (50% of position size)
Additive support levels at 3290 and 2970 (rest% of the position size)
Place stop loss orders exactly near supports to avoid loss.
For sell, I will follow resistance zones at
4700 (50% of position size) and 5100 (30% position size)
If more flow will come I will keep about 20% of initial position for next resistances at 6500 and 8100.
Lend is forming a Cup&handle pattern!Clearly made it and heading to achieve high targets
• neck line price is a short term target
• second line price is the mid-term target
• highest price line is a long term target
Follow us in Twitter for more updates!