BTCUSD (H1) Buy again!
BINANCE:BTCUSD
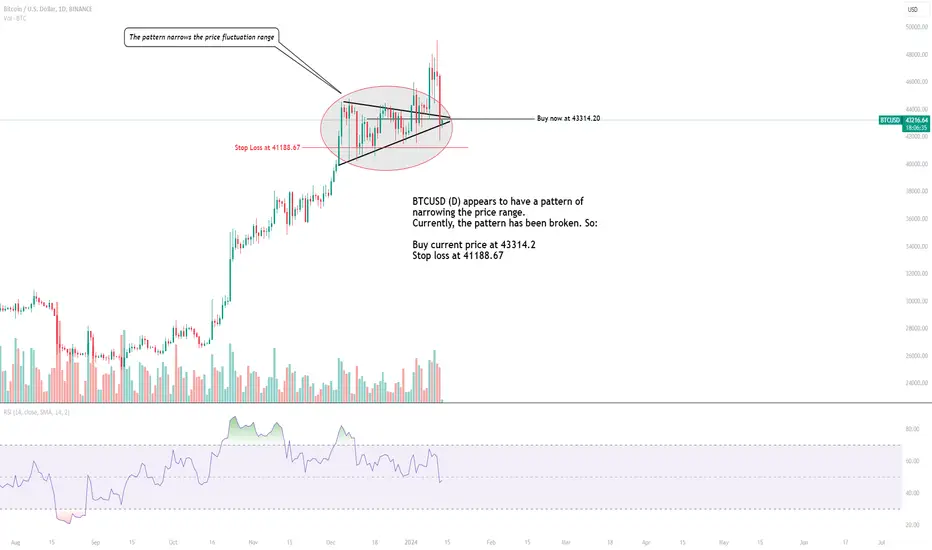
BTCUSD (D) appears to have a pattern of narrowing the price range.
Currently, the pattern has been broken. So:
Buy current price at 43314.2
Stop loss at 41188.67
AND
BakeryToken BAKE Coin Price Prediction🔥 Price on the 4H chart might come at these support area and we might get a potential bounce🔥
Potential bounce areas for Buying 0.5723 and 0.4770 and 0.3704
👉 Follow me for More Real Time Opportunities.
Share your Thoughts if you have any?

Moonriver MOVR Coin Price Prediction🔥 Price on the 4H chart might come at these support area and we might get a potential bounce🔥
Potential bounce areas for Buying 24.705 and 11.324
👉 Follow me for More Real Time Opportunities.
Share your Thoughts if you have any?

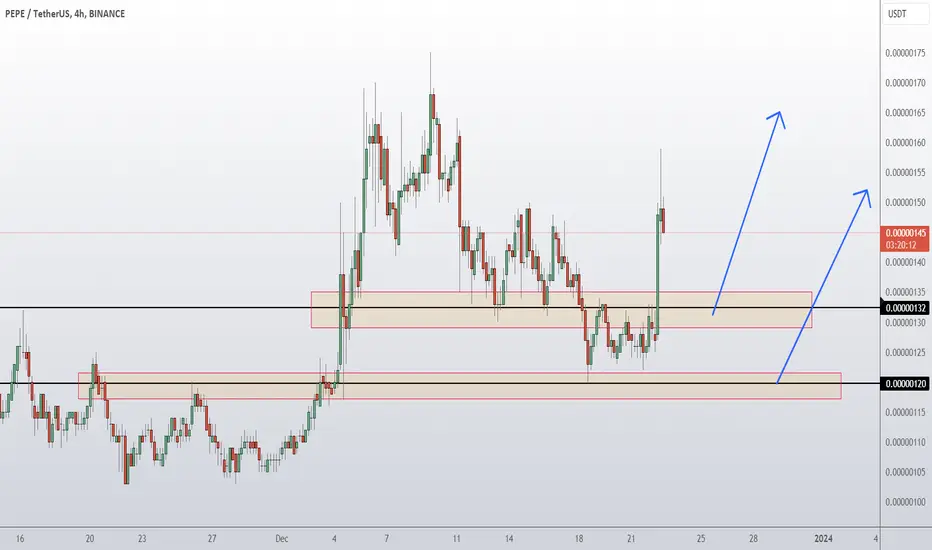
PEPE Coin Price Prediction🔥 Price on the 4H chart might come at these support area and we might get a potential bounce🔥
Potential bounce areas for Buying 0.00000131 and 0.00000119
👉 Follow me for More Real Time Opportunities.
Share your Thoughts if you have any?
Bonfida FIDA Coin Price Prediction🔥 Price on the 4H chart might come at these support area and we might get a potential bounce🔥
Potential bounce areas for Buying 0.3556 and 0.2879
👉 Follow me for More Real Time Opportunities.
Share your Thoughts if you have any?

Moonriver MOVR Coin Price Prediction🔥 Price on the 4H chart might come at these support area and we might get a potential bounce🔥
Potential bounce areas for Buying 8.235 and 6.067
👉 Follow me for More Real Time Opportunities.
Share your Thoughts if you have any?

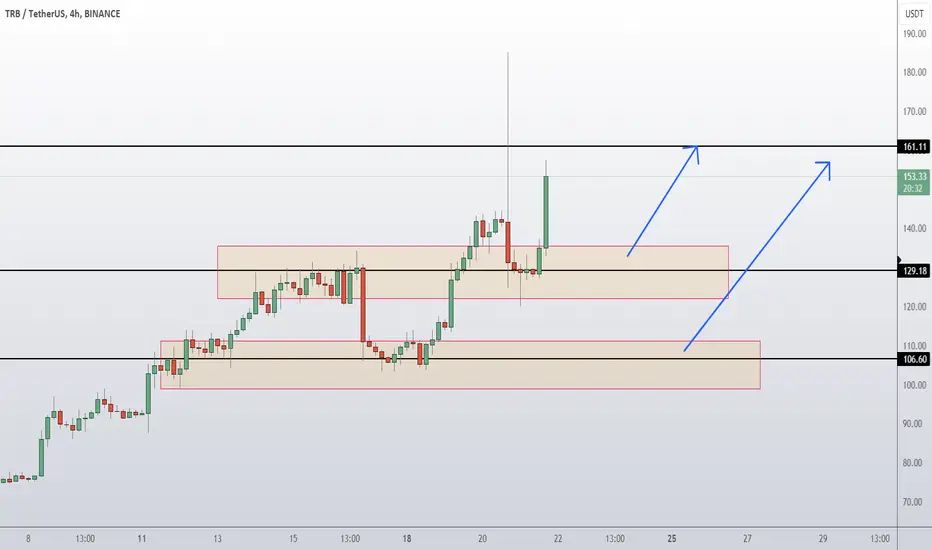
Tellor TRB Coin Price Prediction🔥 Price on the 4H chart might come at these support area and we might get a potential bounce🔥
Potential bounce areas for Buying 127.18 and 104.50
👉 Follow me for More Real Time Opportunities.
Share your Thoughts if you have any?
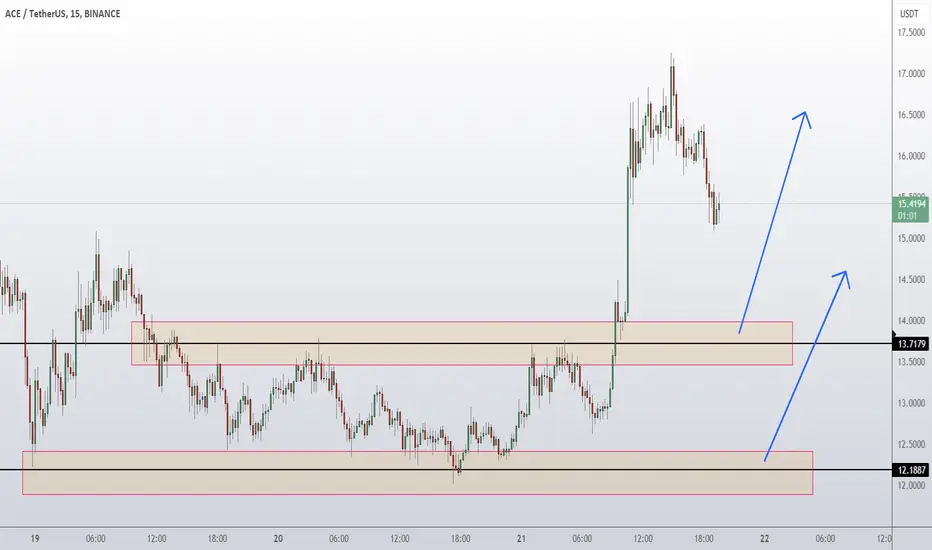
Fusionist ACE Coin Price Prediction🔥 Price on the 15 MIN chart might come at these support area and we might get a potential bounce🔥
Potential bounce areas for Buying 13.6654 and 12.0724
👉 Follow me for More Real Time Opportunities.
Share your Thoughts if you have any?
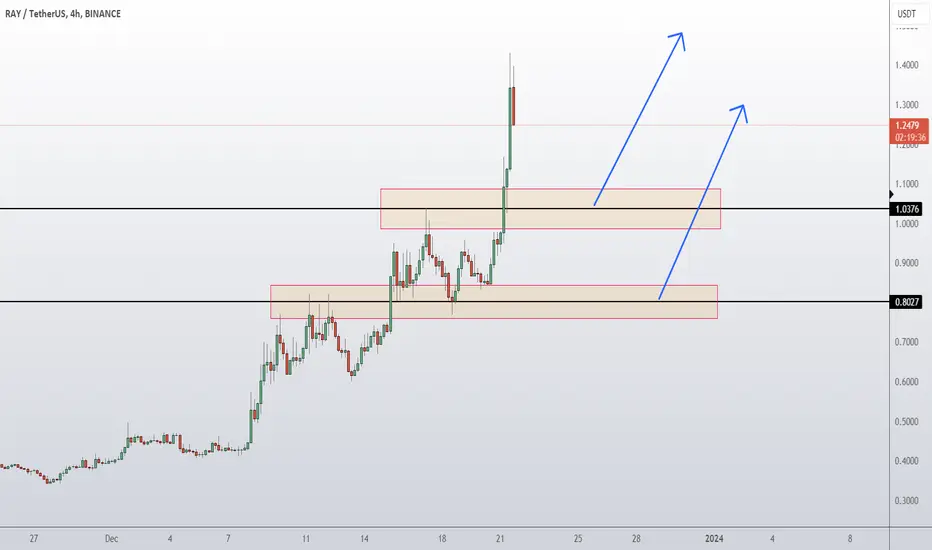
Raydium RAY Coin Price Prediction🔥 Price on the 4H chart might come at these support area and we might get a potential bounce🔥
Potential bounce areas for Buying 1.0229 and 0.8194
👉 Follow me for More Real Time Opportunities.
Share your Thoughts if you have any?
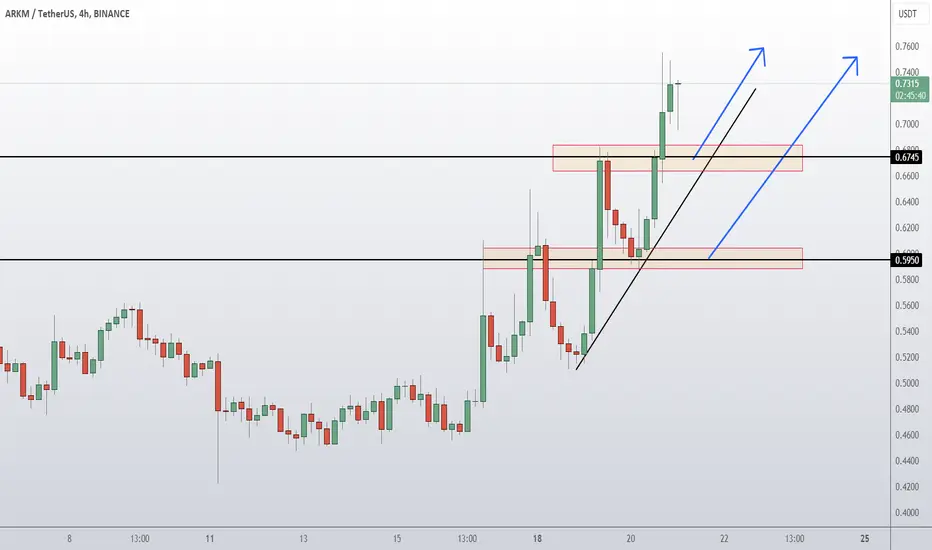
Arkham ARKM Coin Price Prediction🔥 Price on the 4H chart might come at these support area and we might get a potential bounce🔥
Potential bounce areas for Buying 0.6713 and 0.5982
👉 Follow me for More Real Time Opportunities.
Share your Thoughts if you have any?
Gold (XAUUSD) Update Next Week 18-22 Dec23 The market seems poised for a period of consolidation, suggesting a sideways movement before a potential directional shift. During this phase, support is anticipated around 2010 - 2007, and a retracement could lead to a brief upside towards the resistance at 2028 - 2030. The market currently aligns with a green chart pattern, showing a possible resistance followed by a descent to 2000 - 1995 for Target 1, and further down to Target 2 at 1975 - 1960.
Other side, If market successfully breach its resistance levels of 2030 - 2033, as indicated in the buying zone, an upward trajectory is likely possible. This could result in reaching the Target 2050 - 2060, with a subsequent move towards 2090. Monitoring the market closely is crucial to identifying whether it will adhere to the consolidation phase or exhibit a breakout in either direction.

EUR/CHF ⬆️ Long Trade setup ⬆️Hello Everyone.
Head & Shoulders
💲 Entry Point : 0.94737
🟢 TP 0.95489
🔴 SL 0.94361
Please support us with like & comment & Follow
Disclaimer
---------------
Trading is risky we all take loses
your responsibility is to not take more than 1% to 2% loss per trade and double your profits.

Gold Update Next Week 11-15 Dec23Hello traders ,what do you think about GOLD? The price of gold is fluctuating between this range. From a technical point of view, there's an anticipation of a potential decline to the designated level of 1990, followed by a subsequent range of 1975-1965. feel free to express your support through likes and comments. ❤️

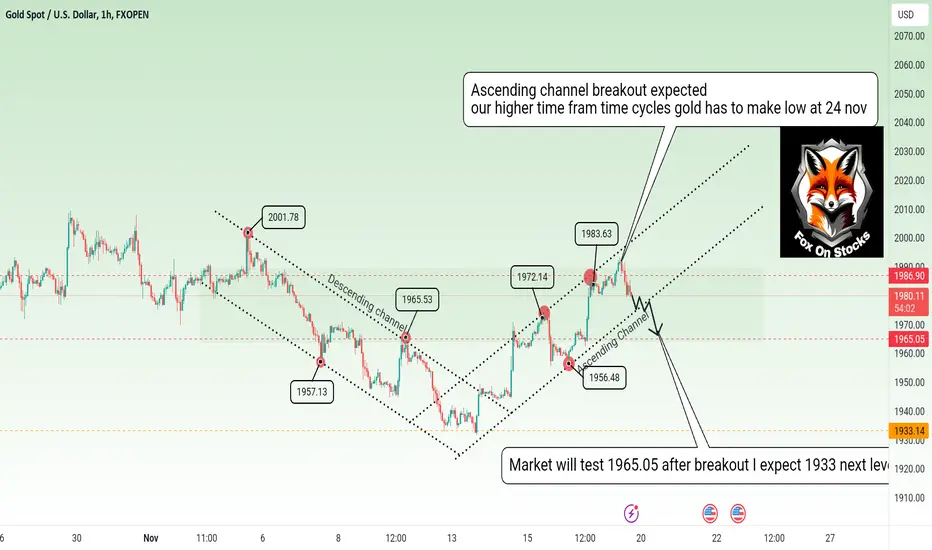
XAUUSD TECHNICAL ANALYSIS 4Hrs TF looking at the current situation it makes perfect sense why Gold has been consolidating since yesterday. We are above a trendline and below a resistance.
Knowing that gold couldn't hold the breakout from Monday this shows that the market has shifted hands and now the bears are in charge...this is my perspective and approach I am not advising anyone to trade like me I'm simply sharing my chart ✌️
What a Clean Breakout. @BEML. BEML was up almost 8% up today showing a strong rise with huge volume support.
It not only broke the resistance but also closed above it.
I've tried my best to PIN DOWN Entry, Accumulating Zone, Stop Loss, Target.
Hope you will find it worthy of your attention.

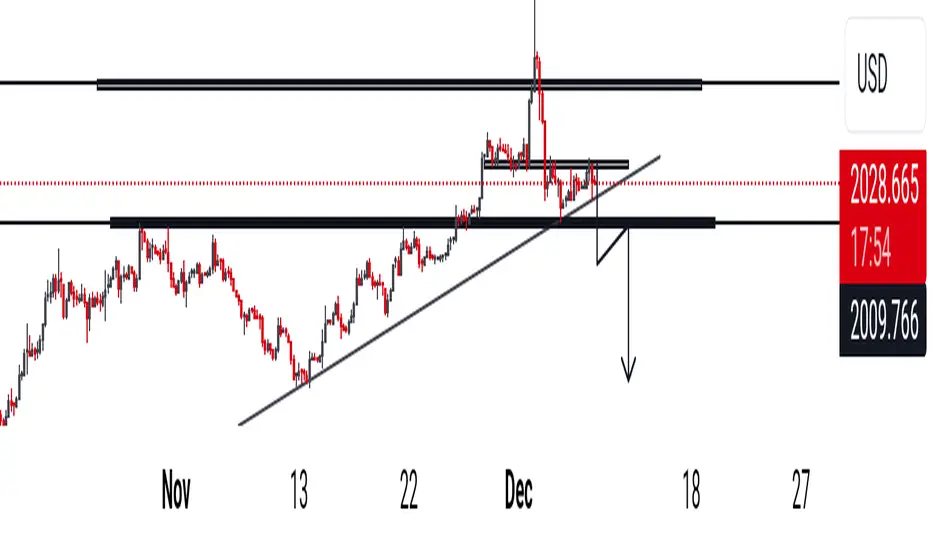
GOLD Towards 1924 Gold has already retested the 1990 area. Now, we anticipate a decline towards 1924 in the coming days. If any daily candle opens above 1992, we will reconsider selling. Currently, we observe significant bearish moves. I have posted a lower timeframe, providing insight into the ascending channel. I am awaiting a breakout; once it occurs, gold will be in our favor.
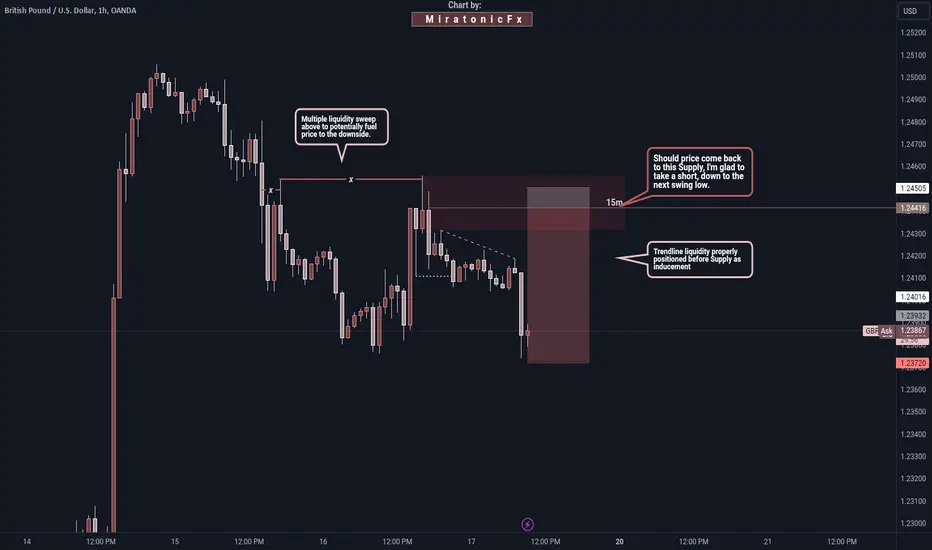
GBPUSD 1h Potential "Short"Hello friends!
I don't actually trade GBPUSD, but I think this can be a good entry if price dares to return sooner.
PNG chart image:
Plan for 16th November 2023 - EnglishNifty future and banknifty future analysis and intraday plan in ENGLISH
This video is for information/education purpose only. you are 100% responsible for any actions you take by reading/viewing this post.
please consult your financial advisor before taking any action.
----Vinaykumar hiremath, CMT

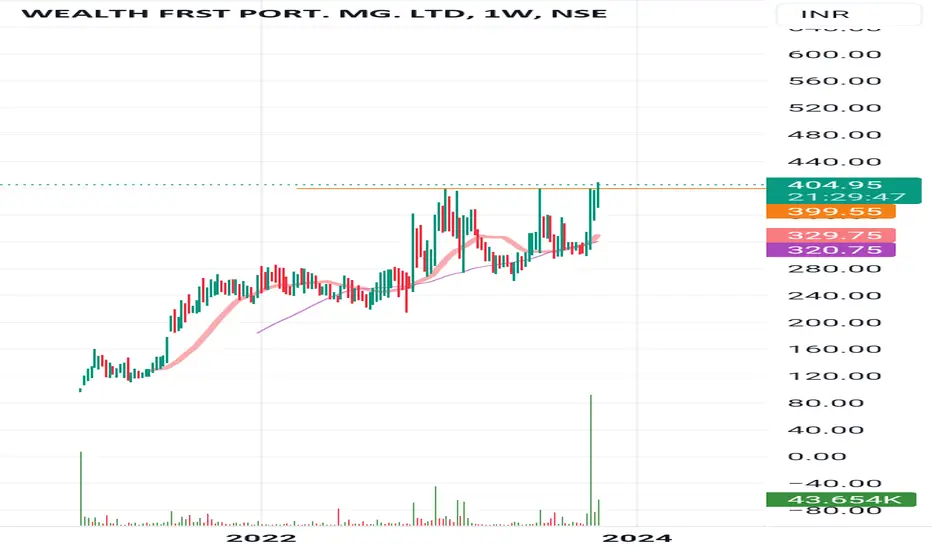
Life highBelow 370 for stop loss for the target of 470
No recommendation for buy and sell
Take own analysis
Stock multiple time try to break 400 level but not possible no breakout and sustain above this level
Be careful for global market 🐻 so take own analysis and risk no recommendation for buy and sell
Wait for 360Above 360 level must be sustain this above level them only give big move from this level
Volume in chart decent so must be sustain above 360 level
No recommendation for buy and sell

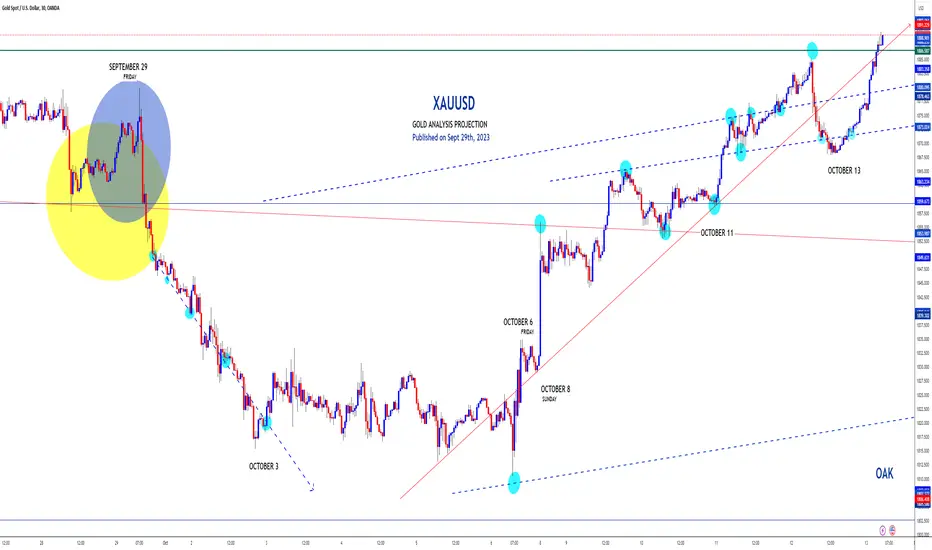
XAUUSD OAK Spider Trend Two Weeks After: A Gold's ProphecyXAUUSD Gold . The price liked some of the forecast analysis lines we published two weeks ago, nooding at and toching these slings on several ocassions. Dotted blue lines are four of the possible path directions I estimated for the price to continue its trend, published on September 29. I added one trend line here (not dotted).
The trend path lines I sketched over the daily timeframe graph as it is in my post. This is a 30 minutes time frame view. None of these lines were changed in their slope nor in their position, not even slightly altered in any way.
This can be verified in my Sept 29 XAUUSD analysis
XAUUSD OAK Spider Trend Analysis and 2023 Closing Forecast
OAK
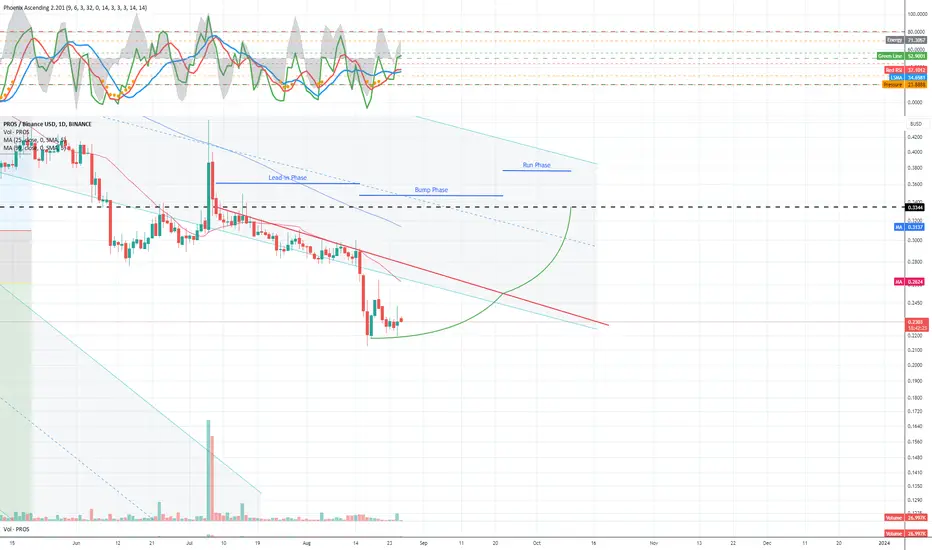
PROSBUSD - Bump and Run Reversal Bottom PatternThe bump-and-run reversal bottom is a chart pattern that is a surprisingly good performer in both bull (ranking best for performance) and bear markets (ranking second best). It has a low break even failure rate and high average rise after the breakout. Discovered by Thomas Bulkowski in 1999.
ChainLink Analysis For long-termHello Traders, here is the full analysis for Chainlink
let me know in the comment section below if you have any questions. I suggest you keep this analysis on your watch list and see what will happen and will my analysis will happen!!!
Today I want to talk about LINKUSD in a daily time frame
Before that, I want to remember It's not financial advice.
I'm just sharing my view and opinion of the chart. Please see and think about that. The situation is so complicated.
I will tell you the best zone to buy and hold Chainlink for the long term to get a huge profit.so, please be patient.
As you see in the chart, I want to explain everything by the Fibonacci Channel. Because it's so simple and easy to show you.
I draw 3 Green Zone to show you all the support zones. I believe that the first green zone will be broken. Sooner or later but it's sure.
So let's focus on the second one. I think it could be a strong zone to support the price but I think the market maker do anything to lose that to the third support zone.
I'm sure the 3rd green zone is the best place to buy and hold link for long term. it's really my favorite place. I will put my orders in this zone. because I believe that the future of Chainlink is bright.
If you have any questions, please don't hesitate to contact me.
Wish you the best
Sincerely Yours
Ho3ein.mnD
