ANKR/USDT – Weekly Macro Reversal from Historical Demand Zone!🧠 Analysis Overview:
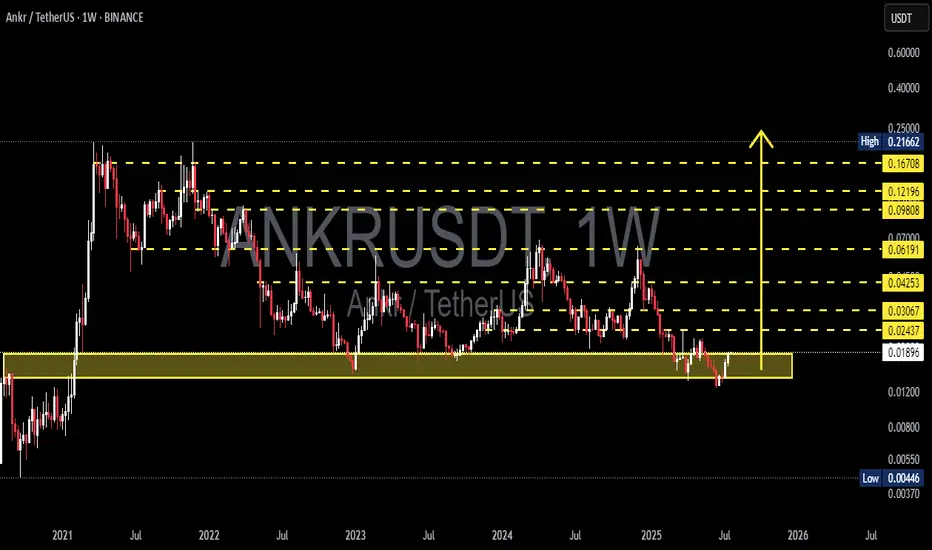
ANKR is showing strong signs of a potential macro reversal after bouncing off its historical demand zone around 0.017–0.019 USDT. This zone has proven to be a significant accumulation area in past cycles — fueling major rallies in both 2021 and 2023. The recent reaction at this level could mark the beginning of a substantial bullish leg in the mid-to-long term.
🔍 Pattern & Structure Breakdown:
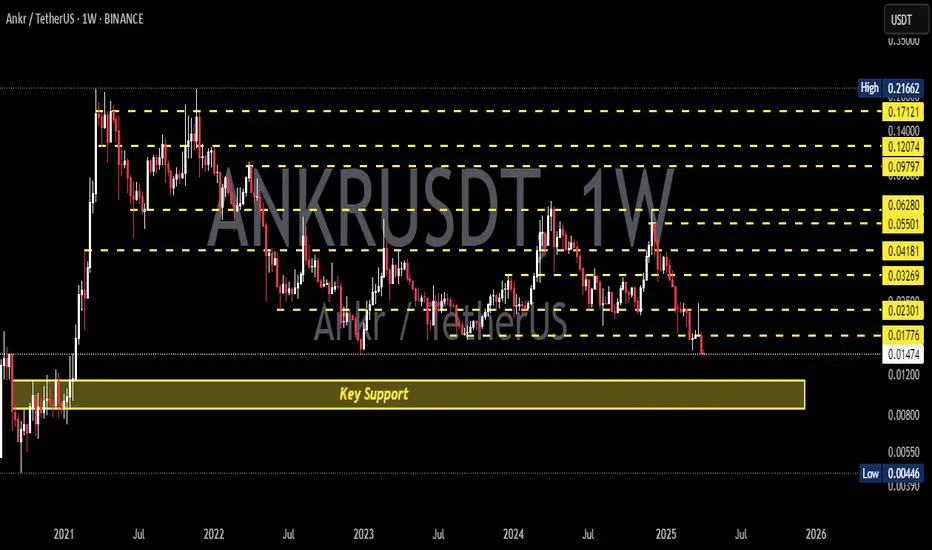
✅ Demand Zone Re-Tested:
This zone has been tested multiple times over the years and continues to attract buying interest, signaling institutional accumulation.
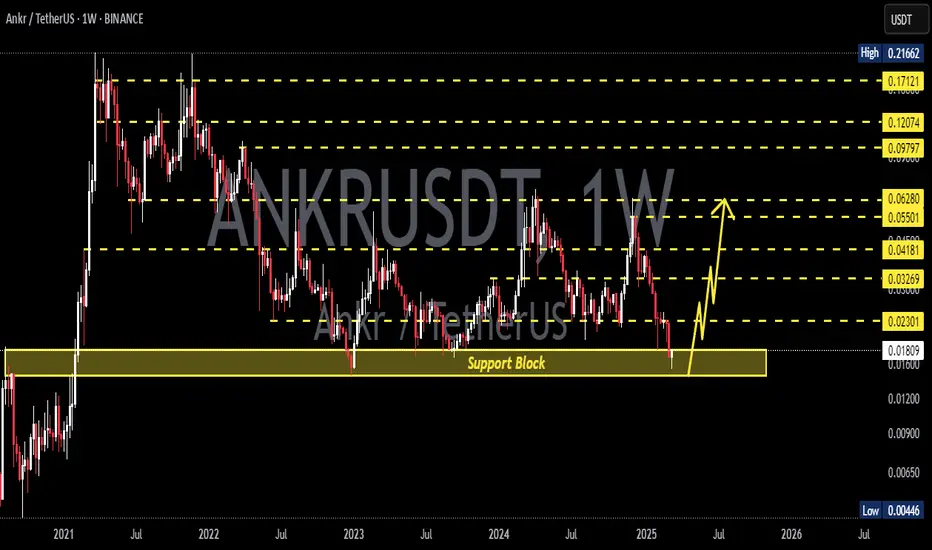
✅ Potential Weekly Double Bottom:
Price has formed a clear double bottom with a strong bullish rejection candle, indicating buyers are stepping back in.
✅ Macro Accumulation Range:
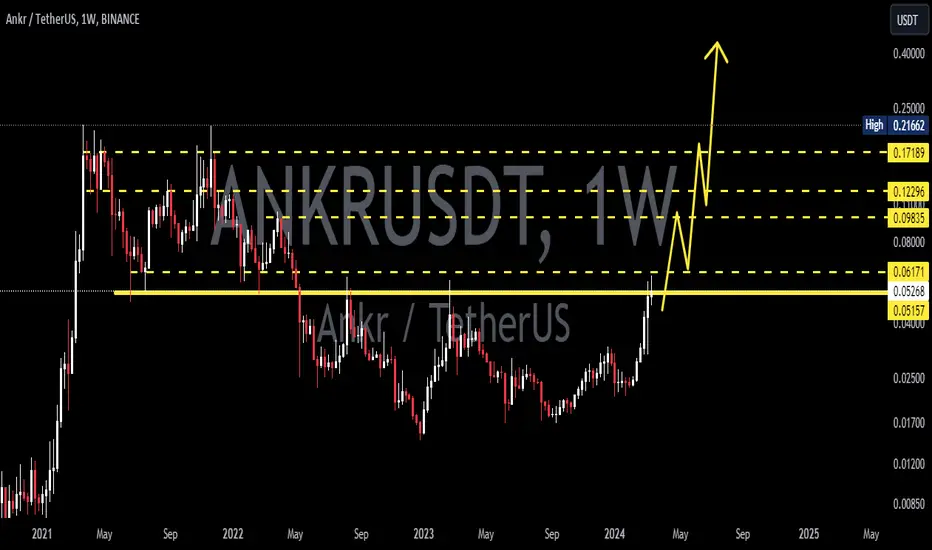
For nearly two years, ANKR has been ranging between 0.018 – 0.21 USDT. It’s currently at the bottom of that range, providing a high risk-reward opportunity.
✅ Fibonacci Extension Targets:
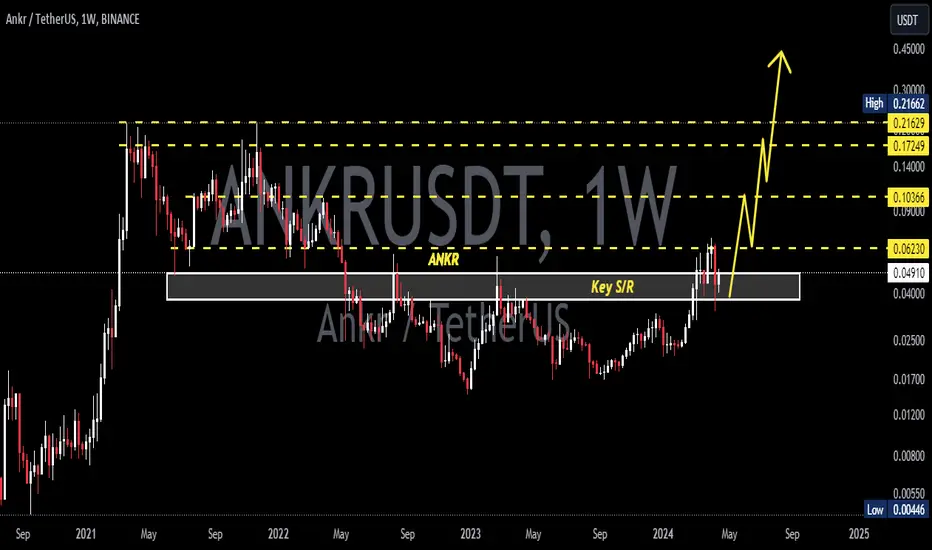
Well-defined horizontal resistances (in yellow) suggest clear roadmap targets for bullish continuation — ranging from 0.024 to 0.216.
🚀 Bullish Scenario (HIGH PROBABILITY SETUP):
Ideal Entry Zone: 0.018–0.020 USDT
Initial Breakout Confirmation: Above 0.02437
Progressive Targets:
0.03067 – minor resistance
0.04253 – previous swing high
0.06191 – historical supply
0.09808 – 0.12196 – prior distribution zone
0.16708 – 0.21662 – cycle top targets
🎯 Potential Upside: 200% – 1000%+
📈 Trend Reversal Confirmed: Once weekly higher-highs are established
⚠️ Bearish Scenario (RISK MANAGEMENT):
Breakdown below 0.01800 could trigger:
0.01200 (intermediate support)
0.00700 – 0.00446 (macro-level supports)
❗️Bearish Bias Valid: On weekly close below 0.01700 with strong selling volume
🧭 Conclusion:
> ANKR is currently at a critical macro support zone with a technically sound reversal setup.
For swing traders and mid-term investors, this is a strategic area to monitor for potential trend shift.
Tight risk, massive reward.
📌 Strategy Recommendation:
Use DCA (dollar-cost averaging) in the demand zone
Place conservative stop-loss below 0.01700
Watch for breakout with volume above 0.02437 to confirm bullish reversal
#ANKR #ANKRUSDT #CryptoReversal #AltcoinSetup #WeeklyChart #SwingTrade #AccumulationZone #TechnicalAnalysis #LowCapAltcoin #FibonacciTargets
Ankrusdttrading
ANKRUSDT 1WANKR ~ 1W Analysis
#ANKR Buy back when testing this support with a short -term target of at least 15%+.
ANKRUSDT 1WANKR ~ 1W Analysis
#ANKR If you still have a Conviction on this coin. Maybe this support block you can consider to start buying back with a short -term target of at least 20%+.
ANKRUSDT 1WANKR ~ 1W Analysis
#ANKR So far this support block continues to be maintained in Time Frime 1W. Buy from here if you still have a Conviction on this coin with a minimum target of 20%+
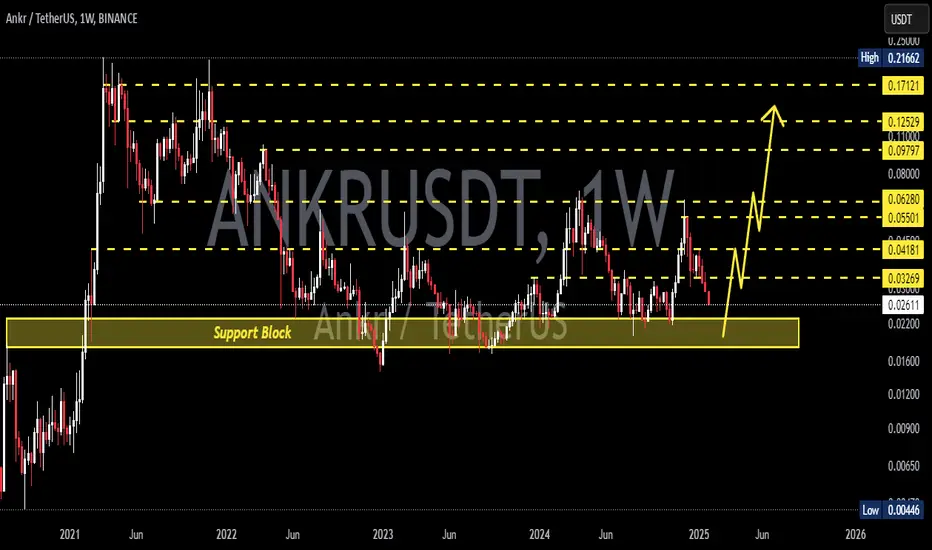
ANKRUSDT 1WANKR ~ 1W
#ANKR This support block is the golden ratio. if you still have Conviction on this coin,. Buy from here with a minimum target of 20%++
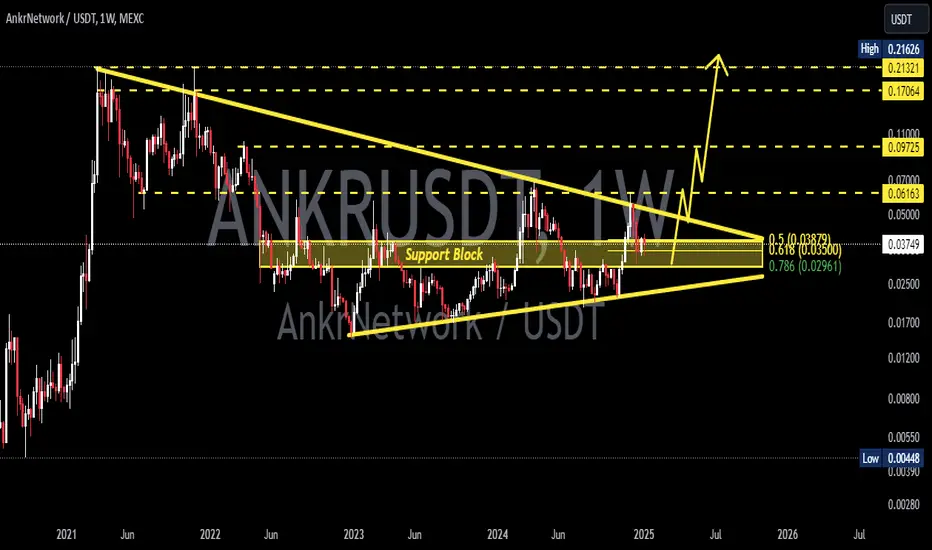
ANKRUSDTANKR ~ 1W
#ANKR Make gradual Buy on this support block. with a minimum target of 20%++. the reasons for this support block are quite strong for now.
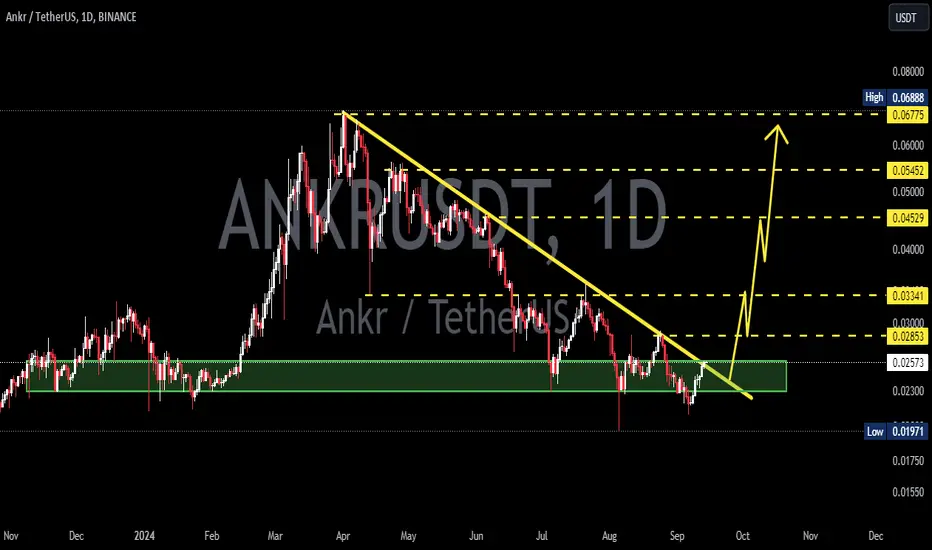
ANKRUSDTANKR ~ 1D ✅
#ANKR If you have Conviction on this coin,. You need to pay attention to this chart, which is very interesting.
price needs to hold above this descending resistance line for further upside.
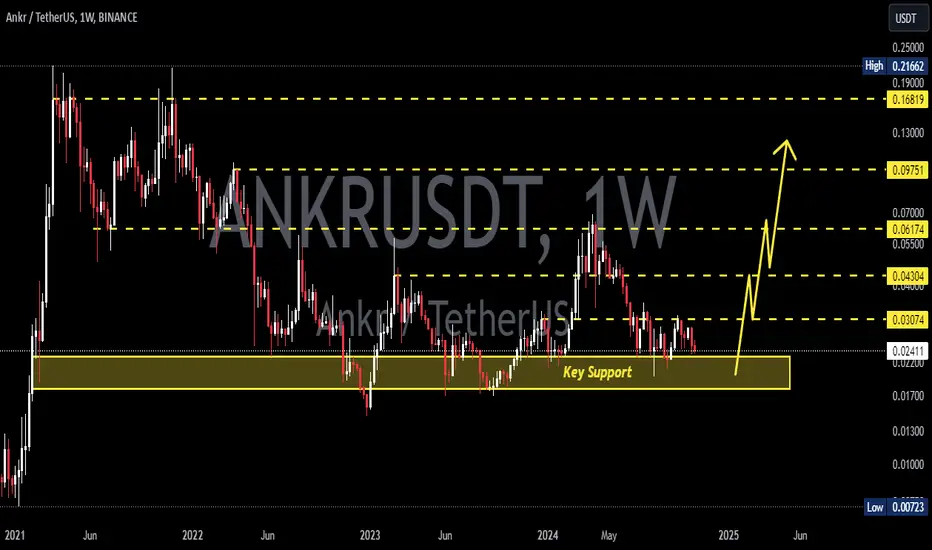
ANKRUSD 1WANKR ~ 1W 📈
#ANKR This is a Support Zone that has been successfully retested. It seems quite interesting to make small purchases here with a minimum target of 20%+ 🚀
ANKRUSD 1WANKR ~ 1W 📈
#ANKR Make purchases gradually from here, with a target of at least 20%+, Looks like the bulls are starting to show 😉
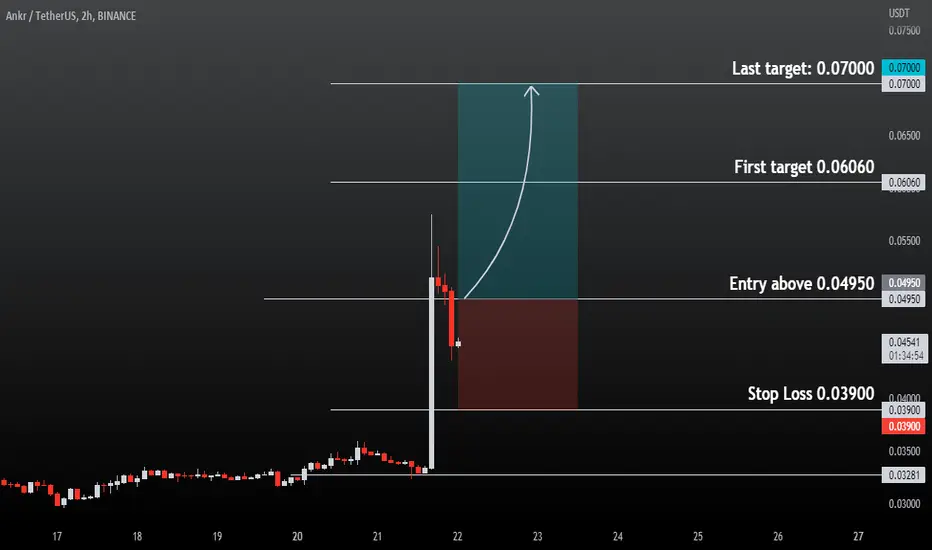
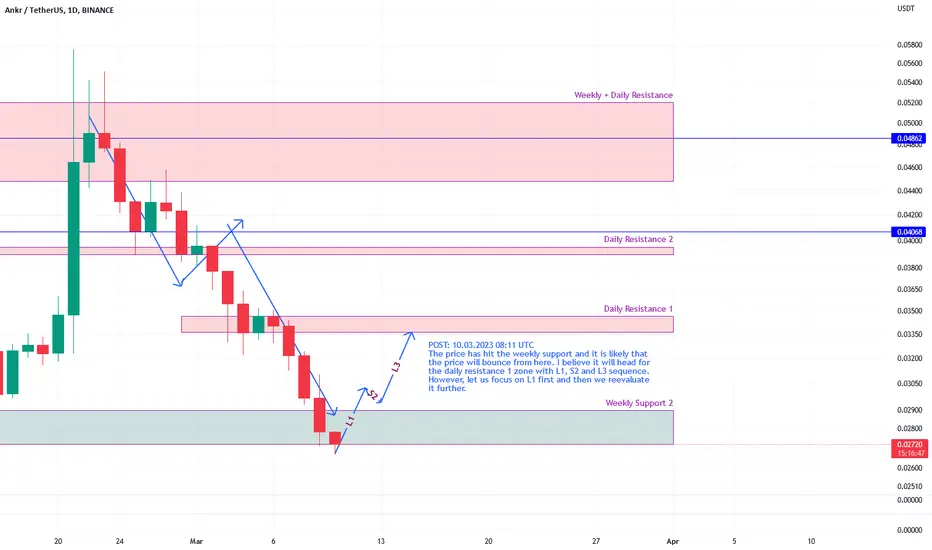
ANKRUSDT hit weekly support, likely to bounce to daily resistThe price has hit the weekly support and it is likely that the price will bounce from here. I believe it will head for the daily resistance 1 zone with L1, S2 and L3 sequence. However, let us focus on L1 first and then we reevaluate it further.
ANKRUSDT heading lower to next support zone around 0.0375ANKRUSDT has hit the weekly resistance zone. It is likely that it will be pushed down from here and price will head to weekly support 1 level as shown with path S1. There shall be a bounce from here as shown using path L2. However, in my opinion this support is not that strong compared to weekly support 2. Therefore, I am inclined to the possibility that price will break the first weekly support (weekly support 1) and head towards weekly support 2 zone. But that may change depending on how is the reaction of price on weekly support 1 zone. Therefore, let us focus on path S1 and we will then observe L2 to evaluate how S3 may look like. If we achieve step S3, then S4 should be a very strong bounce and the probability of that bounce being strong is very high. That bounce might pave for a higher high compared to the recent high.

ANKRUSDT IdeaANKRUSDT - ANKRUSD
✅ ✅ Risk warning, disclaimer: the above is a personal market judgment and analysis based on published information and historical chart data on The trading view,
And only some of these analyzes are my actual real trades.
I hope Traders consider I am Not responsible for your trades and investment decision.