APPLE WILL GO DOWN TOMORROW MORNINGHey guys,
I am new to day trading.I analyzed the daily chart of Apple.I predict a sloppy decrease for the stock.
Apple has a strong uptrend so i expect 4-5 dollars fall.
Resistant zone has been tested many times.i think there is no reason for breakout.let's see tomorrow
Please give me feedbacks if i miss anything at the chart.
"The more you know, the more you realized that you don't know"
Good luck everyone on Friday
APPL


$APPL Tomorrow will decide the directionThe longterm trend is up, short term trend is also up. However, the current trading price is close to a long-term resistance level and the MACD is about to cross down. This makes me unsure without seeing how the first half of Monday goes... if the bottom of the area indicated in red is broken, then it's a long way down. Otherwise, a long position is the right play.

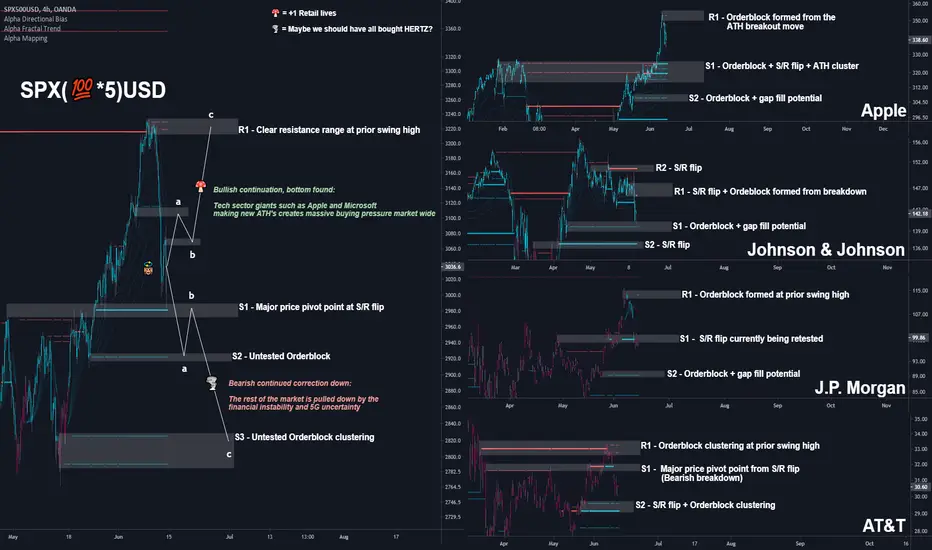
MARKET OVERVIEW 👨👩👧👦 | $SPY + $APPL + $JNJ + $JPM + $T📊📊📊Let's take a look at the S&P, Apple, Johnson and Johnson, and AT&T. Today we are looking to see if we can find the direction of the market going into the week by analyzing some top S&P holdings that are indicative of different key sectors.
The idea is to look at two bullish sector charts Apple (tech) and Johnson and Johnson (healthcare), and two bearish charts JP. Morgan (financials) and AT&T (communications), to see if we can find the direction of the market.
While our money is on more upside eventually (especially with Apple making an All-Time High (ATH), zero interest rates, and stimulus outweighing temporary slow recovery concerns), we want to know if the bears of the market pull us down or the bulls can sustain continued uptrend going into the week.
This write up took a long time so please Hit that 👍 button to show support for the content and help us grow 🐣
---
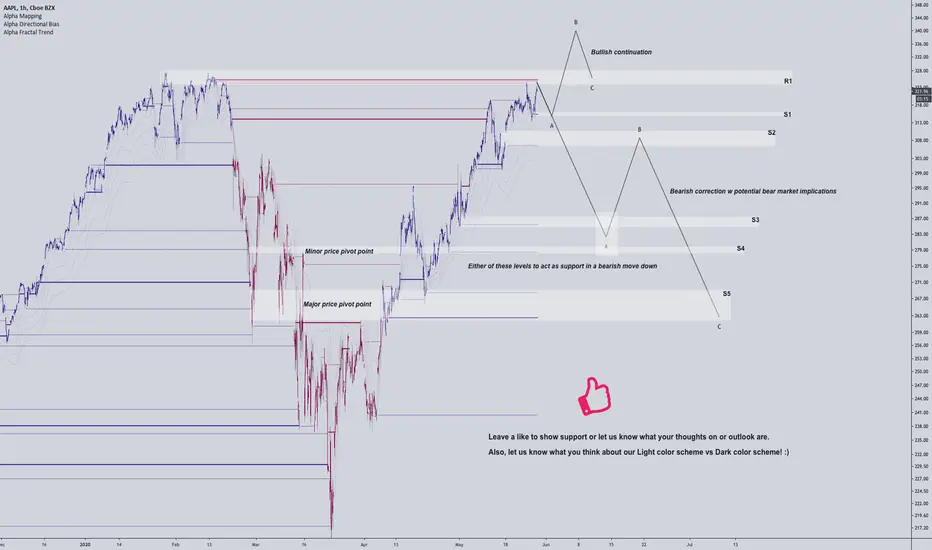
S&P 500 Index
Support S&P:
We have found a reaction on the S1 major price pivot point at the S/R flip. This is of course the ideal spot for the bulls to find support. If that last wick was the only test of this level we end up getting, all the better for the bulls.
If we do need to test lower levels, then the S2 untested bullish orderblock right below us provides another chance at retaining a bullish market structure.
If neither of these hold, the bulls have one last chance at the uptrend with the S3 orderblock cluster and previous range lows. A grind down to this level like we see with AT&T seems like one possible pathway there.
Resistance S&P:
The main resistance we will be looking at with most of these charts is seen in the S&P's R1 orderblock cluster at the previous swing high.
Regardless of where we find support, this resistance will be the main point of contention.
---
Apple
Support APPL:
Apple is by far the most bullish asset here. It is also the top holding of the S&P. The major support for Apple is the S1 orderblock and S/R flip cluster at the previous All-Time High. For the rest of the market to retain a bullish structure, S1 holding is key.
If S1 can't hold, the S2 orderblock and gap-fill is the next best hope for the bulls. The bulls don't want to see any weakness for Apple, so holding these levels and making new highs is key.
Resistance APPL:
Apple resembles the S&P, and that is logical because it is the biggest S&P holding. Rejection at R1 for Apple means no new ATH. Breaking R1 means a new ATH. How Apple reacts matters for the market. We see this one being broken eventually, but it has to happen sooner rather than later to lift the rest of the market up and avoid a "slow recovery."
---
Johnson & Johnson
Support JNJ:
The S1 orderblock and gap-fill on JNJ is about to be tested and is the ideal support. Finding support here means another point for the S&P bulls because we get JNJ working for us and not against us.
If S1 can't hold, we have S2 not too far away, this plays into the S&P's S2 holding as well. A dip this low isn't ideal, but the bullish market structure isn't broken if S2 holds.
Resistance JNJ:
JNJ has been correcting longer than most of the stocks on this chart. Of course, it also has a more bullish overall structure than our JPM and T bearish charts. For JNJ though, the longer correction means more levels of resistance, both the R1 S/R and orderblock and R2 S/R stand in the way for JNJ. This makes it a little harder to rely on than Apple from a pure TA perspective.
---
J.P. Morgan
Support JPM:
Big banks have their pros and cons right now, but for the market to reflect those pros S1 holding is ideal. JPM could be off to the races, or it could be making a drawn-out bottom formation.
A retest of S2 gives weight to that long drawn out bottom, therefore the big bank and S&P bulls want S1 to hold so we can maintain momentum.
Resistance JPM:
The primary resistance for J.P. Morgan is the R1 orderblock at the prior swing high. The recent market structure is similar to Apple and the S&P as a whole, it is only the previous structure that signals that JPM is a weaker asset currently. Some good JPM fundamentals could help the S&P here.
---
AT&T
Support T:
AT&T is the most bearish S&P holding we are charting. It lost its major support and is onto the S2 S/R and orderblock cluster. If this one doesn't hold, giving us a higher low, then we are simply retesting the COVID lows. If major holdings start breaking down to new lows, its a bad look for the market. The best way to avoid making new lows is not to retest old lows and instead to make lower highs. This is what the bulls want from T.
Resistance T:
Even though this is the most bearish chart, there isn't a ton of noteworthy resistance, which is a good thing. R1 is the main resistance for T. This range is notable as it was a previous resistance as well, T has this in common with the S&P... which helps confirm R1 being an important level to breach for the bulls.
---
Summary:
The S&P rallying from here or consolidating above S1 would be ideal for the bulls. For this, we need the more bullish S&P holdings like APPL and JNJ to hold their respective support levels and then rally while weaker holdings like JPM and AT&T avoid too much further correction.
If some of the weaker holdings can find support at their current ranges, or perhaps even at the next range down while the more bullish holdings stay their ground, then we could still be looking for S1 and S2 to hold for the S&P.
However, if the market tries to go bear, then we would more be looking big tech like Apple to hold up the rest of the market like Atlas while we eye S3 for support for the S&P.
It seems unlikely that we make new lows, and so we are looking for support to hold overall, but a trip down to S3 certainly will have an overall market recovery mimicking the slower recovery noted by the FED and this scenario likely results in retests of the bottom for some of the weaker S&P holdings.
Will the S&P pull an Apple and aim for new All-Time Highs, will it correct for a bit like JNJ perhaps taking us to S3, or are we going to get a JPM and T style upset? That is the question.
Resources:
www.zacks.com + www.nytimes.com
APPL Long- 8% Monday?Strong buy signals coming from APPL at present. Good medium term hold. Shorter term, wait for RSI to cross. Potential for small correction before it continues upwards.

Microsoft ($MSFT) and Apple ($APPL) 💻 | New Highs for the Market🐮🖥️🐮 Apple and Microsoft are giants of tech and some of the largest holdings of the major indexes. If these companies run, not to mention the other tech giants like Facebook and Alphabet, then the markets will almost certainly run with them.
Just look at the top 5 holdings of the S&P :
Microsoft Corporation 5.68%
Apple Inc. 5.60%
Amazon.com, Inc. 4.26%
Facebook, Inc. Class A2.16%
Alphabet Inc. Class A1.68%
Alphabet Inc. Class C1.68%
Here are the top 5 holdings of the Nasdaq :
Apple Inc. 11.83%
Microsoft Corporation 11.41%
Amazon.com, Inc. 10.25%
Facebook, Inc. Class A 4.35%
Alphabet Inc. Class A 3.88%
Alphabet Inc. Class C 3.85%
Here is the top DOW holdings With non-tech excluded (Microsoft is the 6th on the list, Apple is still #1):
Apple Inc.9.14%
Microsoft Corporation 5.07%
It should be obvious to you now what we mean when we say " if these stocks run, then the market runs ." We mean, they are the biggest parts of the major indexes!
This is good news for the bulls, because run is exactly what is about to happen based on historical trends.
Some people seem to think that these tech stocks rushing past new all-time-highs perhaps signals the top of not only these companies but the market. In fact, we commonly hear this sort of sentiment every time it happens. Reality is just the opposite.
The fact that these companies are breaking all-time-highs is actually bullish for them and the market as a whole.
On top of that, the news is bullish for these companies as well (COVID aside). We have new iPhones, a slick new MacBook Pro, a new Surface Duo, and a declaration against Face ID for Microsoft.
In short, there is nothing really substantial to bring these giants down aside from the broader market, but again, it is more likely they bring the market up. Don't take our word for it though, the historic patterns are clearly illustrated on our charts.
On the charts, you can see yellow horizontal lines marking off each new high. You can clearly see that the longstanding pattern is that breaking a new high is bullish for both Apple and Microsoft (with this being true in spite of any bearish disbelief).
In summary, breaking all-time-highs with conviction is bullish for the tech giants, which is bullish for the markets. So after that last break, our only questions are "when" and "how high?"
Resources: www.etf.com + www.forbes.com + www.forbes.com + www.foxnews.com + mspoweruser.com
✨ Drop a comment asking for an update, we do NEW setups every day! ✨
Like, Comment & Follow to help the community grow 🎉🎉

Just coindence ? Shocking truth ! All bubbles are the same !Hello everyone,
Today I´ve decided to show you something shocking.
People say they stick to stocks and do not trade Bitcoin or other cryptocurrencies because they are manipulated.
I have no proof that it is true or it isn´t but if so stocks are too !
Just look at this fractal (purple trend) is copied from right side (Bitcoin) and set to Apple trend.
It fits so much and the conformity is almost 99% even the price grow and corrections are almost the same.
Wanna see more ? Look for further data in chart below. It can reveal where APPL is going next.
-------------
Disclaimer:
I´m not registered or licensed in any jurisdiction whatsoever to provide investing advice or anything of an advisory or consultancy nature, and therefore I´m unqualified to give investment recommendations.
Always do your own research and consult with a licensed investment professional before investing.
This communication is never to be used as the basis of making investment decisions, and it is for entertainment purposes only.

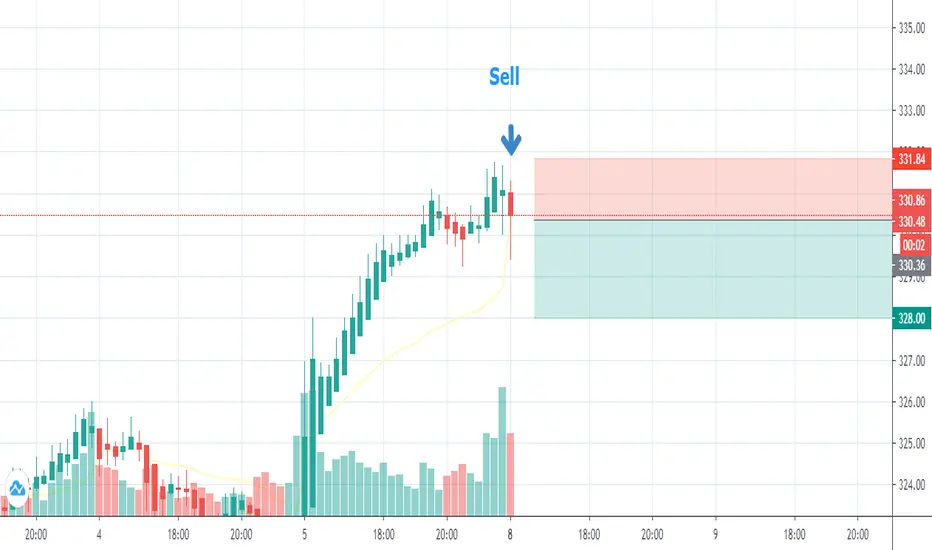
APPL in case ↘↘Depending on a lot of sign APPL going to be With a huge endurance decreased and it's the perfect time to sell
AAPL WEEK ANALYSISApple breaks record highs while the recovery of the covid continues with the opening of stores.
Without more data, the analysis expects a rise to at least 340, and then make a correction.

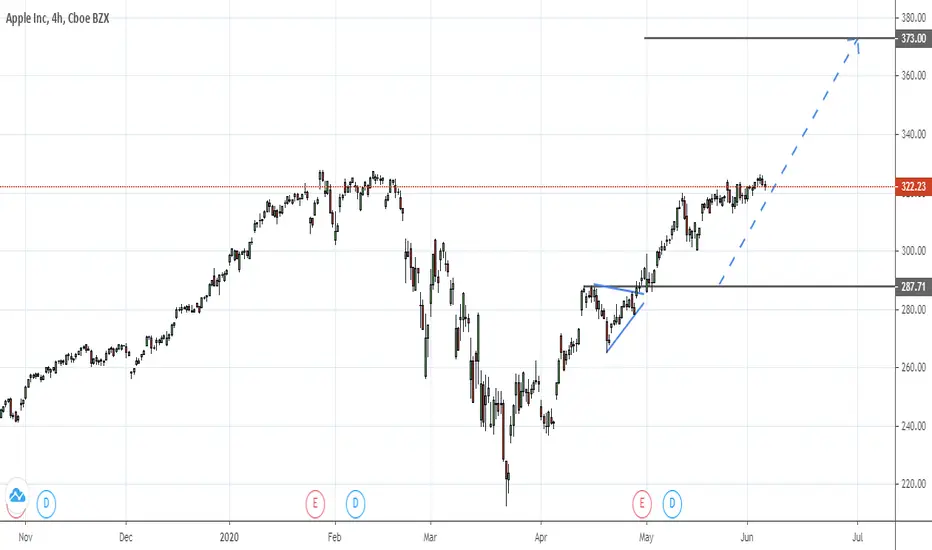


The Broader Market May be in Apple's Hands 🍎 | APPLE ($APPL)🍎 Our last Apple chart played out like clockwork, now it is time to see what happens next.
Apple is generally highly correlated with the broader market. Luckily for the broader market Apple stores reopening and hype about the iPhone 12 may just be enough to push Apple up past resistance. Plus, although it began to decline yesterday, the relatively high short volume ratio doesn't hurt either (as those trying to short the top could be squeezed on a move up; perhaps this weekend).
Right now we are sort of at the mother of all resistances for Apple, we are right back at the all-time-high seen before the COVID crash. Our goal here is simple, to show the last resistance level on the chart and otherwise to map out support levels that will only come into play if Apple can't break resistance or if it comes back down later.
Directly above us we have the R1 orderblock + S/R flip cluster which includes the previous all-time-high for Apple. If we break this and get bullish continuation, then this level becomes potential support to retest before continuing higher after.
Below us we have a number of key levels, these include S1 which may act as a local support before moving higher. Then we have the S2 range created from a gap and orderblock. If those levels don't hold we do have support at S3 - S5 as well, although a move here implies a bearish path for Apple and almost certainly the broader market.
Resource: www.cnbc.com + 9to5mac.com + www.forbes.com + fintel.io
✨ Drop a comment asking for an update, we do NEW setups every day! ✨
Like, Comment & Follow to help the community grow 🎉🎉
Apple Stock/APPLit seems like there will be a short descending trend and price will go down nearly 235-250 $ and from there there will be a strong ascending trend.
Good luck ;)


The river of nonsense So here we are - and so let me be.
Rejected at top, looking to be free,
We fall below levels that exist,
To create false hope and blurry doubt mist.
You think you know the support line,
Drawn it precisely to meet your guideline,
Your charting style and wise strategy,
So watch this sharp knife, bloodily falling with thee.
And let me be...
An Apple a day will keep anyone away, If thrown Hard enough !Keep Calm and eat an apple!
Wait for price come below 212
Thanks

My Analysis On Apple StockMy Analysis On Apple Stock.
**Disclaimer** the content on this analysis is subject to change at any time without notice, and is provided for the sole purpose of assisting traders to make independent investment decisions.


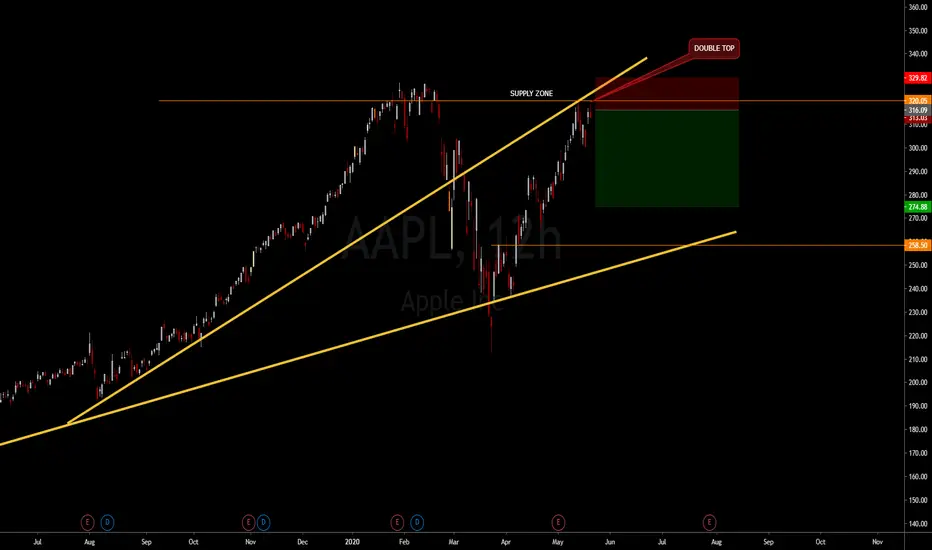
Apple to retraceAPPL has suffered a strong rejection + retest (making a double top) at the supply zone.
Good spot to look to sell short. also this rejection creates a bearish over under pattern, SL should go above head.